Redis is single-threaded, so a slow query blocks every request behind it. A single query taking 20 seconds can make your service unavailable. This tutorial shows you how to collect Redis slow logs with Rsbeat, index them in Alibaba Cloud Elasticsearch, and visualize them in Kibana—so you can identify slow keys and problematic commands before they cause outages.
How it works
Rsbeat polls the ApsaraDB for Redis instance at a configurable interval, reads slow log entries using the SLOWLOG GET command, and ships them to Alibaba Cloud Elasticsearch. Kibana then lets you explore and visualize the data.
Prerequisites
Before you begin, ensure that you have:
An Alibaba Cloud Elasticsearch cluster with Auto Indexing enabled (V6.7 Standard Edition used in this tutorial; versions 5.5.3, 6.3.2, 6.7.0, 6.8.0, and 7.4.0 are supported)
An ApsaraDB for Redis instance (V5.0 Community Edition used in this tutorial)
An Elastic Compute Service (ECS) instance running 64-bit CentOS 7.6
All three resources in the same Virtual Private Cloud (VPC)
Set up the infrastructure
Create an Alibaba Cloud Elasticsearch cluster with Auto Indexing enabled. See Create an Alibaba Cloud Elasticsearch cluster and Configure the YML file.
Create an ApsaraDB for Redis instance in the same VPC as the Elasticsearch cluster. This lets Rsbeat, running on ECS, reach Elasticsearch over the internal network. See Create an ApsaraDB for Redis instance.
Create an ECS instance in the same VPC. See Create an instance by using the wizard.
Add the private IP address of the ECS instance to an IP address whitelist of the ApsaraDB for Redis instance. See Configure whitelists.
Step 1: Configure slow query parameters for ApsaraDB for Redis
Log on to the ApsaraDB for Redis console.
In the top navigation bar, select a region.
On the Instances page, click the ID of the ApsaraDB for Redis instance.
In the left-side navigation pane, click System Parameters.
On the System Parameters tab, locate slowlog-log-slower-than and slowlog-max-len, then modify them based on your requirements.
Parameter Description Example value slowlog-log-slower-thanCommands whose execution time exceeds this threshold are recorded as slow logs. The runtime does not include the time spent in queuing. Unit: microseconds. Default: 10000 (10 ms). Set to a negative number to disable slow log recording. Set to 0 to record all commands. 20000 (records commands taking longer than 20 ms) slowlog-max-lenMaximum number of slow log entries to retain. When the limit is reached, Redis discards the oldest entries. 100
Step 2: Install and configure Rsbeat
Connect to the ECS instance. See Connect to an ECS instance.
Download and decompress Rsbeat 5.3.2.
wget https://github.com/Yourdream/rsbeat/archive/master.zip
unzip master.zip
Open the Rsbeat configuration file.
cd rsbeat-master
vim rsbeat.yml
Update the
rsbeatandoutput.elasticsearchsections with your environment details, then save the file.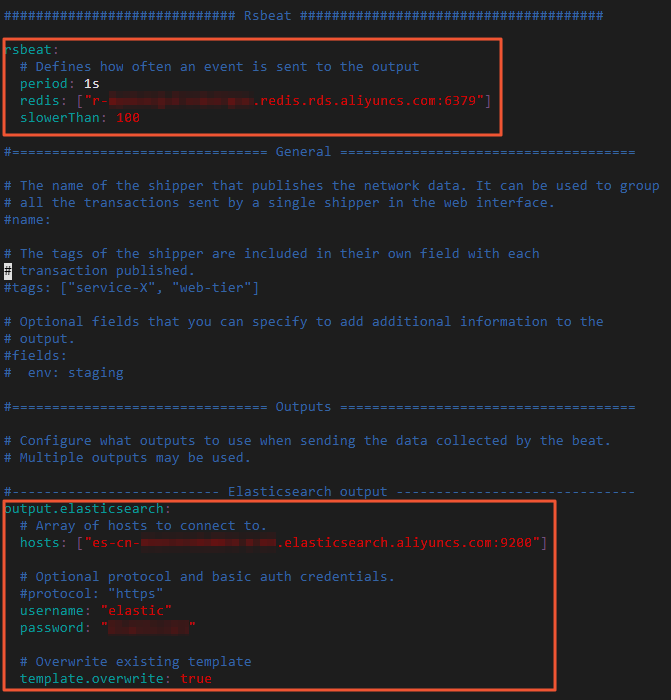
`rsbeat` section
Parameter Description periodHow often Rsbeat sends slow log entries to Elasticsearch redisConnection endpoint of the ApsaraDB for Redis instance. See View endpoints. slowerThanThreshold passed to the config set slowlog-log-slower-thancommand on the Redis server. Unit: microseconds.ImportantThe password for accessing the ApsaraDB for Redis instance is not specified in the Rsbeat configuration file. To enable Rsbeat to access the ApsaraDB for Redis instance, you must enable password-free access after you obtain the endpoint. See Enable password-free access.
`output.elasticsearch` section
Parameter Description hostsEndpoint of the Elasticsearch cluster. Find it on the Basic Information page of the cluster. See View the basic information of a cluster. usernameElasticsearch username. Default: elastic.passwordPassword set when you created the Elasticsearch cluster. To reset it, see Reset the access password for an Elasticsearch cluster. template.overwriteWhether the Rsbeat index template overwrites an existing template with the same name in Elasticsearch. Default: true.Start Rsbeat.
./rsbeat.linux.amd64 -c rsbeat.yml -e -d "*"
Step 3: Analyze Redis slow logs in Kibana
Create an index pattern
Log on to the Kibana console of the Elasticsearch cluster. See Log on to the Kibana console.
In the left-side navigation pane, click Management.
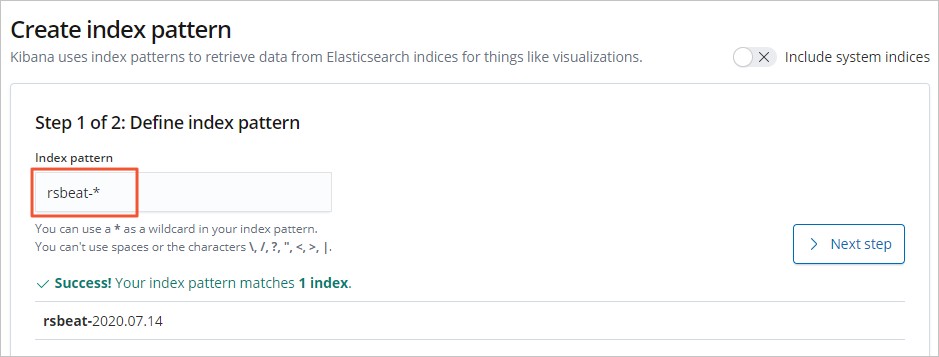
In the Kibana section, click Index Patterns, then click Create index pattern.
In the Index pattern field, enter the index pattern name and click Next step.
Set Time Filter field name to @timestamp, then click Create index pattern.
View slow log details
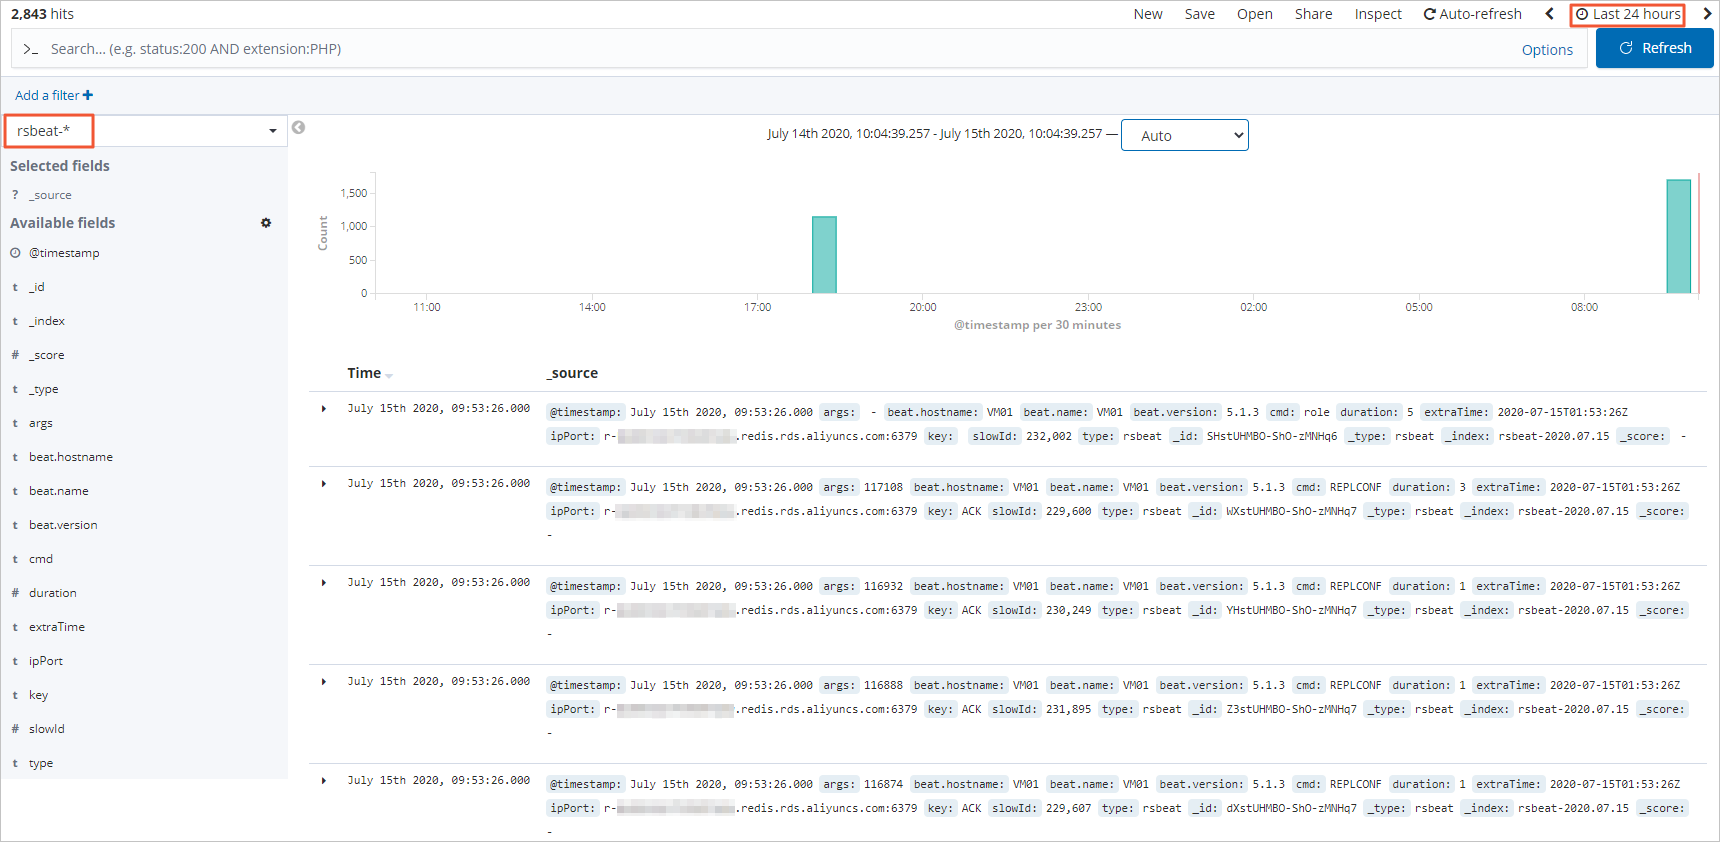
In the left-side navigation pane, click Discover.
From the drop-down list below Add a filter, select rsbeat-\*.
In the upper-right corner, select a time range to view the slow log entries for that period.
Identify the top 10 keys with the most slow log entries
Create a pie chart to rank the keys with the highest number of slow log entries.
In the left-side navigation pane, click Visualize.
On the Visualize page, click the
 icon.
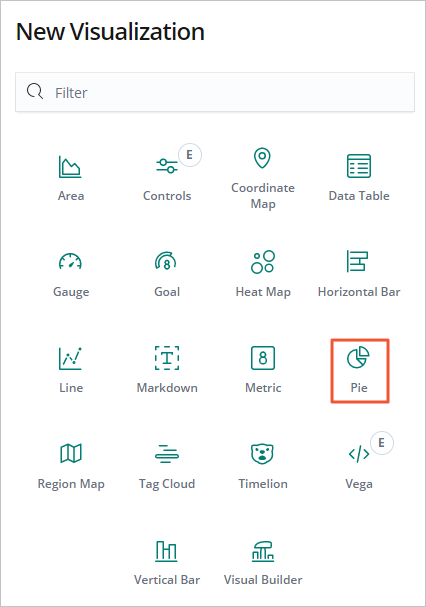
icon.In the New Visualization dialog box, click Pie.
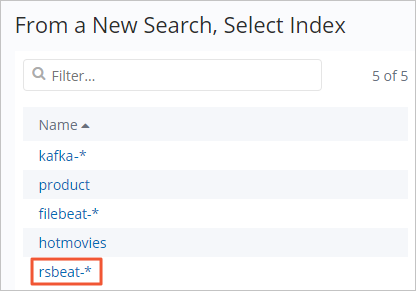
Under From a New Search, Select Index, click rsbeat-\*.
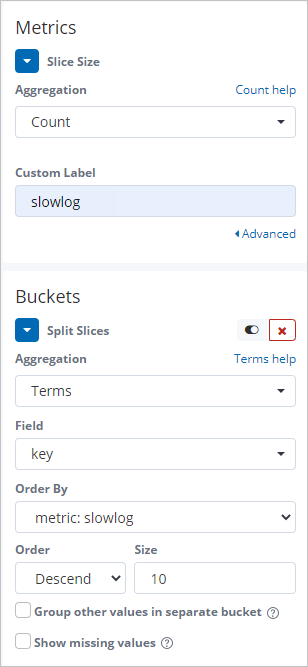
Configure the Metrics and Buckets sections as shown in the following figure.
Click the
 icon to run the visualization. The chart shows the top 10 keys ranked by slow log count in descending order.
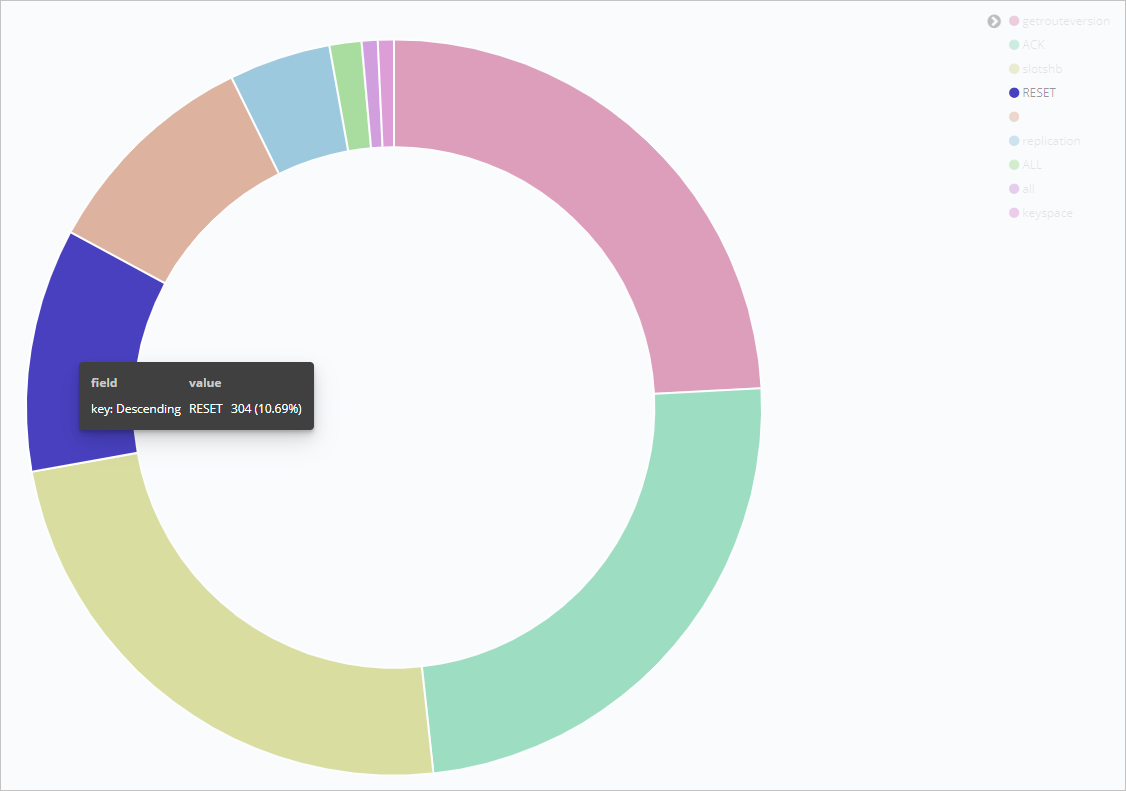
For more information about Kibana, see the Kibana User Guide.