Configure data quality monitoring for E-MapReduce (EMR) tables so that each time a scheduling node writes data, the system automatically checks whether the output meets your quality expectations. When a check fails, the system triggers an alert and blocks downstream nodes from running.
This tutorial walks through setting up monitoring for the dwd_log_info_di_emr table: creating a monitor, attaching a strong rule that checks whether the table contains data, running a test, and subscribing to alert notifications.
How it works
Data quality monitoring in DataWorks has two layers:
| Layer | Purpose | What it defines |
|---|---|---|
| Monitor | When and where to check | The partition to inspect (dt=$[yyyymmdd-1]) and the trigger (node completion) |
| Monitoring rule | What to check | The condition to evaluate against the identified partition |
When the scheduling node for dwd_log_info_di_emr completes, it triggers the monitor. The monitor locates yesterday's partition (dt=$[yyyymmdd-1]) and runs the attached rules against it.
The rule's degree of importance determines what happens when the check fails:
| Degree of importance | On failure |
|---|---|
| Strong rule | Triggers an alert, fails the current node, and blocks all downstream nodes |
Prerequisites
Before you begin, make sure that you have:
-
Synchronized your source data into the EMR environment
-
Processed the data to produce the
dwd_log_info_di_emrtable
Step 1: Open the Configure by Table page
-
Log on to the DataWorks console. In the top navigation bar, select your region.
-
In the left-side navigation pane, choose Data Governance > Data Quality. Select your workspace from the drop-down list and click Go to Data Quality.
-
In the left-side navigation pane of the Data Quality page, choose Configure Rules > Configure by Table.
-
On the Configure by Table page, filter for the
dwd_log_info_di_emrtable:-
In the Connection section, select E-MapReduce.
-
Use the filter fields on the right to search for
dwd_log_info_di_emr.
-
-
In the search results, find the table and click Rule Management in the Actions column. The Table Quality Details page opens.
Step 2: Create a monitor
The monitor defines which partition to inspect and what triggers the inspection.
-
On the Monitor tab, click Create Monitor.
-
Set the following parameters:
Parameter Value Description Data Range dt=$[yyyymmdd-1]Targets yesterday's partition each time the monitor runs. Monitoring Rule Leave blank Attach rules in Step 3. Trigger Method Triggered by Node Scheduling in Production Environment Select the dwd_log_info_di_emrnode that is created during data processing. The monitor fires each time this node completes in production.
For the full list of monitor parameters, see Configure a monitoring rule for a single table.
Step 3: Add a monitoring rule
This step attaches a rule to the monitor. The dwd_log_info_di_emr table processes data from the ods_raw_log_d_emr table. The rule checks whether the dwd_log_info_di_emr table has any rows in the target partition. If the row count is 0, the rule concludes that the ancestor node did not write data to the partition.
Because this rule is configured as a strong rule, a row count of 0 causes:
-
An alert to fire
-
The
dwd_log_info_di_emrnode to fail and exit -
Downstream nodes to be blocked from running
To add the rule:
-
In the Monitor Perspective section of the Rule Management tab, select the
raw_log_number_of_table_rows_not_0monitor, then click Create Rule. The Create Rule panel opens.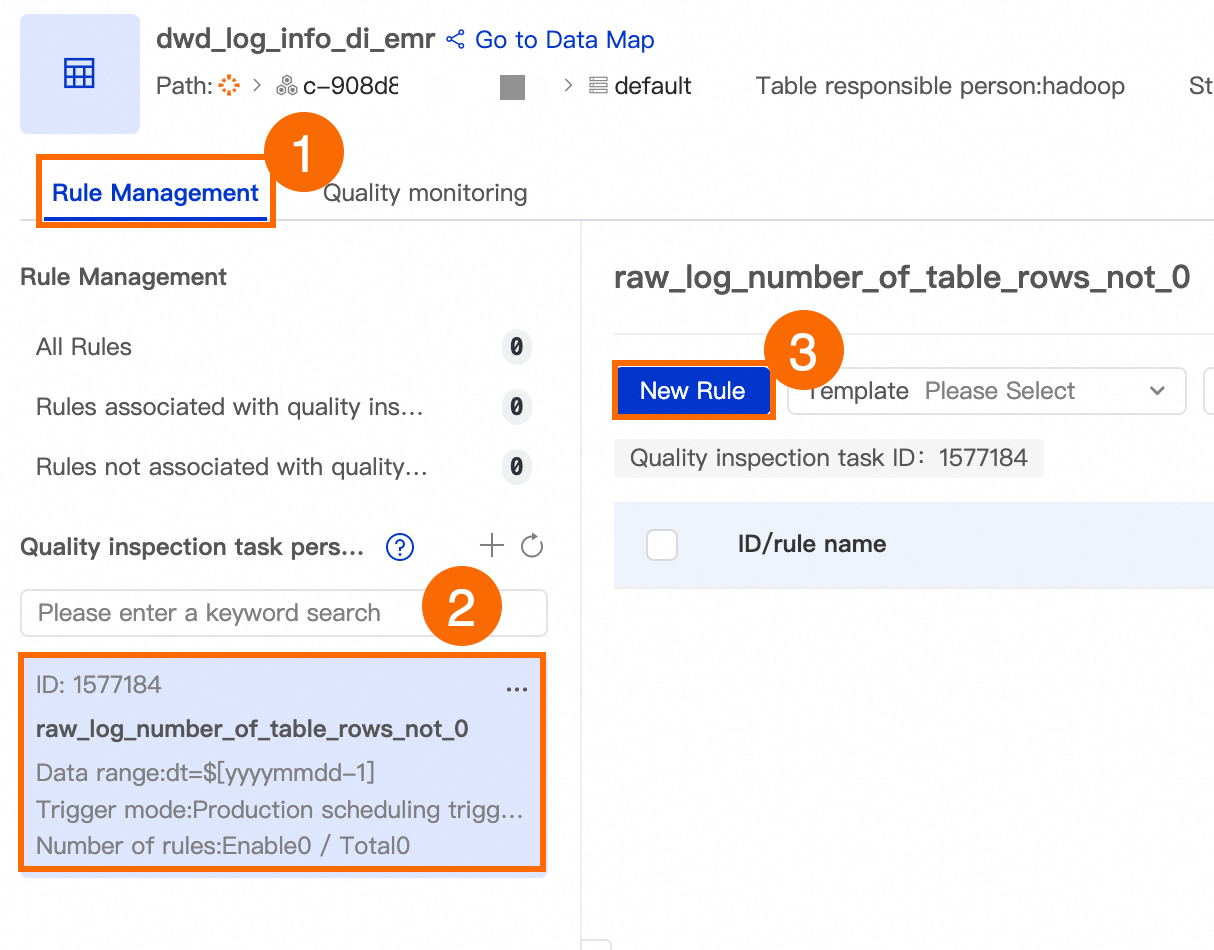
-
On the System Template tab, find Table is not empty and click Use. On the right side of the panel, set Degree of Importance to Strong Rule.
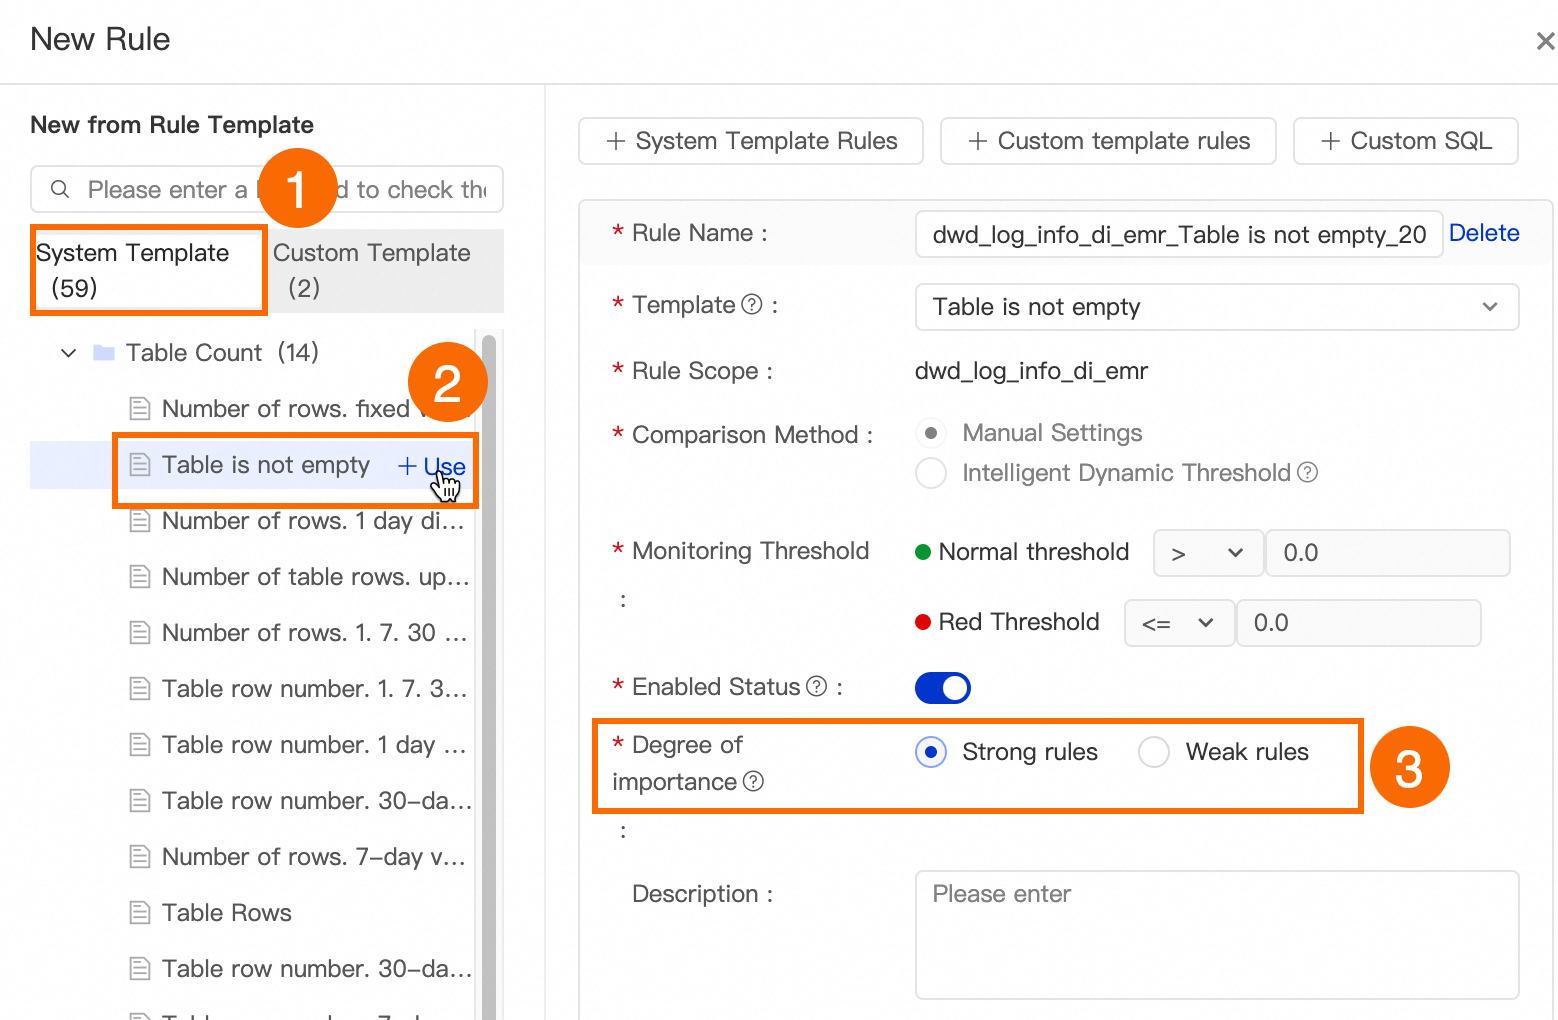
-
Click Determine.
For other rule parameters, see Configure a monitoring rule for a single table.
Step 4: Test the monitor
Run a test to verify that the monitor and its rules behave as expected before the configuration goes live in production.
-
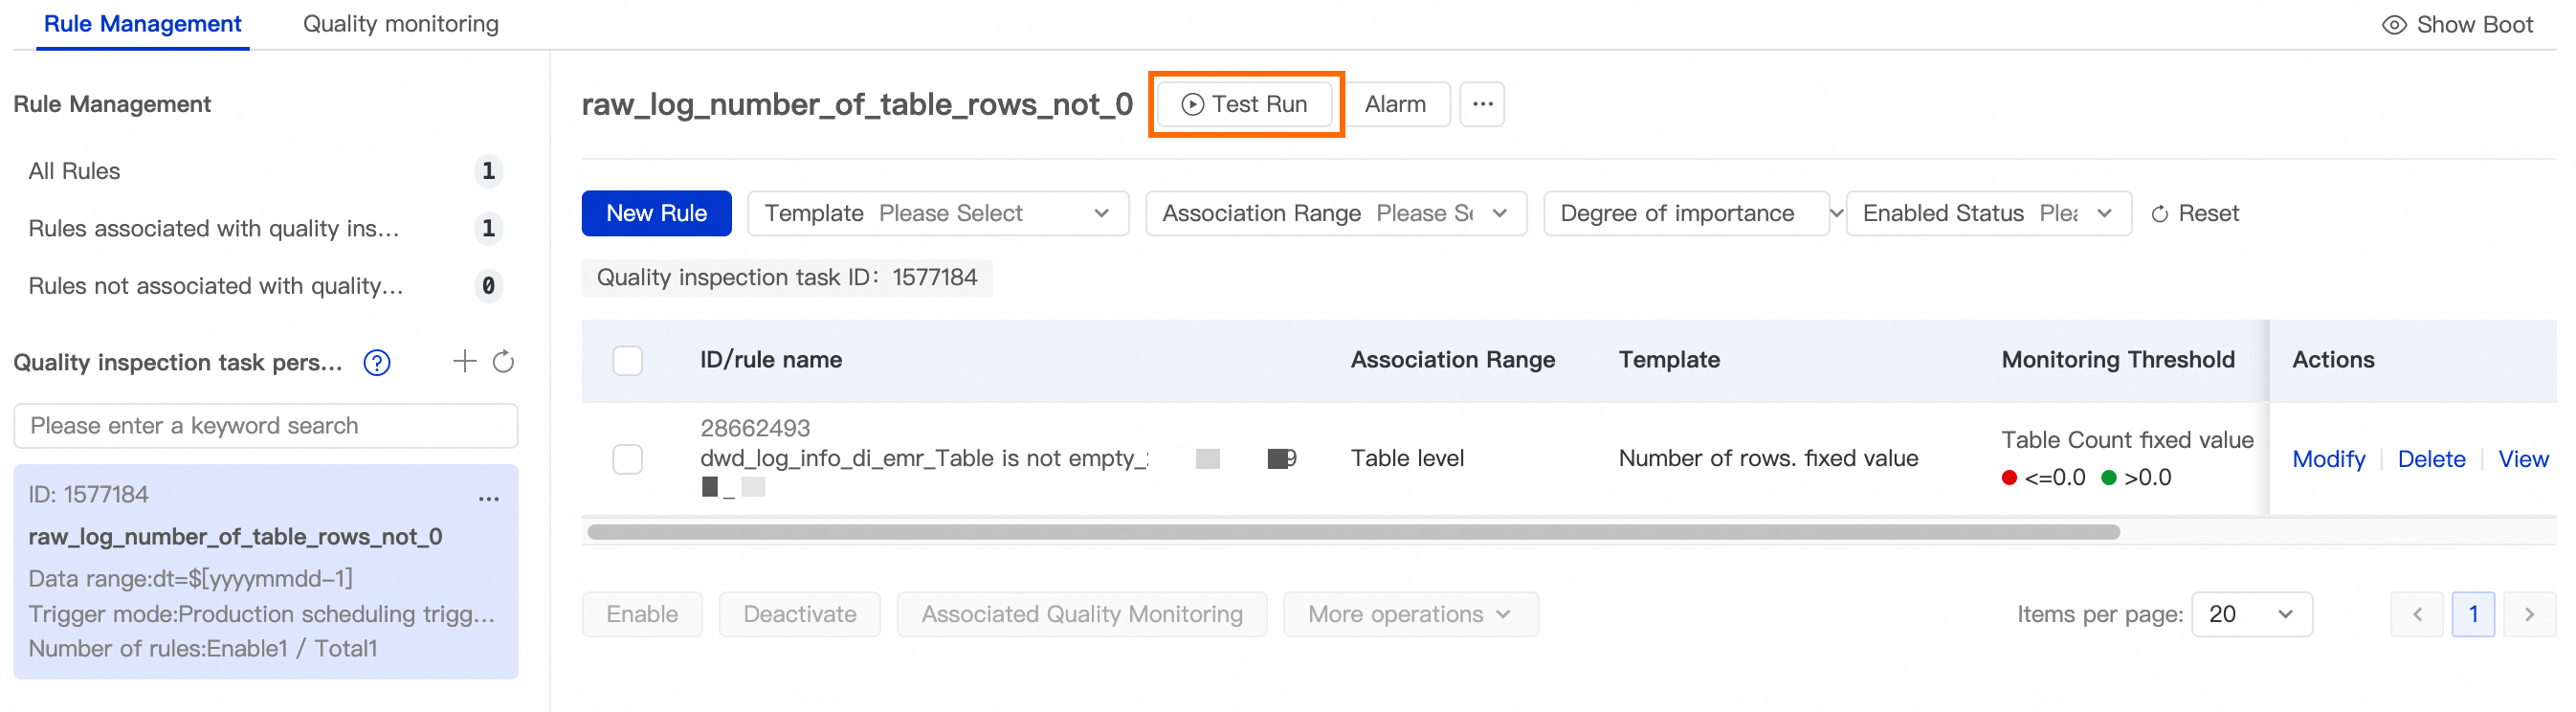
Click Test Run. The Test Run dialog box opens.
-
Set the Scheduling Time parameter and click Test Run.
-
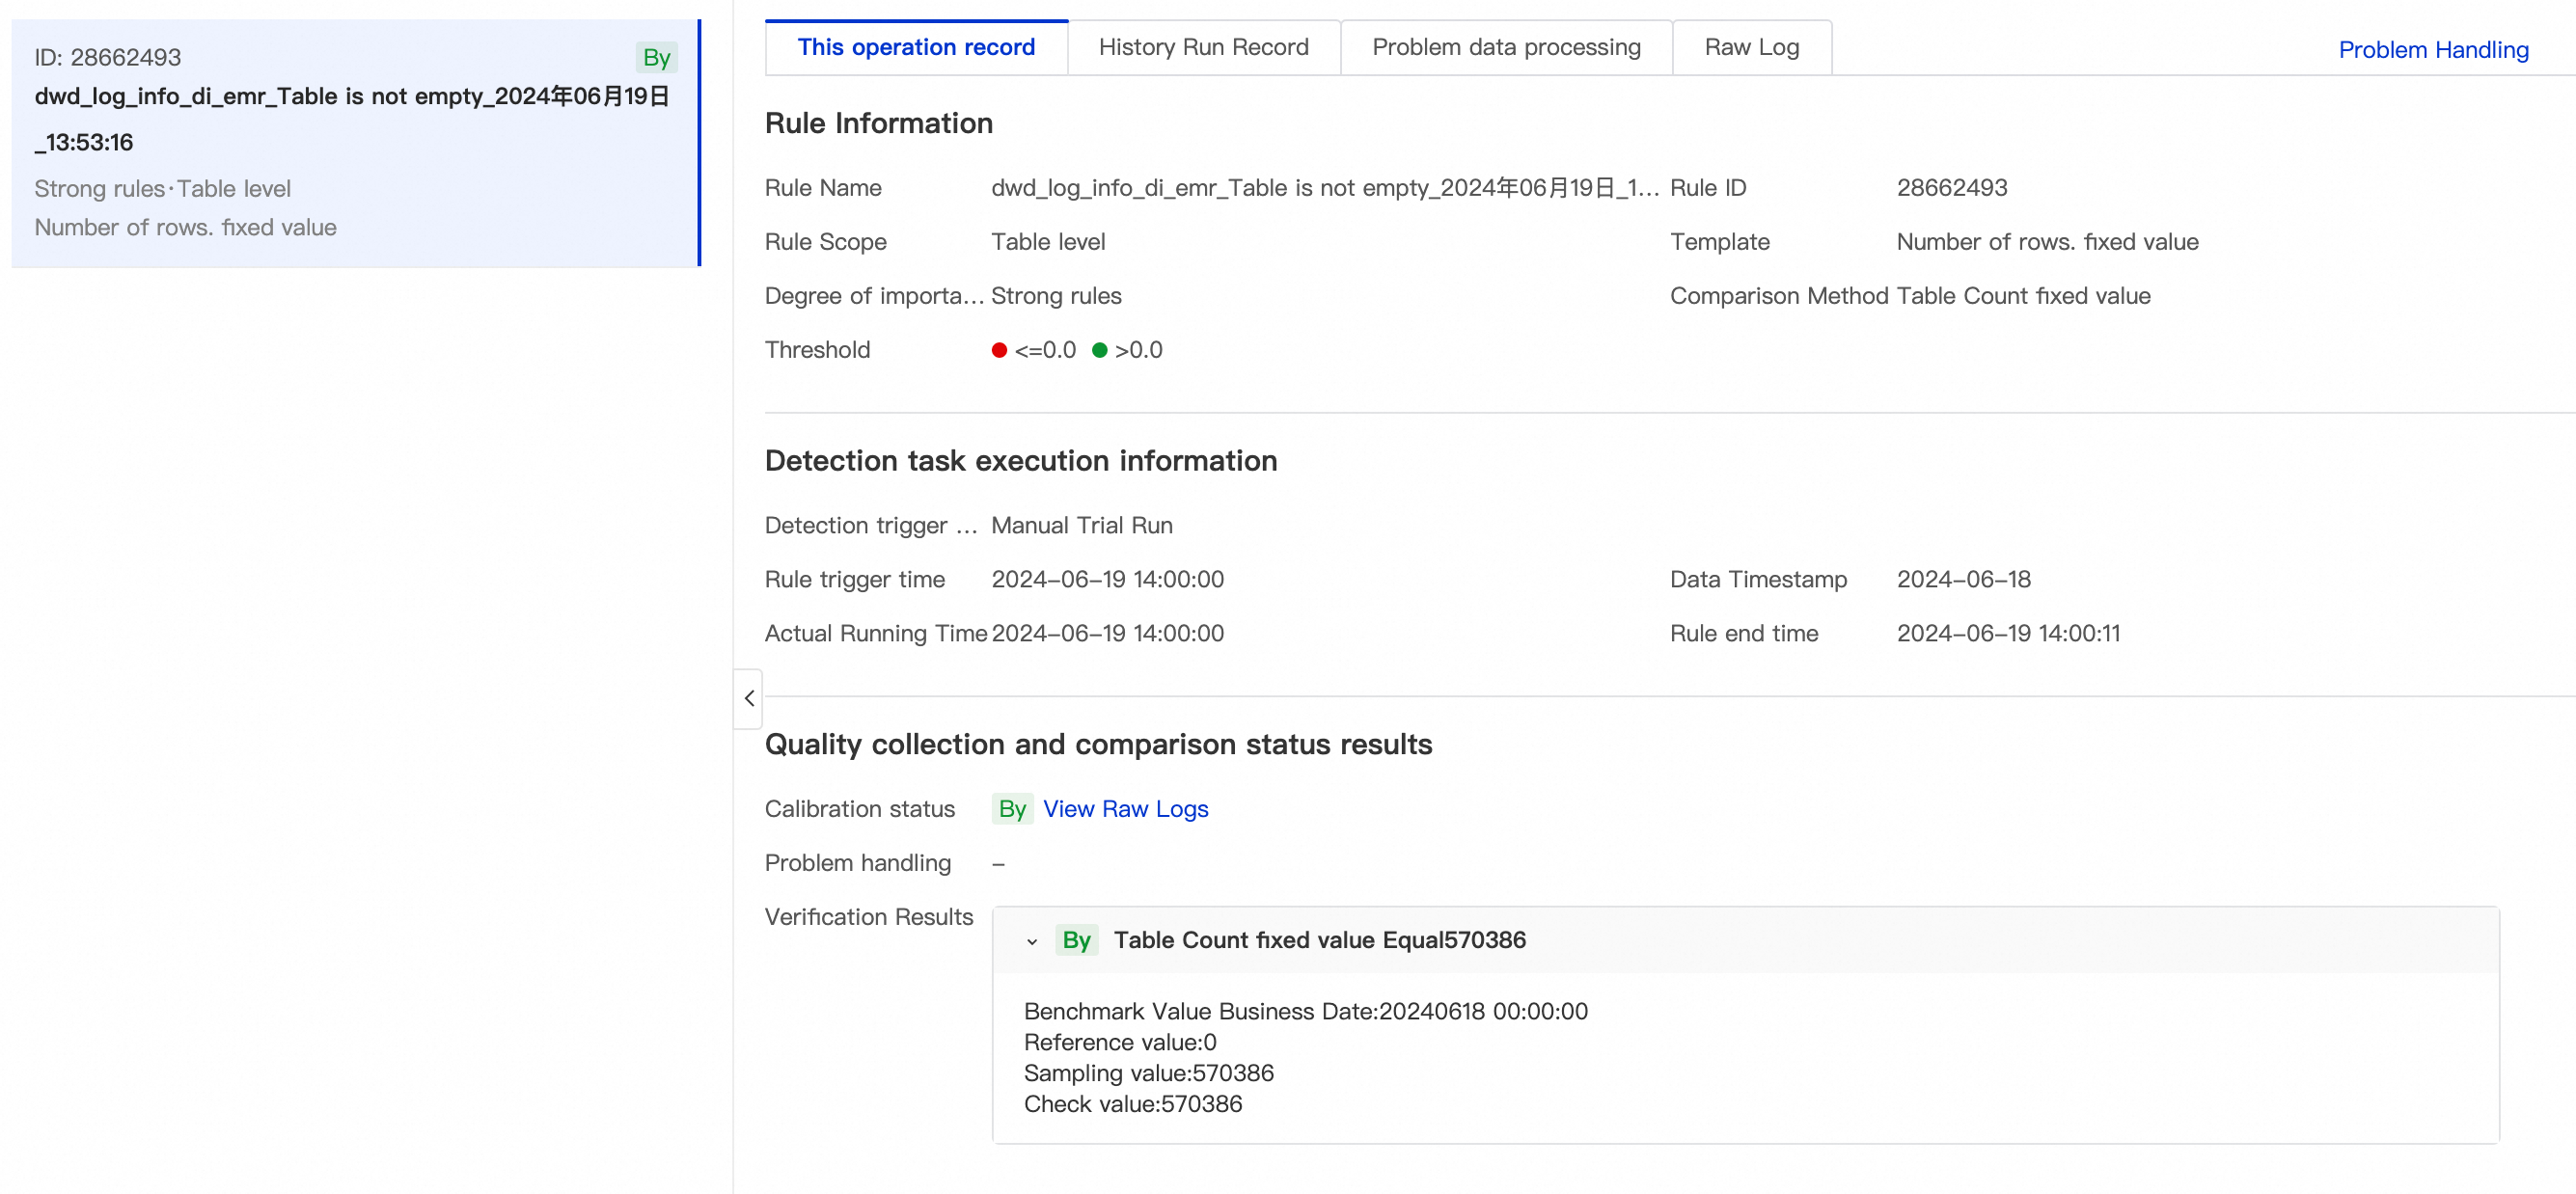
After the test completes, click View Details to review the result.
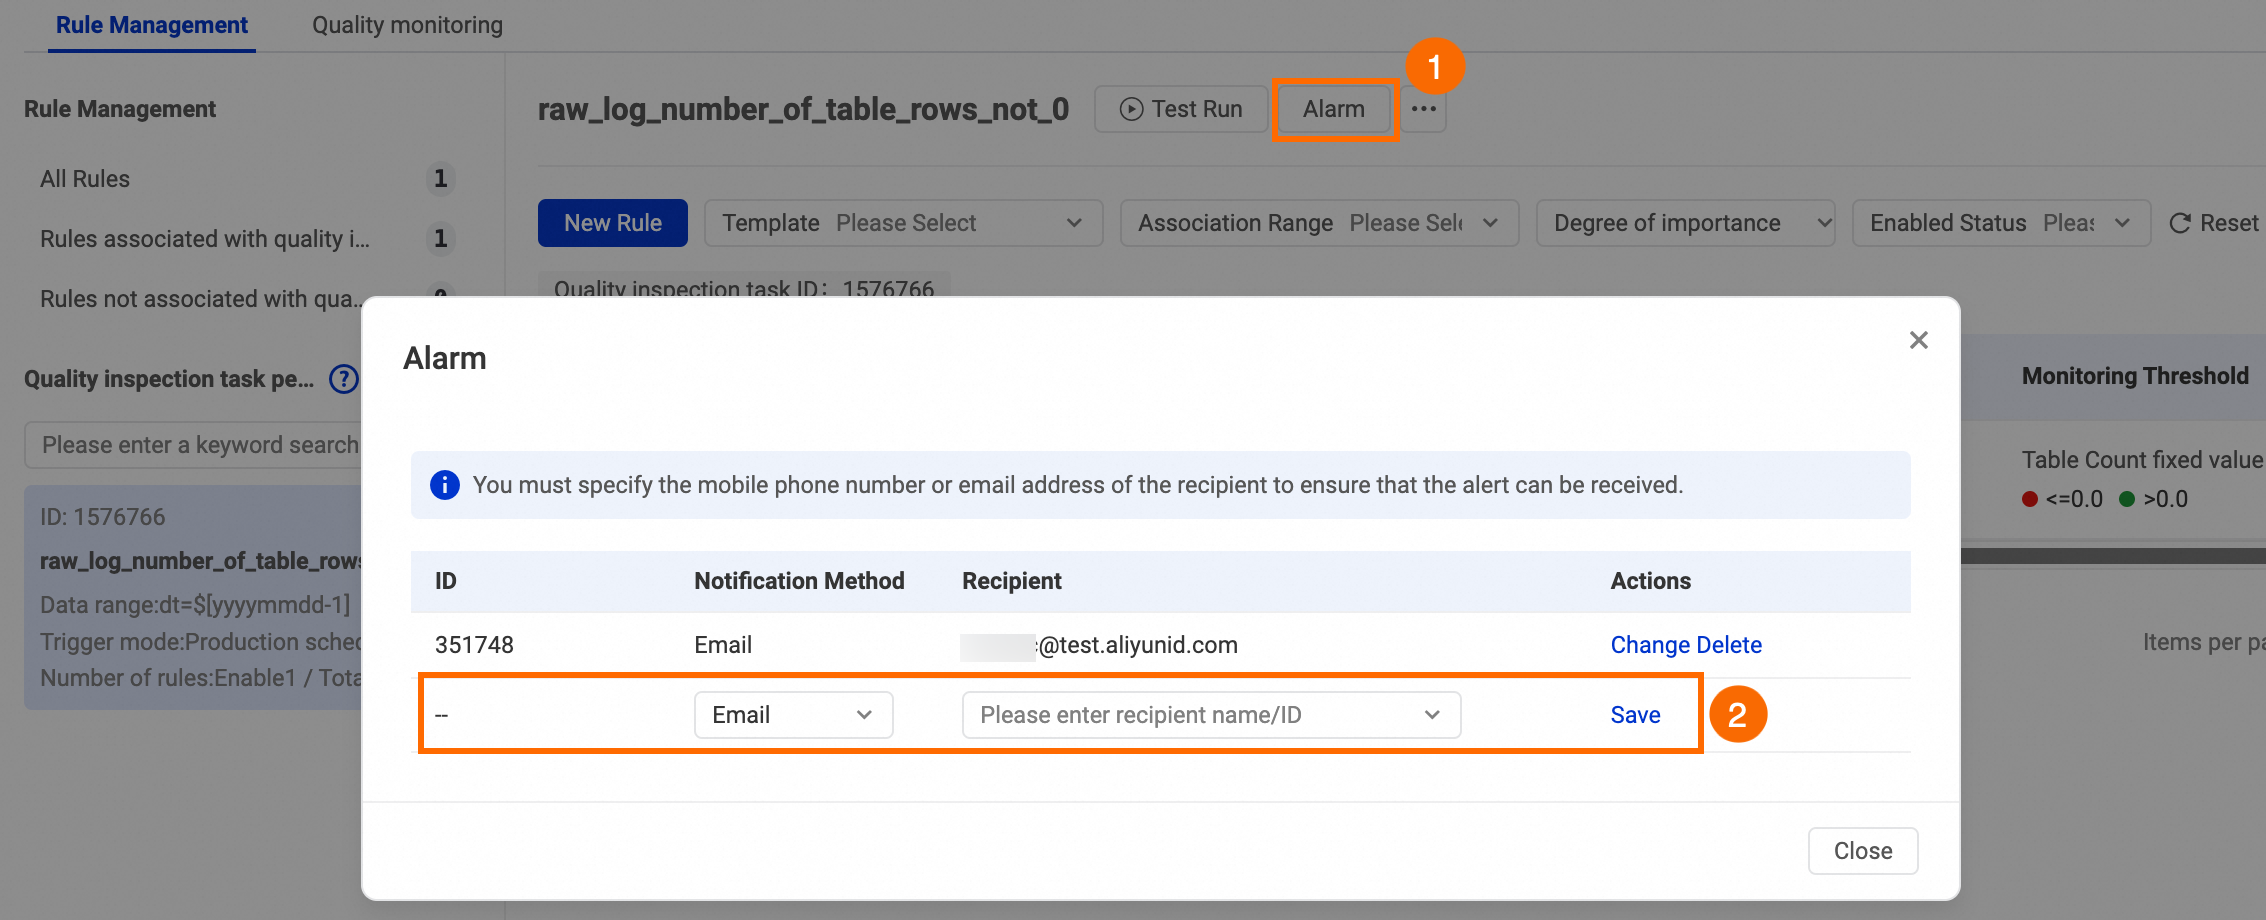
Step 5: Subscribe to alerts
Without a subscription, you will not receive notifications when the monitor detects a quality issue. Subscribe to get alerts delivered to you directly.
-
On the Rule Management tab, click Alert Subscription.
-
In the Alert Subscription dialog box, select a notification method and a recipient, then click Save in the Actions column.
-
To view or modify your subscriptions, go to Quality O&M > Monitor in the left-side navigation pane, then click My Subscriptions on the Monitor page.
What's next
With data quality monitoring in place, use DataAnalysis to visualize the processed data. See Visualize data on a dashboard.