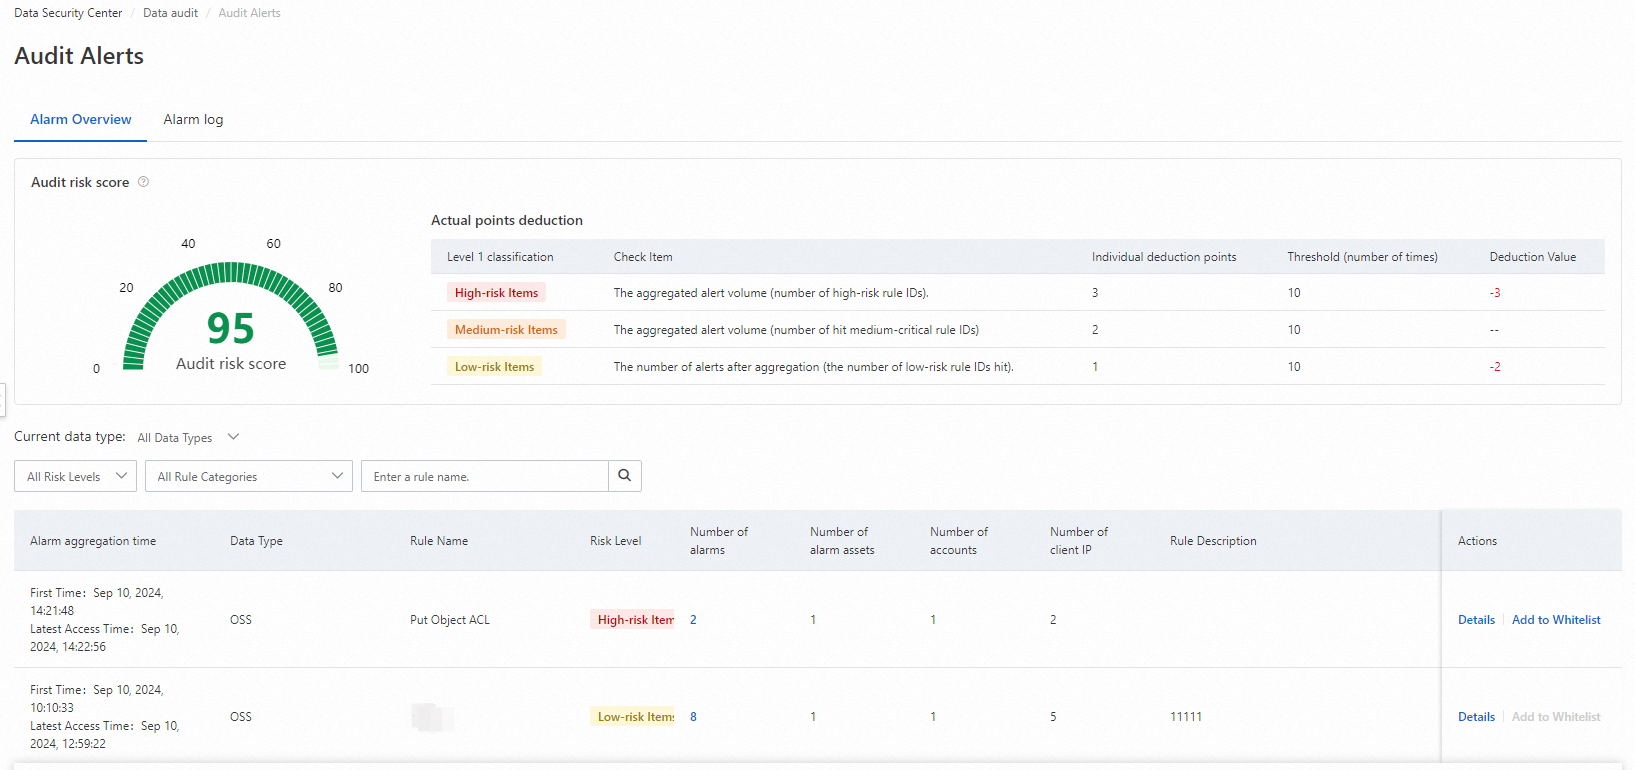
The Audit Alerts page displays audit alerts for data assets based on the configured audit modes and alert rules. You can use the alert details to identify and trace risks, such as abnormal database operations, vulnerability attacks, and data breaches. This topic describes how to view audit alerts for data assets. This helps you understand the risk status of your assets and handle the identified risks.
Prerequisites
The log audit feature is enabled for the data assets that you want to audit. For more information, see Configure and enable an audit mode.
If audit alert rules are not enabled or you need to add custom audit rules, you must configure and enable the audit alert rules. For more information, see Configure and enable an audit alert rule.
View audit alert information
Log on to the Data Security Center console.
In the navigation pane on the left, choose .
On the Risk Detection tab, view the statistics on the Alert Overview and Alert Logs subtabs.
Alert overview
This tab displays the Audit Risk Score, which is calculated based on the cumulative alert data from the last 24 hours. It also lists the deduction rules and actual deductions. If no new alerts are detected within 24 hours, your Audit Risk Score increases.

This tab displays real-time alert information for data assets. You can click Details in the Actions column to view suggested actions, a list of assets, and a list of access sources.

Alert logs
Above the alert list, select a data type, such as RDS, from the Current Data Type drop-down list. By default, the audit alert information for the selected asset type from the last day is displayed.

You can filter alerts by time range, instance name, risk level, operation type, rule classification, rule name, account, client IP address, and SQL command.

Click Details in the Actions column to view the alert time, client information, server information, behavior information, and execution result to identify the risk.
You can click One-Click screenshot to save a screenshot of the alert details to the default download path of your browser.

Handle audit alert events
If you confirm that an alert event poses a threat to data security, use the alert log to locate where the event occurred and manually handle the threat on the corresponding data asset.
If you confirm that an alert event is a normal operation and requires no action, you can add the event to the whitelist. Data Security Center (DSC) no longer generates alerts for this type of event on the data asset.
Add to the whitelist
Follow these steps to add an alert event to the whitelist. The accounts, IP addresses, and other information that you add to the whitelist are displayed in the system whitelist. During subsequent checks, if a database or OSS operation or event hits a whitelist rule, DSC no longer generates an alert. For more information, see Manage whitelists.
On the Alert Overview or Alert Logs tab, find the alert event that you want to whitelist and click Details in the Actions column.
On the alert event details page, in the Alert Assets or the client IP list under Source, find the asset or IP address that you want to add to the whitelist and click Add To Whitelist in the Actions column.

In the Add To Whitelist dialog box, the corresponding asset instance or IP address and its database account information are displayed. You can add more information to the whitelist rule, and then click OK.

References
You can view detailed audit logs for data assets on the Log Analysis page. For more information, see View audit logs.
You can configure alert notifications on the Alert Notification tab of the System Settings page in the Data Security Center console. This ensures that you receive audit alert notifications promptly. For more information, see Configure email, text message, and phone call alert notifications.