Audit logs record every database operation captured by Data Security Center (DSC) — who accessed what, when, and what they did. Use audit logs to investigate security events, detect unauthorized access or malicious activity, and meet compliance requirements.
Prerequisites
Before you begin, ensure that you have:
The log audit feature enabled for the data assets you want to audit. For setup instructions, see Configure and enable an audit mode
Log storage location
After you enable data audit mode, DSC stores logs in Simple Log Service (SLS) using the following structure:
Project:
sddp-${uid}-${regionId}, where${uid}is your Alibaba Cloud account ID and${regionId}is the region where the database is located.Logstore: determined by database type, as shown in the table below.
| Category | Database | Logstore |
|---|---|---|
| Relational database | RDS | rds_log |
| Relational database | PolarDB | dsc_polardb_log |
| Relational database | PolarDB-X | dsc_drds_log |
| Relational database | OceanBase | dsc_oceanbase_log |
| Non-relational database | Redis | dsc_redis_log |
| Non-relational database | MongoDB | dsc_mongodb_log |
| Unstructured database | OSS | dsc_oss_log |
| Big data | TableStore | dsc_ots_log |
| Big data | MaxCompute | dsc_odps_tunnel_log |
| Big data | AnalyticDB for MySQL | dsc_ads_log |
| Big data | AnalyticDB for PostgreSQL | dsc_gpdb_log |
| Self-managed database | MySQL, SQLServer, PostgreSQL, Oracle | dsc_self_built_db_log |
Log fields
Each audit log entry includes the following fields.
| Field | Description |
|---|---|
client_ip | IP address of the client that initiated the request. Use this field to trace the origin of suspicious access or verify that only expected hosts are connecting. |
clusterId | Cluster ID. |
collector_type | Log collection type. |
db | Database name. |
db_type | Database engine type. |
effect_row | Number of rows affected by the operation. Use this field to assess the impact of write operations such as INSERT, UPDATE, and DELETE. |
execute_time | The execution time. |
fail | Execution result: success or failure. |
hash | Hash value of the SQL statement. Use this field to group identical queries across different sessions. |
instance_id | Instance ID. |
latency | Execution duration, in microseconds. High values indicate slow queries that may need optimization. |
node_name | Node name. |
operate_type | Operation type, such as SELECT, INSERT, or DELETE. |
origin_time | Original execution time of the SQL statement at the source. |
region_id | Region ID. |
return_rows | Number of rows returned in the result set. Use this field alongside effect_row to understand the read vs. write impact of an operation. |
sql | Full SQL statement text. |
thread_id | Thread ID of the client connection. Use this field to trace all operations from a single client session. |
uid | User ID. |
update_rows | Number of rows updated by the operation. |
user | Logon username. |
View audit logs (new version)
Log on to the Data Security Center console.
In the left navigation pane, click Log Analysis.
In the upper-right corner of the Log Analysis page, click New Version. If Old Version is already displayed in the upper-right corner, skip this step.
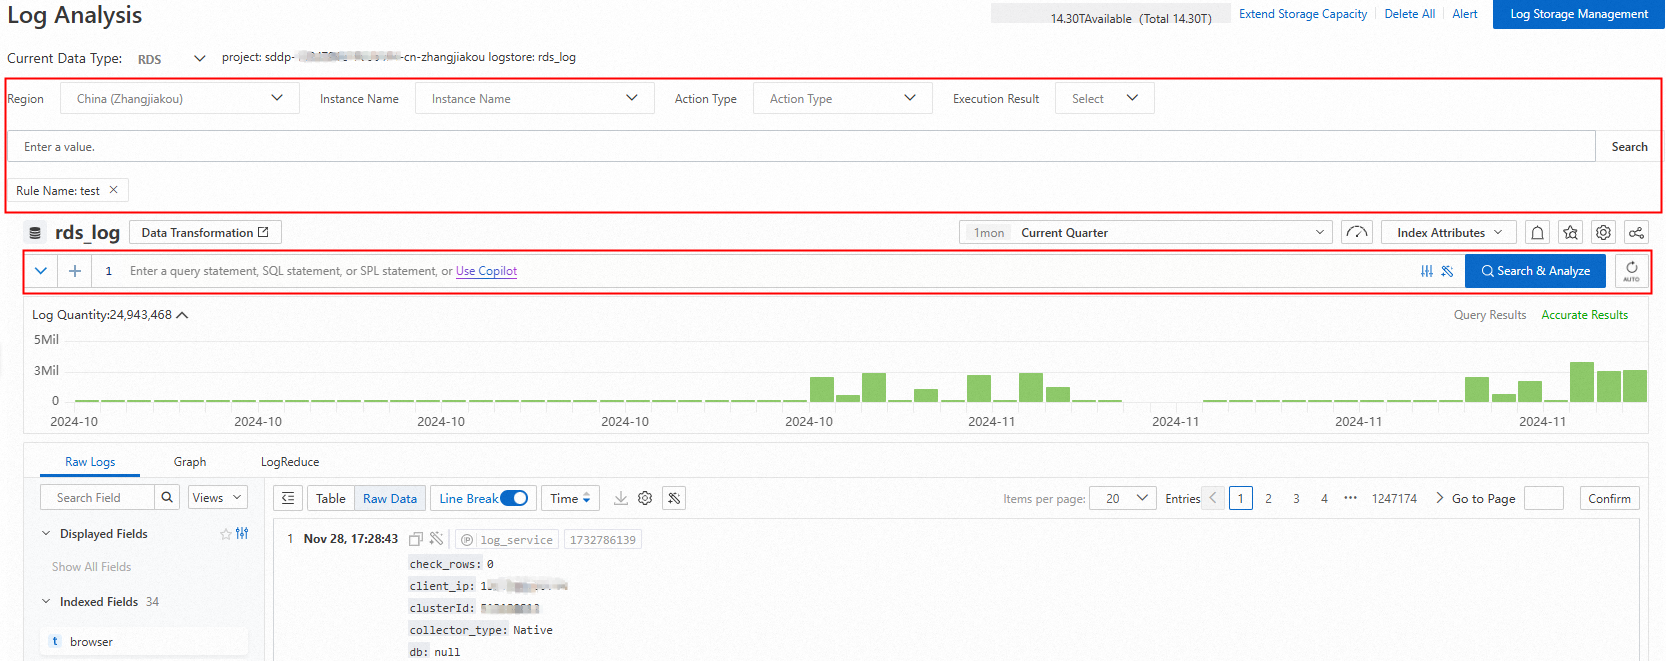
In the product type navigation bar on the left, click a product type to see its log storage location.
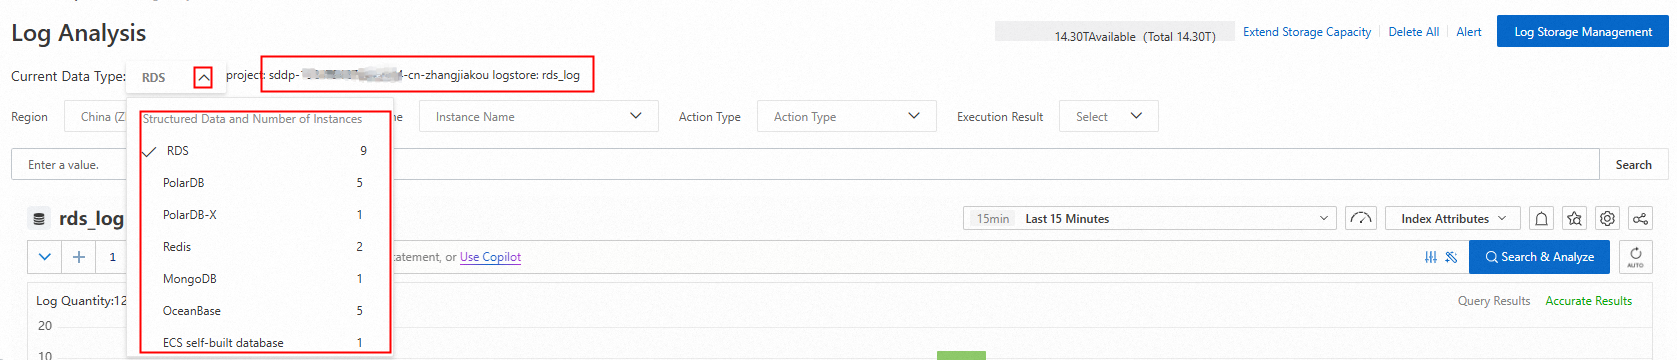
In the log area on the right, filter and view operation logs using the region, instance, account, and operation type parameters. For advanced analysis, enter a query statement using the SLS query syntax and analysis syntax. For an introduction, see Quick guide to query and analysis.
Query examples
The following examples show common audit analysis queries.
View access details for a specific table in an RDS instance
Retrieve who accessed the table, what operations they performed, and whether the operations succeeded.
* and instance_id: rm-bp1******5u5w and db: s****p and table_name : sys_d*****it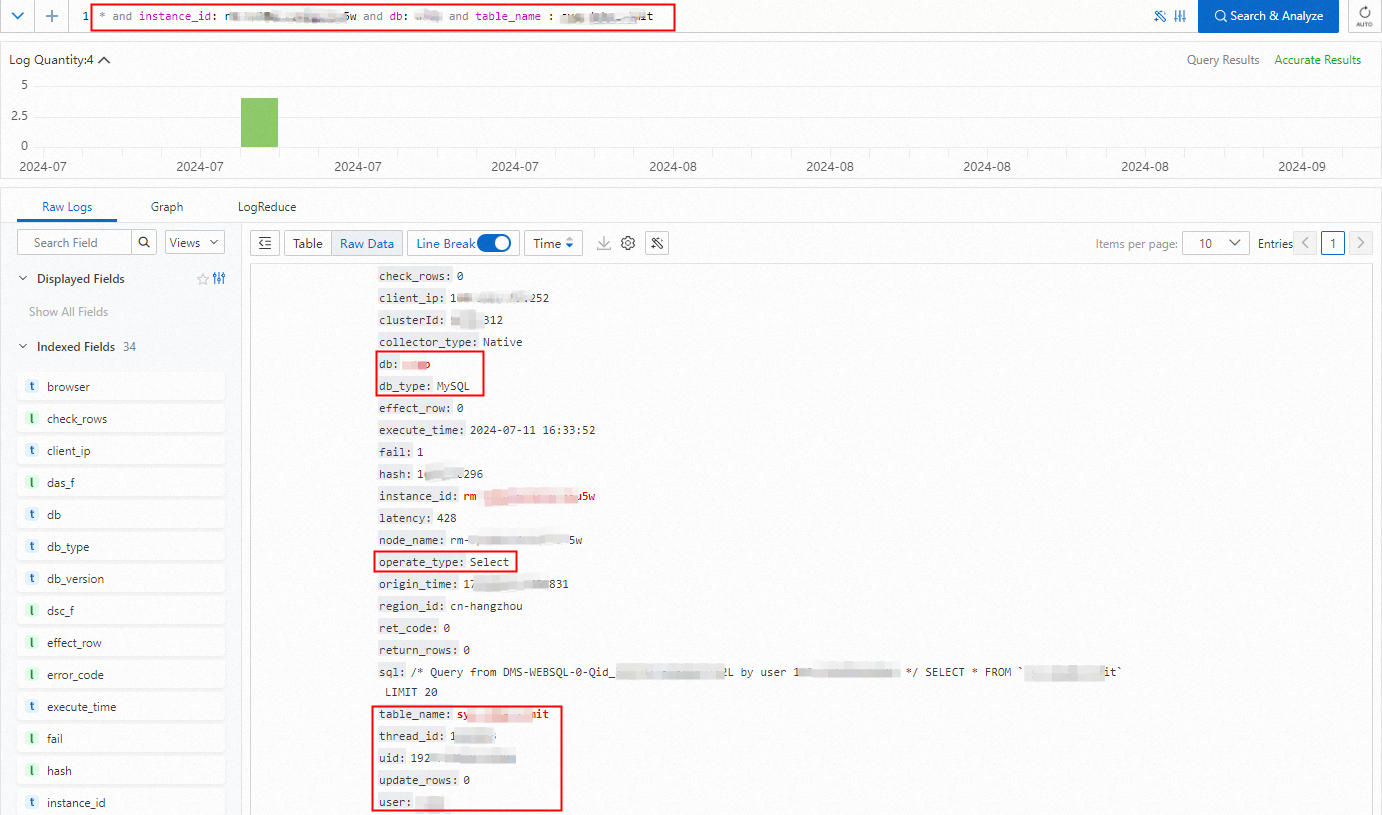
View the IP address distribution for a specific table in an RDS instance
Identify all users and client IP addresses that accessed a table, along with access counts.
* and instance_id: rm-bp1*****5u5w and db: s****p and table_name : sys_d*****it | select user,client_ip,count(*) group by user,client_ip
Calculate outbound internet traffic for an OSS directory
Sum the outbound traffic for all objects in a specific directory, excluding CDN requests.
* and __topic__ : oss_access_log and bucket: examplebucket and host : "examplebucket.oss-cn-hangzhou.aliyuncs.com" not sync_request : cdn | select
  SUM(content_length_out) AS total_traffic_out_byte
WHERE
  url_decode(object) LIKE 'exampledir/%'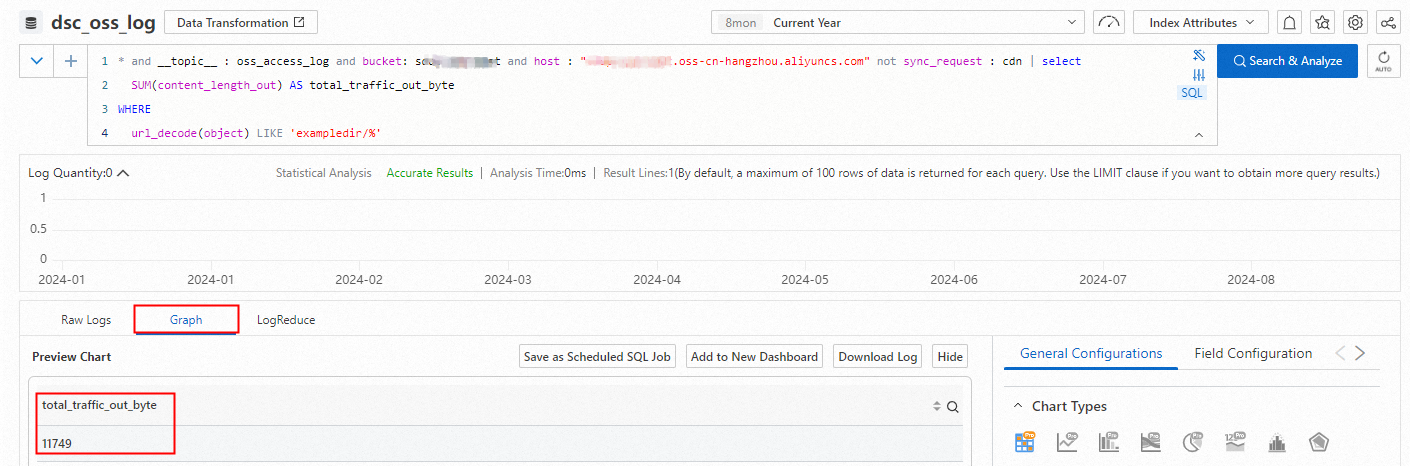
Download logs
DSC integrates the log download feature from the SLS console. Download logs or query and analysis results directly from the DSC console using the same procedure as in SLS. For details, see Download logs from the SLS console.
View audit logs (old version)
The old version offers two viewing modes:
Analysis mode: View logs on a time-based dimension. Shows behavior details including instance name, account, execution duration, and client IP address. Supported for RDS, PolarDB, PolarDB-X, MongoDB, OceanBase, self-managed databases, AnalyticDB for MySQL, and AnalyticDB for PostgreSQL.
List mode: View logs on an instance-based dimension. Shows instance name, database, account, client IP address, operation type, and number of rows affected.
For TableStore, MaxCompute, and Redis, only instance-based viewing is available — the Analysis mode and List mode tabs are not displayed, and the log list for each instance is shown by default. For OSS, only bucket-based viewing is available — the Analysis mode and List mode tabs are not displayed, and the log list for each bucket is shown by default.
View SQL operation statistics
Log on to the Data Security Center console.
In the left navigation pane, click Log Analysis.
In the upper-right corner of the Log Analysis page, click Old Version. If New Version is already displayed, skip this step.
On the Log Analysis page, view the trend charts showing the number of SQL statements (SELECT, INSERT, DELETE, UPDATE, and others) executed over the last 12 hours, 1 day, 7 days, or 30 days.

View logs by time
Log on to the Data Security Center console.
In the left navigation pane, click Log Analysis.
In the upper-right corner of the Log Analysis page, click Old Version. If New Version is displayed, skip this step.
In the left navigation bar, click a product type.
Click the Analysis mode tab. After selecting a time period, DSC displays database activities in reverse chronological order. Filter the results using the parameters available in the console.
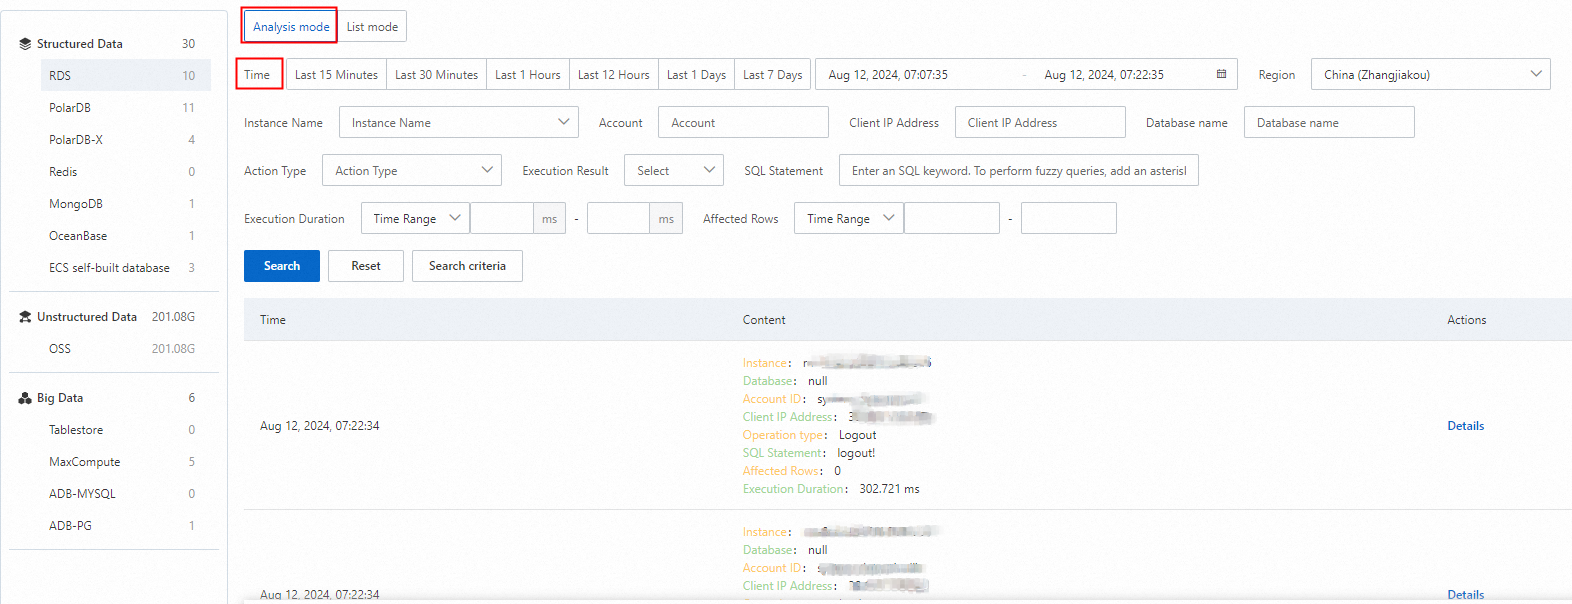
In the Actions column, click Details for any log record to view its client information, server information, and behavior details.
View logs by instance
Log on to the Data Security Center console.
In the left navigation pane, click Log Analysis.
In the upper-right corner of the Log Analysis page, click Old Version. If New Version is displayed, skip this step.
In the left navigation bar, click a product name.
Click the List mode tab above the log list.
For Redis, OSS, TableStore, and MaxCompute, the List mode button is not displayed. Logs for individual instances are shown by default.
Filter the results using the parameters available in the console.

In the Actions column, click Details for any log record to view its client, server, and behavior details.
Export logs
Log on to the Data Security Center console.
In the left navigation pane, click Log Analysis.
In the upper-right corner of the Log Analysis page, click Old Version. If New Version is displayed, skip this step.
In the left navigation bar, click a product name.
Select a time period, specify any additional filters, and click Search.
Click Export. All log records displayed on the current page are exported.
What's next
To manage how long audit logs are stored online and when they are archived, see Manage log storage.
To automatically detect risks such as abnormal operations, data leakage, vulnerabilities, and SQL injection attacks, see Configure and enable audit alert rules.
To review and handle audit alerts triggered by those rules, see View and handle audit alerts.