The data audit feature of Data Security Center (DSC) collects operation logs from your database assets and stores them as audit logs. Based on these logs and your configured alert rules, DSC detects threats such as data breaches, vulnerability attacks, and SQL injection, then surfaces alert information. Before DSC can collect logs, you must enable an audit mode for each data asset.
Prerequisites
Before you begin, ensure that you have:
Activated the Free Edition of DSC or purchased an Enterprise instance. See Free Edition of Data Security Center or Purchase DSC.
Authorized the data assets you want to audit. See Asset authorization.
(ApsaraDB for OceanBase only) Enabled SQL Audit for the target tenant of the OceanBase instance. See SQL Audit. After SQL Audit is enabled, all databases under tenants for which SQL Audit is enabled can use the data audit service.
How it works
Audit mode is disabled by default for all newly authorized assets. When you enable native log collection, DSC automatically establishes a data collection link with the corresponding cloud product and starts collecting logs that cover all Data Query Language (DQL), Data Manipulation Language (DML), and Data Definition Language (DDL) operations. These logs are generated by the database kernel and written to DSC storage — not to the database instance's own storage.
DSC applies the logs against built-in and custom audit policies to detect abnormal operations, data breaches, vulnerability attacks, and SQL injection. Detected events appear as audit alerts.
Limitations
Native log collection supports OSS and Alibaba Cloud native databases. It does not support the following asset types:
Self-managed databases
Redis
DSC supports the native log collection audit mode:
Supported data asset types: OSS and Alibaba Cloud native databases. This mode does not support self-managed databases or Redis.
How it works: DSC automatically establishes a data collection link with the corresponding product to collect logs. The logs record all Data Query Language (DQL), Data Manipulation Language (DML), and Data Definition Language (DDL) operations. This information is output by the database kernel and consumes very little CPU. For more information, see the FAQ section in this topic.
WarningIn this audit mode, the priority policy for cloud products is business first. This policy may cause a small number of logs to be lost when the business payload is high.
Billing: Additional collection fees apply. For more information about billing, see Additional fees for cloud products connected to DSC.
Enable native log collection
Step 1: Grant Simple Log Service permissions
Native log collection requires Simple Log Service (SLS) to access your cloud resources. Grant SLS permissions before enabling any audit mode.
Log on to the Data Security Center console.
In the left navigation pane, choose Data Auditing > Native Data Auditing.
On the Asset Management > Asset Configurations tab, click Authorize Now.
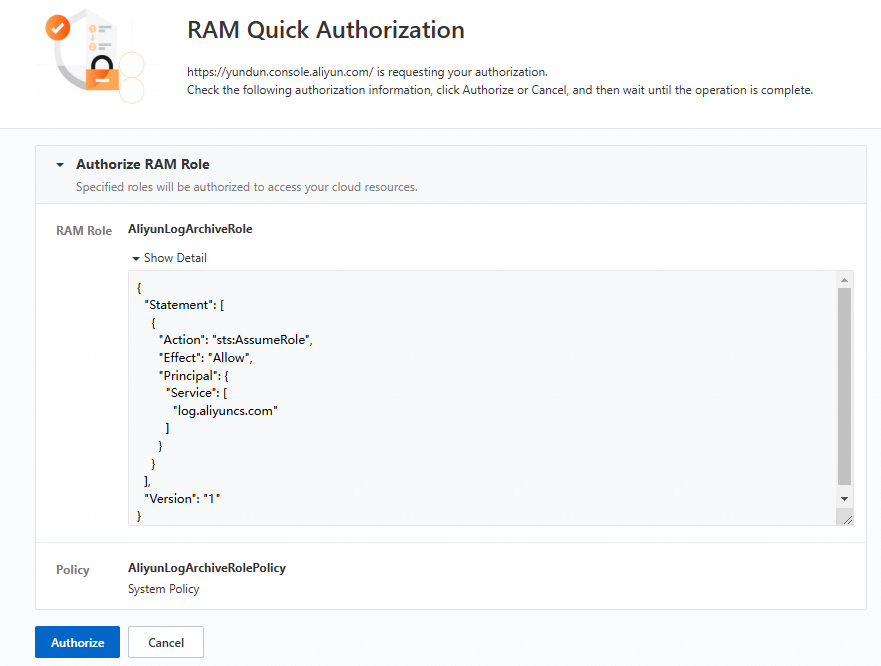
On the RAM Quick Authorization page, click Authorize.
Step 2: Enable audit mode for an asset
On the Asset Configurations tab, select a cloud product type — for example, RDS.
In the asset list, find the target asset. In the Audit Mode column, select Cloud-native Audit Log Collection.
Configure audit alerts
DSC provides built-in audit policies for database assets, OSS, and MaxCompute out of the box, and also supports custom audit policies. To start receiving alerts based on audit logs, enable audit alert rules. See Configure and enable audit alert rules.
After alert rules are active, DSC reports behaviors that match rule conditions to the audit alerts dashboard. See View and handle audit alerts for how to analyze and act on those alerts.
FAQ
What's next
View audit logs: After audit mode is enabled, view the collected logs on the Log Analysis page. See View audit logs.
Manage log storage: Audit logs are stored in DSC storage. View usage and configure retention rules for online and archived logs. See Manage log storage.