If a message consumption exception occurs, you can log on to the ApsaraMQ for RocketMQ console to view the details of consumers in the group to identify the possible cause of the exception. The consumer details that you can view include the connection status, subscription consistency, message consumption-related metrics, and client information.
Common scenarios
The details of consumers in a group include the connection status, subscriptions, message receiving transactions per second (TPS), number of accumulated messages, and JStack information. In most cases, the details are used to troubleshoot exceptions in scenarios that are described in the following table.
Scenario | Problem description | Suggestion |
Inconsistent subscriptions | In the Subscriptions section of the Group Details page of the corresponding group, the following message is displayed: Subscriptions are inconsistent. Fix the issue promptly. | For more information, see Inconsistent subscriptions. |
Message accumulation | On the Group Details page of the corresponding group, the values of the Inflight Messages, Ready Messages, and Queuing Time parameters are higher than expected. | For more information, see How can I handle accumulated messages? |
View the basic information about a group
Procedure
Log on to the ApsaraMQ for RocketMQ console. In the left-side navigation pane, click Instances.
In the top navigation bar, select a region, such as China (Hangzhou). On the Instances page, click the name of the instance that you want to manage.
In the left-side navigation pane, click Groups. On the page that appears, click the name of the group that you want to manage.
Query results
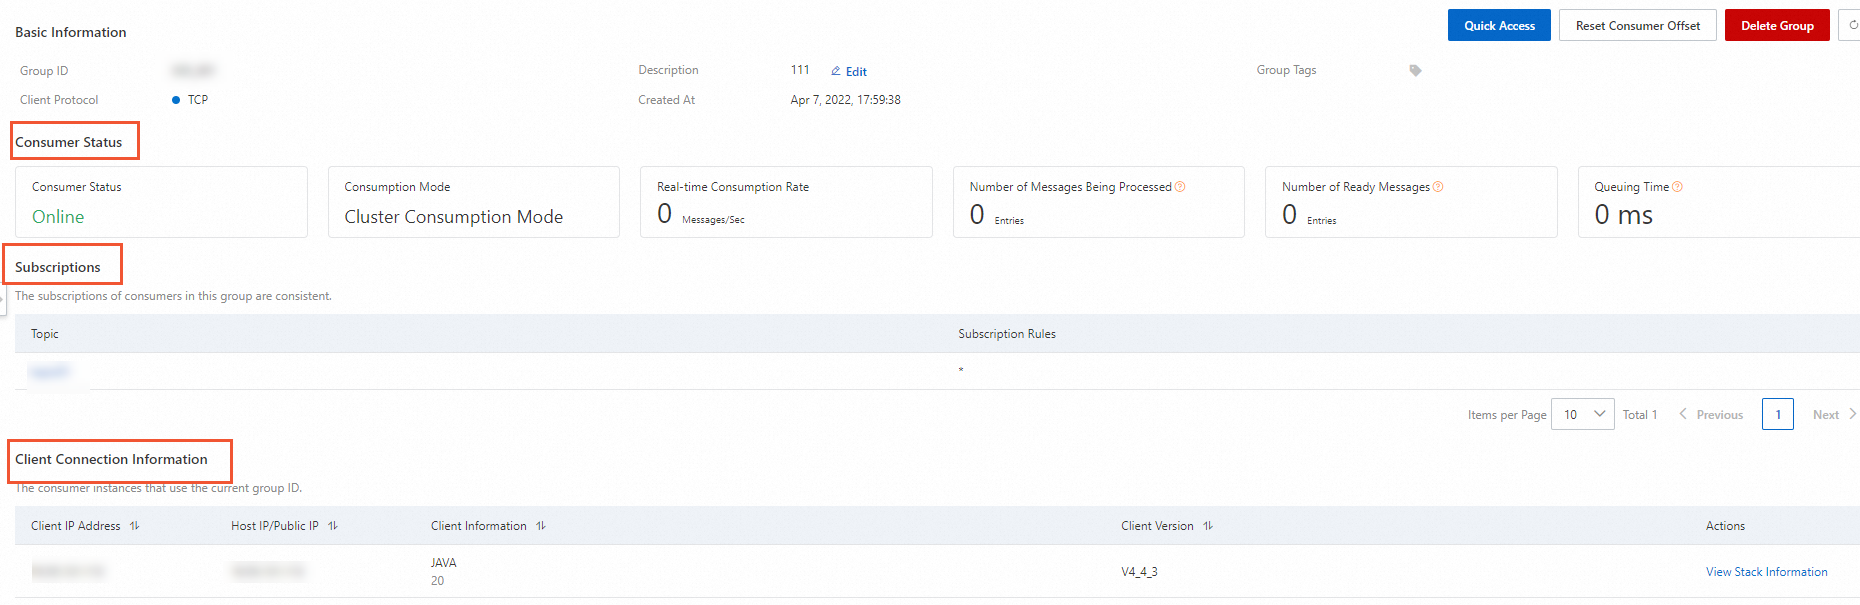
The following figure shows a sample query result.
Field | Description |
Consumer Status |
|
Consumption Mode | The consumption mode that is used by consumers to subscribe to messages. ApsaraMQ for RocketMQ supports the clustering consumption mode and the broadcasting consumption mode. By default, the clustering consumption mode is used. You can modify the consumption mode on the client. For more information, see Clustering consumption and broadcasting consumption. |
Real-time Consumption Rate | The total number of TPS that are used by all consumers in the group to receive messages. |
Inflight Messages | The number of messages that the client is processing and for which the client has not returned consumption results. |
Ready Messages | The number of messages that are visible to consumers and are ready for consumption on the ApsaraMQ for RocketMQ broker. |
Queuing Time | The interval between the current point in time and the ready time of the earliest ready message. This metric indicates how soon a consumer pulls messages. |
Subscriptions | Displays whether the subscriptions of all consumers in the group are consistent and the tags to which each consumer subscribes. For information about subscription consistency, see Subscription consistency. ApsaraMQ for RocketMQ allows you to view only the subscriptions of connected clients. |
Client Connection Information | Displays information about connected clients, including the IP address, version, and stack details of each client. |
View the information about message accumulation in a group
Procedure
On the Groups page, click Dashboard.
You can also use the dashboard feature to view all metrics of an instance. For more information, see Dashboard.
Query results
The dashboard of a group displays metrics that are related to the current consumption scenario, including the message accumulation volume, message consumption rate, and charts that indicate changes in the message accumulation volume and message production and consumption rates in a topic.
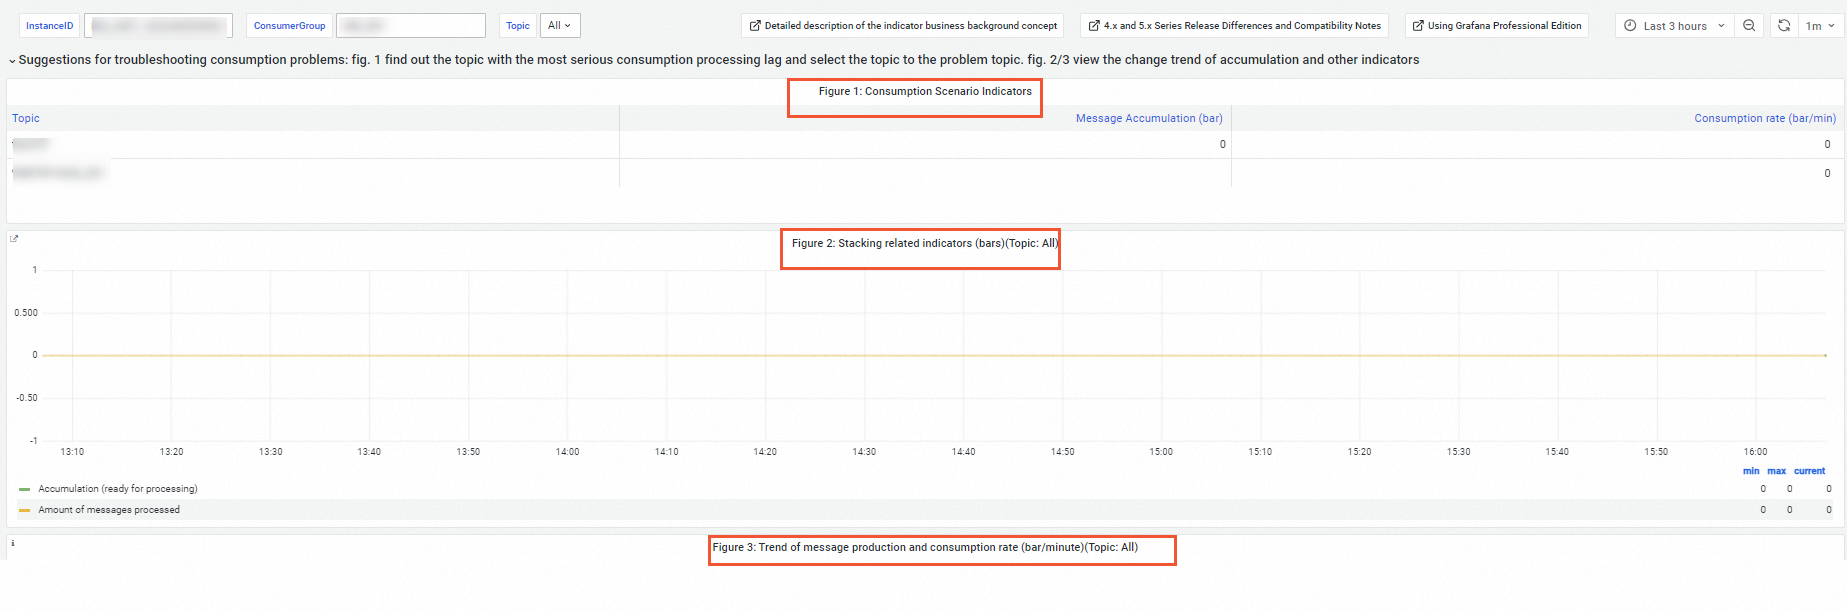
If a consumption exception occurs, you can troubleshoot the exception based on the following procedure:
In Figure 1: Consumption Scenario Indicators, find the topic that has the largest number of accumulated messages.
In the upper part of the page, select the topic that you found in Figure 1 from the Topic drop-down list.
View the change trends of message accumulation volume and message production and consumption rates in Figure 2 and Figure 3 to narrow down the time range in which the exception occurs.
Determine whether backend operations are performed or network exceptions occur during the time range.
References
ApsaraMQ for RocketMQ also allows you to query consumer details and message accumulation of a group by calling the following API operations: