Distributed messaging systems generate metrics across producers, consumers, and broker instances that are difficult to correlate manually. ApsaraMQ for RocketMQ provides a built-in dashboard, powered by Alibaba Cloud Managed Service for Prometheus and Grafana, that aggregates these metrics in a single view. Use it to detect consumption delays, track message accumulation trends, verify message delivery, and estimate billing -- without switching between tools.
Use cases
Consumption anomaly detection: Get alerts when consumers fall behind or fail, and identify the affected groups and topics.
Message delivery verification: Confirm messages are being sent as expected when the status of specific online orders is abnormal.
Traffic trend analysis: Track production and consumption rates over time to forecast capacity and plan for traffic peaks.
Dependency topology review: Map upstream and downstream application dependencies to guide architecture upgrades.
Prerequisites
Before you begin, make sure that you have:
The AliyunServiceRoleForOns service-linked role created (policy name: AliyunServiceRolePolicyForOns), which grants ApsaraMQ for RocketMQ access to Cloud Monitor and Application Real-Time Monitoring Service (ARMS) for monitoring, alerting, and dashboard features. For details, see Service-linked roles
Billing
Dashboard metrics are basic metrics in ARMS Managed Service for Prometheus. Basic metrics are free, so the dashboard incurs no additional cost.
For more information, see Metrics and Pay-as-you-go.
How message accumulation works
Understanding how ApsaraMQ for RocketMQ tracks message processing state is essential for interpreting dashboard metrics -- particularly consumer lag, which is the primary indicator of consumption health.
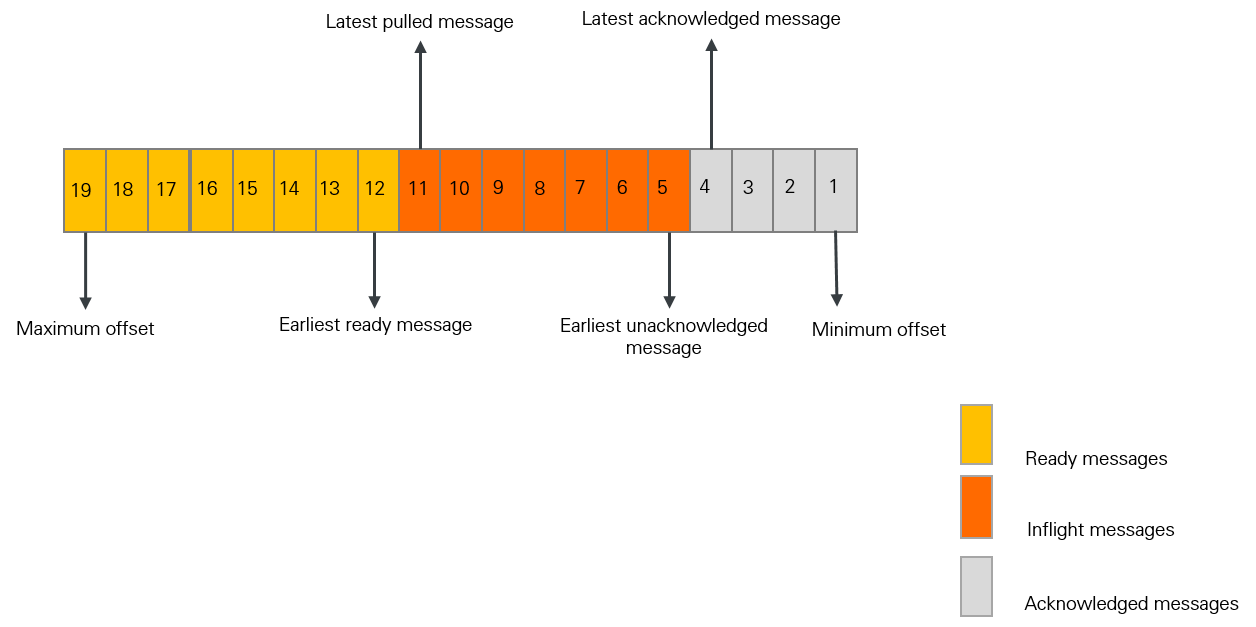
The following diagram shows each message's state in a queue. The broker calculates message counts and processing durations at each stage. These metrics show how quickly consumers pull and acknowledge messages, and whether accumulation is building up.
Message count metrics
| Metric | Description | Formula |
|---|---|---|
| Inflight messages | Messages that a consumer has pulled but not yet acknowledged. | Latest pulled offset - Latest acknowledged offset |
| Ready messages | Messages stored on the broker that are visible to consumers and available for consumption. | Maximum offset - Latest pulled offset |
| Consumer lag | Total unprocessed messages, including both inflight and ready messages. A rising consumer lag indicates consumers are falling behind producers. | Inflight messages + Ready messages |
Timing metrics
| Metric | Description | Formula |
|---|---|---|
| Ready time | When a message becomes available for consumption. Varies by message type (see below). | N/A |
| Ready message queue time | How long the earliest ready message has been waiting. Indicates how quickly consumers pull messages. | Current time - Ready time of the earliest ready message |
| Consumer lag time | How long the earliest unacknowledged message has been waiting. Indicates overall processing speed. | Current time - Ready time of the earliest unacknowledged message |
Ready time by message type:
Normal or ordered message: The time the broker stores the message.
Scheduled message: The scheduled delivery time. For a delayed message, the time the delay period elapses.
Transactional message: The time the transaction is committed.
View the dashboard
Log on to the ApsaraMQ for RocketMQ console. In the left-side navigation pane, click Instances.
In the top navigation bar, select a region, such as China (Hangzhou). On the Instances page, click the name of the instance that you want to manage.
Open the dashboard using any of the following methods:
On the Instance Details page, click the Dashboard tab.
In the left-side navigation pane, click Dashboard.
In the left-side navigation pane, click Topics. Click a topic name to open the Topic Details page, then click the Dashboard tab.
In the left-side navigation pane, click Groups. Click a group name to open the Group Details page, then click the Dashboard tab.
Dashboard metrics
Metrics are organized into four categories: producer, consumer, instance top 20, and billing.
All metrics are collected at 1-minute intervals. Data is available for the last 15 days, with a maximum query range of 24 hours.
Producer metrics
| Metric | Description | Unit |
|---|---|---|
| Message production rate | Production rate and API call rate for a topic. | messages/s, calls/s |
| Peak message production rate | Maximum production rate. | messages/s |
| Total messages produced | Total messages produced in the instance. | messages |
| Message production call success rate | Percentage of successful send calls for a topic. | % |
| Message production call latency | Send latency for a topic. | ms |
Consumer metrics
| Metric | Description | Unit |
|---|---|---|
| Average consumption success rate | Consumption success rate across all messages in the instance. | % |
| Accumulated messages (Ready + Inflight) | Total accumulated messages in the instance, combining ready and inflight messages. | messages |
| Inflight messages | Messages being processed by a consumer that have not been acknowledged. | messages |
| Ready messages | Messages available on the broker for consumption. Reflects the scale of unprocessed messages. | messages |
| Ready message queue time | Time since the earliest ready message became available. The overview shows the instance average; specific charts show per-group-topic values. Monitor closely for latency-sensitive workloads. | ms |
| Message consumption rate | Rate at which a group consumes messages. | messages/s |
| Peak message consumption rate | Maximum consumption rate. | messages/s |
| Total messages consumed | Total consumed messages in the instance. | messages |
| Consumption accumulation | Accumulated messages for a group, including ready and inflight messages. | messages |
| Message processing latency | Time from when a group starts consuming a message to completion. | ms |
| Consumer local wait time | Time a message waits on the consumer client before processing begins. | ms |
| Consumption success rate | Success rate of message consumption. | % |
| Consumer client access protocol ratio | Distribution of consumed messages by protocol type (TCP vs. HTTP). | -- |
Instance top 20 overview
| Metric | Unit |
|---|---|
| Top 20 topics by message production rate | messages/s |
| Top 20 groups by message consumption rate | messages/s |
| Top 20 groups by ready messages | messages |
| Top 20 groups by ready message queue time | ms |
| Top 20 groups by accumulated messages (Ready + Inflight) | messages |
| Top 20 groups by inflight messages | messages |
| Top 20 groups by consumption processing latency | ms |
| Top 20 groups by consumer local wait time | ms |
| Top 20 topics by message production call failure rate | % |
| Top 20 groups by message consumption failure rate | % |
Billing metrics
Use billing metrics to estimate cost-related items for your instance, such as peak TPS and API call volume.
Billing metric values include multipliers for large messages and advanced features:
Large message multiplier: The billing unit is 4 KB. A 16 KB message counts as 16 / 4 = 4 API calls.
Advanced feature multiplier: Ordered, scheduled, delayed, and transactional messages count as 5x the API calls of normal messages.
| Metric | Description | Unit |
|---|---|---|
| Peak production TPS | Maximum production TPS. Use to estimate the peak TPS specification for billing. | calls/s |
| Peak consumption TPS | Maximum consumption TPS. Use to estimate the peak TPS specification for billing. | calls/s |
| Peak TPS | Maximum combined production and consumption TPS. Use to estimate the peak TPS specification for billing. | calls/s |
| Total API calls | Total API calls. Use to estimate API call volume for billing. | calls |
| Average message size | Average size of all produced messages. | bytes |
| Production and consumption TPS | Combined production and consumption TPS. | calls/s |
| Daily API calls | Daily total of production and consumption API calls. | calls |
Prometheus metric reference
TPS, message count, and total message calculations use a 4 KB normal message as the base unit. Size and advanced-feature multipliers apply on top of this base.
All metrics use the Gauge type -- an instantaneous measurement that can increase or decrease.
Common labels
| Label | Description |
|---|---|
instance_id | ApsaraMQ for RocketMQ instance ID |
topic | Topic name |
message_type | Message type: normal, fifo, transaction, or delay |
uid | Alibaba Cloud account ID |
protocol_type | Protocol: tcp or http |
client_group / group_id | Consumer group identifier |
Server-side metrics
| Metric name | Unit | Description | Labels |
|---|---|---|---|
rocketmq_instance_requests_threshold | count/s | Instance throttling threshold. | uid, instance_id |
rocketmq_instance_requests_max | count/s | Maximum TPS per minute, excluding throttled requests. Calculated as the highest of 60 per-second samples within one minute. | uid, instance_id |
Producer metrics
| Metric name | Unit | Description | Labels |
|---|---|---|---|
rocketmq_producer_requests | count | Billable API calls for sending messages. | uid, instance_id, topic, message_type |
rocketmq_producer_messages | messages | Number of sent messages. | uid, instance_id, topic, message_type |
rocketmq_producer_message_size_bytes | bytes | Total size of sent messages. | uid, instance_id, topic, message_type |
rocketmq_producer_send_success_rate | % | Send success rate. | uid, instance_id, topic |
rocketmq_producer_failure_api_calls | count | Failed send API calls. | uid, instance_id, topic |
rocketmq_producer_send_rt_milliseconds_avg | ms | Average send latency. | uid, instance_id, topic |
rocketmq_producer_send_rt_milliseconds_min | ms | Minimum send latency. | uid, instance_id, topic |
rocketmq_producer_send_rt_milliseconds_max | ms | Maximum send latency. | uid, instance_id, topic |
rocketmq_producer_send_rt_milliseconds_p95 | ms | P95 send latency. | uid, instance_id, topic |
rocketmq_producer_send_rt_milliseconds_p99 | ms | P99 send latency. | uid, instance_id, topic |
Consumer metrics
| Metric name | Unit | Description | Labels |
|---|---|---|---|
rocketmq_consumer_requests | count | API calls for consuming messages. | uid, instance_id, topic, client_group, protocol_type |
rocketmq_consumer_send_back_requests | count | API calls to return messages that failed consumption. | uid, instance_id, topic, group_id |
rocketmq_consumer_send_back_messages | messages | Messages returned by consumers after failed consumption. | uid, instance_id, topic, group_id |
rocketmq_consumer_messages | messages | Number of consumed messages. | uid, instance_id, topic, client_group, protocol_type |
rocketmq_consumer_message_size_bytes | bytes | Size of consumed messages, accumulated over one minute. | uid, instance_id, topic, client_group, protocol_type |
rocketmq_consumer_ready_and_inflight_messages | messages | Consumer lag: ready messages plus inflight messages. | uid, instance_id, topic, group_id |
rocketmq_consumer_ready_messages | messages | Ready messages. Calculated as maxOffset - lastPullOffset. | uid, instance_id, topic, group_id |
rocketmq_consumer_inflight_messages | messages | Inflight messages. Calculated as lastPullOffset - committedOffset. | uid, instance_id, topic, group_id |
rocketmq_consumer_queue_time_milliseconds | ms | Message queue time. | uid, instance_id, topic, group_id |
rocketmq_consumer_message_await_time_milliseconds_avg | ms | Average consumer local wait time. | uid, instance_id, topic, group_id |
rocketmq_consumer_message_await_time_milliseconds_min | ms | Minimum consumer local wait time. | uid, instance_id, topic, group_id |
rocketmq_consumer_message_await_time_milliseconds_max | ms | Maximum consumer local wait time. | uid, instance_id, topic, group_id |
rocketmq_consumer_message_await_time_milliseconds_p95 | ms | P95 consumer local wait time. | uid, instance_id, topic, group_id |
rocketmq_consumer_message_await_time_milliseconds_p99 | ms | P99 consumer local wait time. | uid, instance_id, topic, group_id |
rocketmq_consumer_message_process_time_milliseconds_avg | ms | Average message processing latency. | uid, instance_id, topic, group_id |
rocketmq_consumer_message_process_time_milliseconds_min | ms | Minimum message processing latency. | uid, instance_id, topic, group_id |
rocketmq_consumer_message_process_time_milliseconds_max | ms | Maximum message processing latency. | uid, instance_id, topic, group_id |
rocketmq_consumer_message_process_time_milliseconds_p95 | ms | P95 message processing latency. | uid, instance_id, topic, group_id |
rocketmq_consumer_message_process_time_milliseconds_p99 | ms | P99 message processing latency. | uid, instance_id, topic, group_id |
rocketmq_consumer_consume_success_rate | % | Consumption success rate. | uid, instance_id, topic, group_id |
rocketmq_consumer_failure_api_calls | count | Failed consumption API calls. | uid, instance_id, topic, group_id |
rocketmq_consumer_to_dlq_messages | messages | Messages sent to the dead-letter queue (DLQ). | uid, instance_id, topic, group_id |
FAQ
How do I get raw metric data from the dashboard?
Dashboard metrics are stored in ARMS Managed Service for Prometheus. To access the raw data:
Log on to the ARMS console with your Alibaba Cloud account.
In the left-side navigation pane, click Integration Center.
Search for
RocketMQand select Alibaba Cloud RocketMQ (4.0) Service. For setup details, see Integrate monitoring data of an Alibaba Cloud service.After integration succeeds, click Provisioning in the left-side navigation pane.
In the Cloud Service Area Environment list, click the target environment name.
On the Component Management tab, in the Basic Information section, click the region link for the Prometheus Instance.
On the Settings tab, find the available data access methods.
How do I integrate dashboard metrics into a self-managed Grafana system?
Complete the integration steps described in How do I obtain metrics on the dashboard? to connect ApsaraMQ for RocketMQ monitoring data to Managed Service for Prometheus. Then retrieve the HTTP API URL from the environment settings and use it to connect your self-managed Grafana instance. For details, see Use an HTTP API URL to connect a Prometheus instance to a self-managed Grafana system.
How are average TPS and max TPS calculated?
Average TPS = Total requests in one minute / 60 seconds
Max TPS = The highest value among 60 per-second TPS samples taken within one minute
Example: An instance produces 60 normal 4 KB messages in one minute.
Average TPS = 60 calls / 60 s = 1 call/s
If all 60 messages are sent in the first second, the per-second TPS values are 60, 0, 0, ..., 0. Max TPS = 60 calls/s.
If 40 messages are sent in the first second and 20 in the second, the values are 40, 20, 0, ..., 0. Max TPS = 40 calls/s.