If a message consumption exception occurs, you can view the status of a specified consumer group (Group) in the ApsaraMQ for RocketMQ console. This includes consumer online status, subscription consistency, message accumulation metrics, and consumer client information to quickly identify the cause of the exception.
Use cases
Consumer status information, such as online status, subscriptions, consumption TPS, message accumulation, and thread stack information, is often used for troubleshooting in the following scenarios:
|
Scenario |
Symptom |
Recommended action |
|
Inconsistent subscriptions |
On the Group Details page, the Subscriptions status for the consumer group displays Subscriptions are inconsistent. Fix the issue promptly.. |
|
|
Message accumulation |
On the Group Details page, the values for Inflight Messages, Ready Messages, and Queuing Time are higher than expected. |
Consumer group information
Procedure
Log on to the ApsaraMQ for RocketMQ console. In the left-side navigation pane, click Instances.
In the top navigation bar, select a region, such as China (Hangzhou). On the Instances page, click the name of the instance that you want to manage.
-
In the left-side navigation pane, click Groups. Then, in the group list, click the target group.
Results
The following table describes the fields on this page.
|
Field |
Description |
|
Consumer Status |
|
|
Consumption Mode |
The mode that consumers use to subscribe to messages. ApsaraMQ for RocketMQ supports the clustering consumption mode and the broadcasting consumption mode. The clustering consumption mode is the default. You can change the consumption mode on the consumer client. For more information, see Clustering consumption and broadcasting consumption. |
|
Real-time Consumption Rate |
The total consumption TPS of all consumer instances in the consumer group. Unit: messages/second. |
|
Inflight Messages |
Messages being processed by consumer clients for which consumption results have not yet been returned. |
|
Ready Messages |
Messages on the ApsaraMQ for RocketMQ server that are ready and available for consumption. |
|
Queuing Time |
The time elapsed since the earliest ready message became available. This value reflects the timeliness of message pulling by consumers. |
|
Subscriptions |
Indicates whether the subscriptions of consumer instances within the consumer group are consistent, and shows the tags each consumer client is subscribed to. For more information about subscription consistency, see Subscription consistency. ApsaraMQ for RocketMQ supports viewing subscriptions for online clients only. |
|
Client Connection Information |
Displays information about the currently online consumer clients, including their IP addresses, client versions, and stack information. |
Message accumulation
Procedure
On the Groups page, click Dashboard.
You can also use the dashboard to view all metrics for a specific instance. For more information, see Dashboard.
Results
The consumer group dashboard displays metrics related to the consumption scenarios of the current group. This includes the message accumulation and consumption rate for the group in a specified topic, as well as trend charts that show changes in message accumulation and production/consumption rates for that topic.
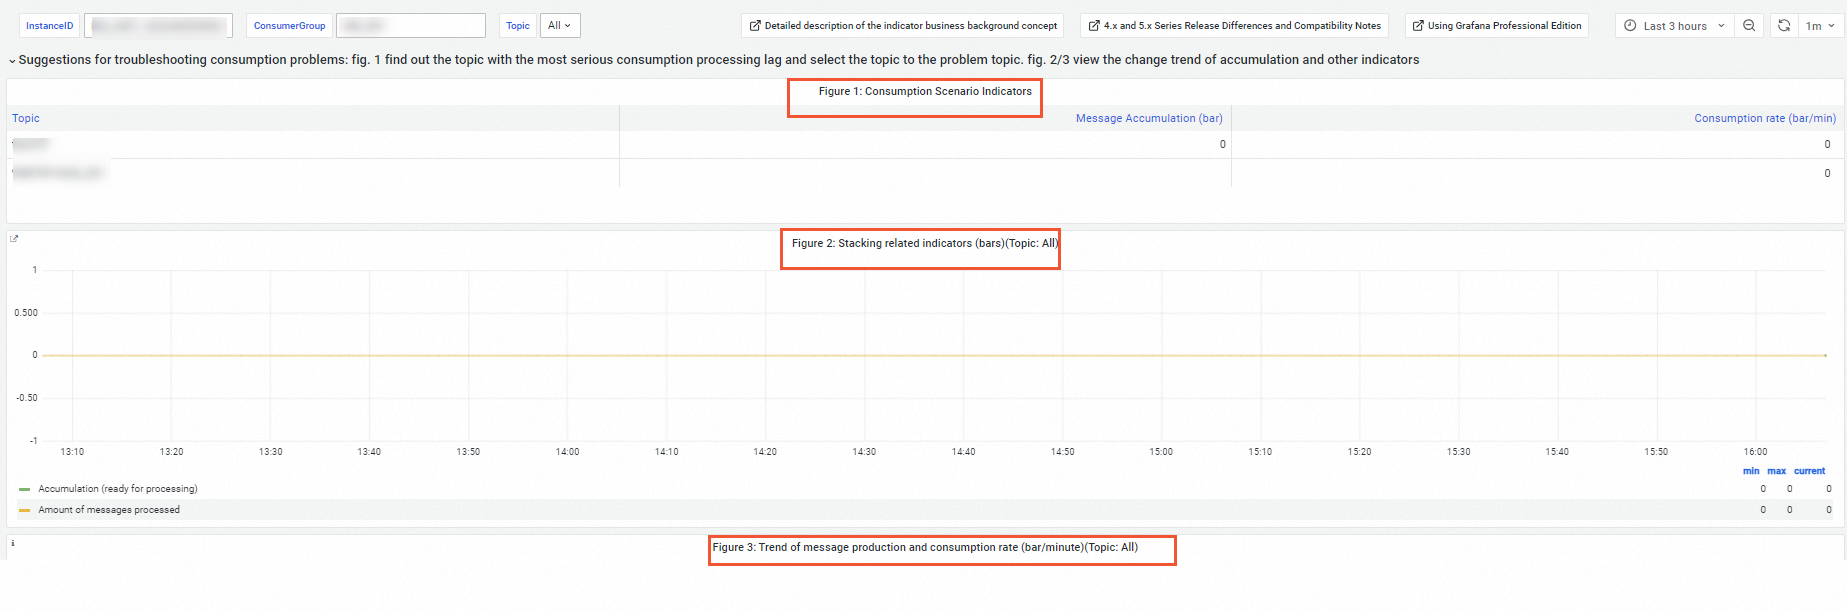
If you encounter a consumption exception, you can follow these steps to troubleshoot the issue:
-
In the consumption scenario metrics (Figure 1), identify the topic with the most significant consumption lag (the one with the highest message accumulation).
-
In the filter criteria above the charts, select the problematic topic that you identified in Figure 1.
-
Examine the trends for message accumulation and production/consumption rates for that topic in Figures 2 and 3 to narrow down the time frame of the exception.
-
Determine if any backend operations were performed or if network exceptions occurred during that time range.
Related documents
In addition to the console, you can use API operations to query a consumer group's consumption status and message accumulation.