Detect anomalous events and metric breaches in ACK One registered clusters with Cloud Monitor alerts.
Prerequisites
Configure the Cloud Monitor add-on in the registered cluster
Step 1: Grant RAM permissions to the Cloud Monitor component
Using onectl
-
Install and configure onectl on your local machine. For more information, see Manage registered clusters using onectl.
-
Grant RAM permissions to the Cloud Monitor component.
onectl ram-user grant --addon alicloud-monitor-controllerExpected output:
Ram policy ack-one-registered-cluster-policy-alicloud-monitor-controller granted to ram user ack-one-user-ce313528c3 successfully.
Using the console
Before installing an add-on in a registered cluster, create a RAM user with the required permissions and obtain an AccessKey pair to access Alibaba Cloud services.
-
Create a custom policy. Example:
{ "Action": [ "log:*", "arms:*", "cms:*", "cs:UpdateContactGroup" ], "Resource": [ "*" ], "Effect": "Allow" } -
Create an AccessKey for the RAM user.
WarningFor enhanced security, configure a network access control policy for the AccessKey to restrict access to trusted network environments and improve security. For more information, see AccessKey-based network access restriction policies.
-
Use the AccessKey pair to create a Secret named alibaba-addon-secret in the registered cluster.
The Cloud Monitor component uses this AccessKey pair to access cloud resources.
kubectl -n kube-system create secret generic alibaba-addon-secret --from-literal='access-key-id=<your access key id>' --from-literal='access-key-secret=<your access key secret>'NoteReplace
<your access key id>and<your access key secret>with your AccessKey pair.
Step 2: Install and upgrade the Cloud Monitor component
Using onectl
Install the Cloud Monitor component.
onectl addon install alicloud-monitor-controllerExpected output:
Addon alicloud-monitor-controller, version **** installed.Using the console
The console checks alerting requirements and guides you to activate, install, or upgrade the component.
-
Log on to the ACK console. In the left navigation pane, click Clusters.
-
On the Clusters page, click the name of your cluster. In the left navigation pane, click .
-
On the Alerts page, follow the on-screen instructions to install or upgrade the required components.
-
After installation or upgrade, go to the Alerts page to configure alerts.
Tab
Description
Alert Rules
-
Status: Enable or disable an alert rule set.
-
Edit Contact Group: Set the contact group for alert notifications.
Notifications are sent to contact groups only. Create contacts and groups first. To notify an individual, create a dedicated group for that contact.
Alert History
View up to 100 alert records from the last 24 hours.
-
Click a link in the Alert Rule column to view rule configurations in the corresponding monitoring system.
-
Click Details to navigate to the anomaly-related resource page.
-
Click Intelligent Analytics for AI-powered issue analysis and troubleshooting.
Alert Contacts
Create, edit, or delete contacts.
Contact methods:
-
Phone call/SMS: Set a mobile number for a contact to receive alerts by phone and SMS.
Only verified mobile numbers can receive phone call notifications. See Verify a mobile phone number.
-
Email: Set an email address for a contact to receive alert notifications.
-
Chatbots: DingTalk chatbots, WeCom chatbots, and Lark chatbots.
For DingTalk chatbots, add security keywords: alert, dispatch.
Verify email and chatbot notifications in the CloudMonitor console under before configuring them.
Alert Contact Groups
Create, edit, or delete contact groups.
If no contact group exists, the console creates a default group from your Alibaba Cloud account.
-
Set up alerting
Step 1: Enable default alert rules
-
Log on to the ACK console. In the left navigation pane, click Clusters.
-
On the Clusters page, click the name of your cluster. In the left navigation pane, click .
-
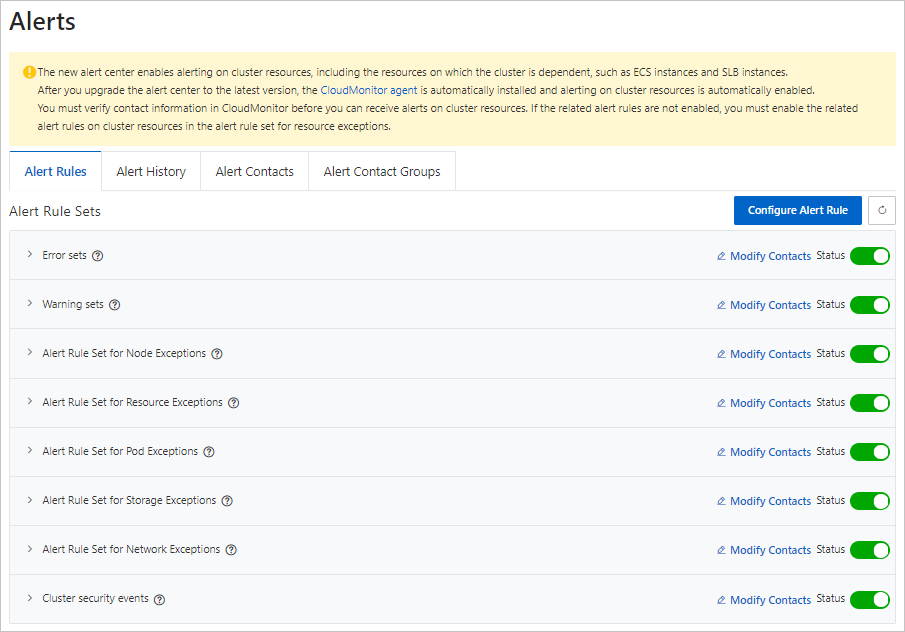
On the Alert Rules tab, Default alert rule sets include Error event set, Warn event set, cluster node anomaly alert rule set, cluster resource anomaly alert rule set, cluster container replica anomaly alert rule set, cluster storage anomaly event alert rule set, cluster network anomaly alert rule set, and cluster security anomaly events..
Step 2: Manually configure alert rules
-
Log on to the ACK console. In the left navigation pane, click Clusters.
-
On the Clusters page, click the name of your cluster. In the left navigation pane, click .
-
On the Alert Rules tab, click Modify Contacts to set notification recipients, then turn on the Status switch to enable the rule set.
Feature
Description
Alert Rules
-
ACK automatically generates alert templates for container scenarios, covering anomalous events and metric anomalies.
-
Alert rules are grouped into rule sets. Associate contact groups with a rule set and enable or disable it.
-
Each rule set contains multiple rules, each monitoring a single anomaly. Configure rule sets with a YAML resource; changes sync automatically.
Alert History
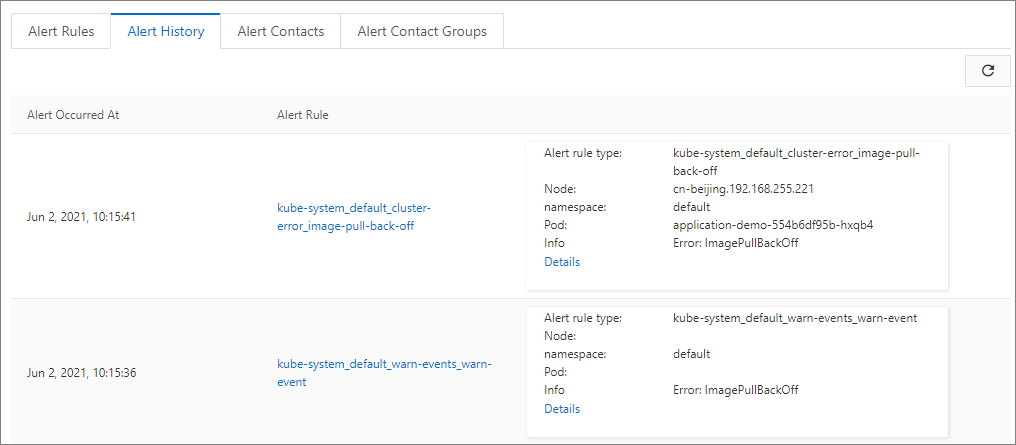
View the last 100 alert records. Click an Alert Rule link to view its configuration in the monitoring system. Click Details to go to the affected resource page.
Alert Contacts
Create, edit, or delete contacts.
Alert Contact Groups
Create, edit, or delete contact groups. If none exist, the console creates a default group from your Alibaba Cloud account.
-
Configure alert rules using CRDs
Enabling alerting creates an AckAlertRule resource with default templates in the kube-system namespace. Use this resource to configure cluster alert rule sets.
Console
-
Log on to the ACK console. In the left navigation pane, click Clusters.
-
On the Clusters page, click the name of your cluster. In the left navigation pane, click .
-
On the Alert Rules tab, click Configure Alert Rule in the upper-right corner. Then, in the Actions column of the target rule, click YAML to view the
AckAlertRuleCRD resource configuration. -
Modify the YAML file. See Default alert rule template for parameter details.
The following example shows the YAML configuration of an alert rule:
Use
rules.thresholdsto customize alert thresholds. For example, the preceding configuration triggers an alert when a node's CPU utilization exceeds 85% three consecutive times and more than 900 seconds have passed since the last alert.Parameter
Required
Description
Default
CMS_ESCALATIONS_CRITICAL_ThresholdYes
The threshold for the alert rule. If this parameter is omitted, rule synchronization fails and the rule is disabled.
-
unit: The unit of the threshold. Valid values: percent, count, and qps. -
value: The threshold value.
Varies based on the default alert rule template.
CMS_ESCALATIONS_CRITICAL_TimesOptional
The number of consecutive times the condition must be met before CloudMonitor triggers an alert. If this parameter is omitted, the default value is used.
3
CMS_RULE_SILENCE_SECOptional
The silence period in seconds after an initial alert is reported for a continuously triggering CloudMonitor rule. This prevents alert fatigue. If this parameter is omitted, the default value is used.
900
-
CLI
-
Edit the alert rule YAML file:
kubectl edit ackalertrules default -n kube-system -
Modify the YAML file, then save and exit. See Default alert rule template for parameter details.
Use
rules.thresholdsto customize alert thresholds. For example, the preceding configuration triggers an alert when a node's CPU utilization exceeds 85% three consecutive times and more than 900 seconds have passed since the last alert.Parameter
Required
Description
Default
CMS_ESCALATIONS_CRITICAL_ThresholdYes
The threshold for the alert rule. If this parameter is omitted, rule synchronization fails and the rule is disabled.
-
unit: The unit of the threshold. Valid values: percent, count, and qps. -
value: The threshold value.
Varies based on the default alert rule template.
CMS_ESCALATIONS_CRITICAL_TimesOptional
The number of consecutive times the condition must be met before CloudMonitor triggers an alert. If this parameter is omitted, the default value is used.
3
CMS_RULE_SILENCE_SECOptional
The silence period in seconds after an initial alert is reported for a continuously triggering CloudMonitor rule. This prevents alert fatigue. If this parameter is omitted, the default value is used.
900
-
Default alert rule templates
Default alert rules are created when:
-
The default alert rule feature is enabled.
-
You open the alert rule page for the first time while the feature is disabled.
The table below lists the default alert rules.
|
Alert |
Description |
Source |
Rule type |
ACK CR rule name |
SLS event ID |
|
Cluster inspection anomaly |
The automated inspection detected a potential anomaly. Review the issue and adjust maintenance as needed. |
SLS |
event |
cis-sched-failed |
sls.app.ack.cis.schedule_task_failed |