This topic answers frequently asked questions (FAQs) about intelligent monitoring.
-
Why am I not receiving alerts configured in Operation Center?
-
Why isn't an alert sent for a baseline in the Overtime state?
Troubleshooting unreceived alerts
First, confirm whether an alert was actually triggered. If an alert was triggered but you did not receive a notification, troubleshoot the issue based on the notification method. This issue occurs in two scenarios: you do not receive notifications by text message, or email, or you do not receive notifications in a DingTalk group. The following sections describe the troubleshooting steps.
-
Verify that an alert was triggered
-
For alerts related to scheduled tasks, go to the Auto Triggered Node Instance panel to check the instance status and confirm if the alert conditions are met. For more information about the trigger conditions for different rules, see the following documents:
For custom rule trigger conditions, see rule management. For baseline alert trigger conditions, see intelligent monitoring.
-
For alerts related to real-time synchronization tasks, go to Operation Center. In the left-side navigation pane, choose Real-time Task O&M > Real-time Synchronization Task to view the operational details of the task.
-
-
No alert was triggered
If a task does not complete, the system scans the last 100 incomplete tasks. If many tasks are frozen, the system might not scan the target task, so no alert is triggered.
-
An alert was triggered, but you did not receive a notification by text message, or email. How do I troubleshoot this?
First, verify how phone numbers and email addresses for alert contacts are configured in DataWorks.
Alerts by text message, and email use the contact information specified on the page in the DataWorks console. The main configuration steps are as follows:
-
On the Alert Contacts page, click Sync RAM Contact Info to synchronize RAM users to the contact list.
-
In the search box, search for the alert recipient and verify that their phone number and email address are correctly configured.
-
If the information is incorrect, click Edit in the Actions column to update the phone number or email address.
-
After the configuration is complete, the alert contact must confirm the activation via their phone or email.
If you do not receive an alert after the configuration, check the following on the Alarm contact page:
-
Ensure that you have configured your contact information.
-
Ensure that you have activated your phone number and email address after you add or update them.
Note-
An Alibaba Cloud account or a RAM user with AliyunDataWorksFullAccess permissions can set contact information for other RAM users. For more information, see View and set alert contacts.
-
If the contact information for an alert recipient is incorrectly configured, the system sends alert notifications to the message recipients configured in Common Settings. These notifications are related to overdue payments, service suspensions, or upcoming resource releases. Therefore, the intended recipients do not receive the alert notifications.
-
-
An alert was triggered, but you did not receive a notification in a DingTalk group. How do I troubleshoot this?
Verify the following settings:
-
1. Is the DingTalk chatbot webhook URL correct on the rule configuration page?
-
For scheduled task monitoring (baseline monitoring and custom rule monitoring), check whether the configured DingTalk chatbot webhook URL is correct and free of extra spaces.
-
For real-time synchronization alerts, you must configure the token of the DingTalk group chatbot. After selecting DingTalk in the Notification Method section of the Create Rule dialog box, check the URL in the DingTalk Group Chatbot Token field. This field supports multiple tokens separated by commas.
-
-
2. Is the DingTalk chatbot configured correctly?
To ensure that the DingTalk group receives alert notifications, go to the chatbot's Security Settings. The settings only support adding custom keywords, and the keywords must include DataWorks (case-sensitive). For more details on DingTalk chatbot configuration, see rule management.
-
Stopping task alerts
After a baseline is monitored, all of its nodes and their upstream ancestor nodes are also monitored. If a node on the baseline or an upstream node affects the data output of a guaranteed node on the baseline, intelligent monitoring generates an event and sends an alert to the task owner by default. For more information, see intelligent monitoring.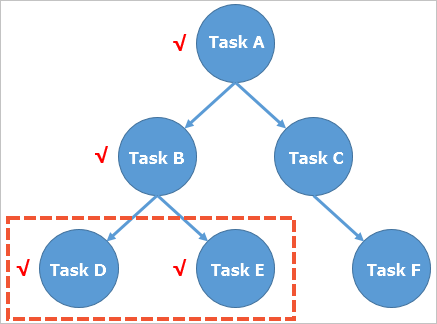
In the preceding figure, assume the DataWorks workspace has only six nodes. Nodes D and E are part of a guaranteed baseline. Nodes D, E, and all their upstream nodes are monitored. This means if an issue such as an error or slowdown occurs in Node A, B, D, or E, intelligent monitoring detects it. Nodes C and F are not monitored.
-
If you do not need alerts for nodes D and E, contact the baseline owner to remove them from the baseline.
-
Nodes A and B are upstream nodes of the guaranteed nodes D and E. Although they are not on the baseline, they affect the baseline's data output. If Node A or B fails or slows down, an event is generated and an alert is sent to the task owner by default.
If you do not need alerts for nodes A and B, contact the owner of nodes D and E to remove their dependencies on nodes A and B.
The Empty Baseline state
A baseline becomes an Empty Baseline in the following scenarios:
-
Scenario 1: A node can belong to only one baseline. When you move a node from one baseline to another, the node is migrated. If all nodes are removed from an enabled baseline, it becomes an Empty Baseline.
-
Scenario 2: A newly created baseline appears as an Empty Baseline on the day it is created. After you enable the baseline, its instances are generated the next day.
-
Scenario 3: An incorrect instance cycle is configured for an hourly baseline.
NoteFor example, an hourly task is scheduled to run at 06:00 and 18:00 every day. This task has two cycles. When you configure the hourly baseline, the first cycle of the task is at 06:00, and the second cycle is at 18:00.
No alert for overtime baselines
Baseline monitoring, when enabled, is applied to tasks. If all tasks run successfully, no alert is sent even if the baseline is in the Overtime state. This happens because all tasks completed successfully, making it impossible for the system to determine which task caused the delay.
A baseline might enter the Overtime state even when all tasks run successfully for the following reasons:
-
The committed completion time for the baseline is unrealistic.
-
The task dependencies are incorrect, which prevents an alert from being triggered even when the baseline is in the Overtime state.
Alerts for slow-running tasks
An alert for a slow-running task is triggered only if the following conditions are met:
-
The task is an upstream ancestor of a critical baseline.
-
The task is running significantly slower than its historical average.
You can go to the Events page to view downstream baseline information and discuss the impact of the slowdown with the owner of the downstream baseline.
-
If the impact of the task slowdown is minor, you can ignore the alert.
-
If you are responsible for the downstream impact, maintain the task to resolve the issue.
No alerts for failed tasks
Not all task failures trigger alerts. An alert for a failed task is triggered only if one of the following conditions is met:
-
The task is an upstream ancestor of a task in an enabled baseline. For more information about baseline alerts, see baseline management.
-
A custom alert rule is configured for the task. For more information about how to configure custom alert rules, see rule management.
Handling nighttime alerts
Log on to the DataWorks console. In the target region, click in the left-side navigation pane. Select a workspace from the drop-down list and click Go to Operation Center.
-
In the left-side navigation pane, click Intelligent Baselines and go to the Events tab.
-
On the Events page, you can disable the alert in one of the following two ways:
-
Handle the event to temporarily pause alerts:
-
Find the event and click Handle in the Actions column.
-
In the Handle Event dialog box, set the Expected Handling Duration.
-
Click OK.
NoteThis action logs the operation and pauses alerts for the specified duration.
-
-
Ignore the event to permanently stop alerts for it:
-
Find the event and click Ignore in the Actions column.
-
In the Ignore Event dialog box, click OK.
NoteThis action logs the operation and permanently stops alerts for the event.
-
-