Configure custom rules to monitor task status and resource usage, use intelligent baselines to ensure timely data generation in complex dependency scenarios, and create O&M rules to automate resource group operations.
Features
The following table describes the monitoring features.
|
Feature |
Description |
|
Intelligent baselines detect exceptions that may delay task completion, provide early warnings, and ensure timely data generation in complex dependency scenarios.
|
|
|
You can manage global rules on the page. You can also create custom monitoring rules based on your business requirements.
|
|
|
View alerts from custom rules, global rules, and intelligent baselines on the page. |
|
|
Define shift schedules on the page. Select a schedule when configuring a monitoring rule to route alerts to the on-duty engineer. Note
A shift schedule defines primary and secondary on-duty engineers. Alerts go to the primary engineer by default. After two alerts for the same issue, the third and subsequent alerts go to both engineers. |
|
|
Create O&M rules for exclusive resource groups and associate them with monitoring rules. When a rule triggers, the system automatically performs O&M on tasks running on the target resource group that match the Filter Conditions. Note
Currently, O&M rules can only be associated with monitoring rules for scheduling resources. |
Task status monitoring
Monitored objects
Monitoring rules (custom rules and intelligent baselines) cover auto triggered node status, auto triggered node instance status, real-time compute task status, and resource usage.
-
Monitor the status of auto triggered nodes
Each night, DataWorks generates Scheduled Instance for the next day based on Auto Triggered Node. To ensure that these instances are generated and run as expected, DataWorks provides built-in global alert rules (not workspace-level) to monitor the status of Auto Triggered Node. If an exception occurs, the system automatically sends an alert. Alerts are triggered for Isolated Nodes and Node Dependency Loop.
Rule type
Monitored object
Trigger condition
Description
Global rule
isolated node: A node with no parent dependencies.
An alert triggers automatically when an isolated node is detected. Resolve the issue immediately.
NoteEvery auto triggered node, except the workspace root node, must have a parent dependency to be scheduled and run. An isolated node will not run automatically and can cause serious issues if it has many downstream dependencies.
-
DataWorks scans auto triggered node status at 09:00, 12:00, and 16:00 daily. If an anomaly such as an isolated node or dependency loop is found, the system sends an alert. Exceptions within 10 minutes before a scan are processed in the next cycle.
-
Global rules are built-in. By default, alerts go to the node owner by text message and email. Change the alert recipient on the Rule Management page.
-
You can disable a global alert rule on the Rule Management page.
node dependency loop: A node that is an upstream task but also depends on one of its own downstream tasks, creating a circular dependency.
An alert triggers automatically when a dependency loop is detected. Resolve the issue immediately.
NoteThe automatic scheduler will not run a node in a dependency loop.
-
-
Monitor the running status of auto triggered node instances
An auto triggered node generates instances when periodically scheduled. Configure custom monitoring rules for Auto Triggered Node to monitor the running status of their Scheduled Instance. This includes custom rule-based alerts for specific objects and intelligent baseline alerts for proactive warnings on important tasks.
Rule type
Monitored object
Trigger condition
Tasks in a specified Node, Baseline, Workspace, or Workflow.
-
An alert is triggered when a task is Complete, Incomplete, has an Error, is Incomplete in Cycle, has Timeout, or has an Error Persisting After Automatic Rerun of Node.
-
When the object type is Workspace, additional trigger conditions include Instance Generated and Fluctuation of Instance Count.
The monitoring scope includes tasks in the baseline and all their upstream dependencies.
Note-
You can set the priority for a baseline to ensure that tasks within it run on time and produce data as expected.
-
If a task is critical and has complex upstream dependencies, you can add it to a baseline to ensure its stability.
-
Baseline alerts:
When the system predicts that a baseline task will not complete within the promised time, it sends a baseline alert based on the configured notification method. Core logic: baseline alerts.
-
Event alerts:
An event is generated and an alert sent if a baseline task or upstream task fails, or if a critical-path task slows down. Manage events.
-
-
Monitor the running status of real-time compute tasks
-
Rule type: Custom rule.
-
Monitored object: Real-time compute tasks.
-
Trigger condition: An alert is triggered when a task has an Error.
-
-
Monitor resource usage
-
Rule type: Custom rule.
-
Monitored object: exclusive resource group for scheduling, exclusive resource group for Data Integration.
-
Trigger conditions:
-
An alert is triggered if the Usage of a resource group exceeds a specified value for a specified duration.
-
An alert is triggered if the Number of Instances Waiting for Resources in Resource Group in a resource group exceeds a specified value for a specified duration.
-
-
Notification methods
When a monitoring rule triggers, the platform sends notifications by email, text message, phone call, or DingTalk group message.
|
Rule type |
Notification method |
Alerting frequency control |
|
Custom rules, global rules, and intelligent baselines |
|
You can control the alerting frequency by setting Maximum Alerts, Minimum Alert Interval, and Alerting Do-Not-Disturb Period. Note
|

Automated resource O&M
Automated O&M uses pre-configured monitoring and O&M rules to automatically manage tasks.
-
Trigger condition: An associated monitoring rule is triggered.
Note-
Monitoring is currently supported for Resource Group Usage and the number of instances waiting for resources in a resource group.
-
Automated O&M is currently supported only for an exclusive resource group for scheduling.
-
-
Target instances: Automated O&M is performed on instances that match Filter Conditions such as instanceType, instance scheduling cycle, instance Priority, instance Status, and the instance's Workspace.
-
O&M action: Terminate running instances.
NoteYou can terminate a maximum of 2,000 instances at a time.
Task alert diagnosis
View task alert information in the DAG or on the Run Diagnosis page.
-
View in the task DAG
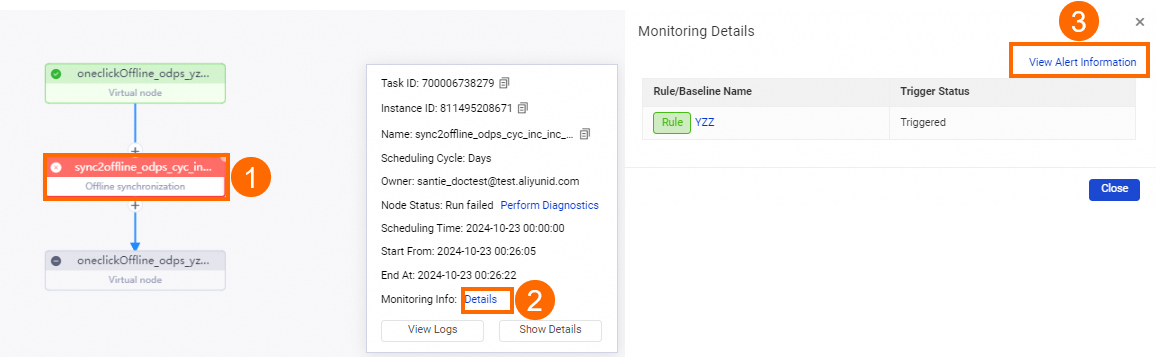
If an instance has triggered a monitoring alert in the last 24 hours, go to the page. Open the DAG for the instance and click the red alert icon (Area ② in the figure) in the upper-right corner of the instance. The Monitoring Details panel appears, showing a list of rules or baselines that monitor the task and their trigger status. You can click View Alert Content in the upper-right corner to view alert details on the Alerts page, or click a Rule/Baseline Name to view its configuration details.
NoteYou can select the Nodes that generated alarms in the past 24 hours checkbox (Area ① in the figure) to filter the instances.
-
View on the Run Diagnosis page
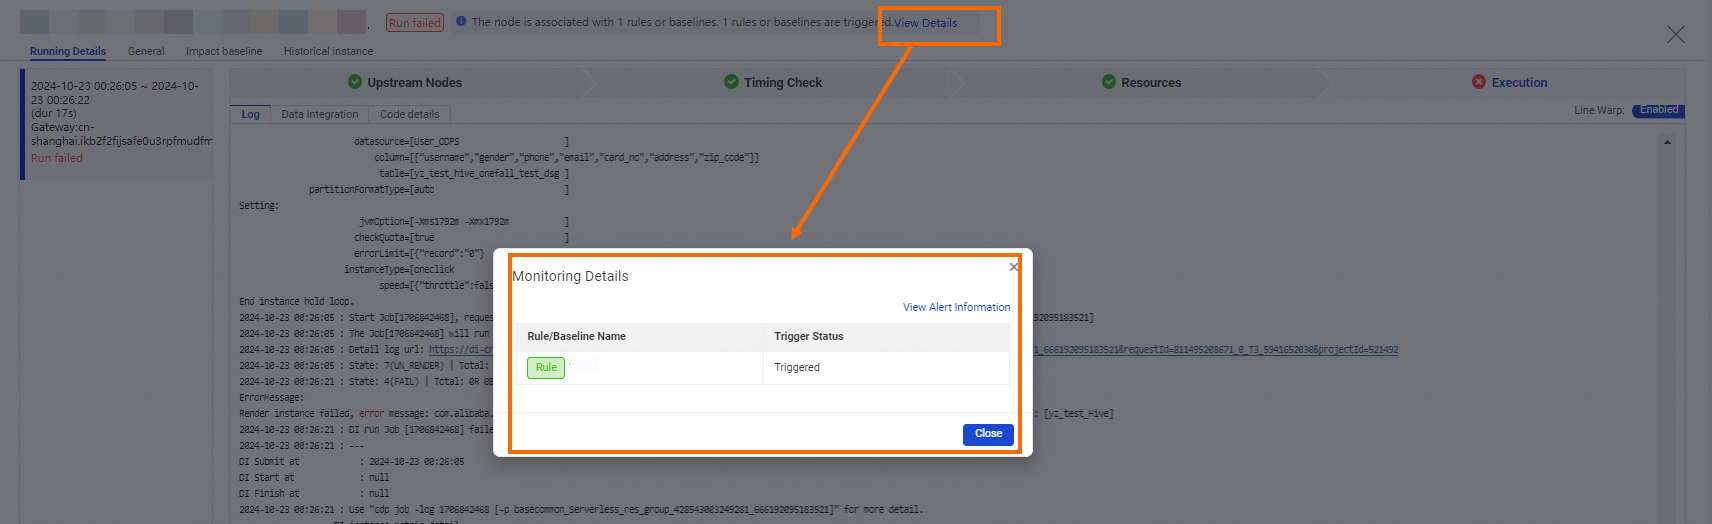
For a task with monitoring alerts configured, you can also click View Details in the notification area on the Intelligent Diagnostics page. In the Monitoring Details window that appears, a list of rules or baselines that monitor the current task is displayed, along with the trigger status of each. You can click View Alert Content in the upper-right corner to go to the Alert Information page and view alert details, or click a Rule/Baseline Name to go to the configuration page for that rule and view its configuration details.
-
View on the Alerts page
View all alerts from the intelligent monitoring module on the Alerts page. Alert details show the trigger process, including the rule, condition, and reason for the alert.