The asset inventory displays data assets by type and supports search, access, and favorites for quick data discovery.
Asset Inventory Page
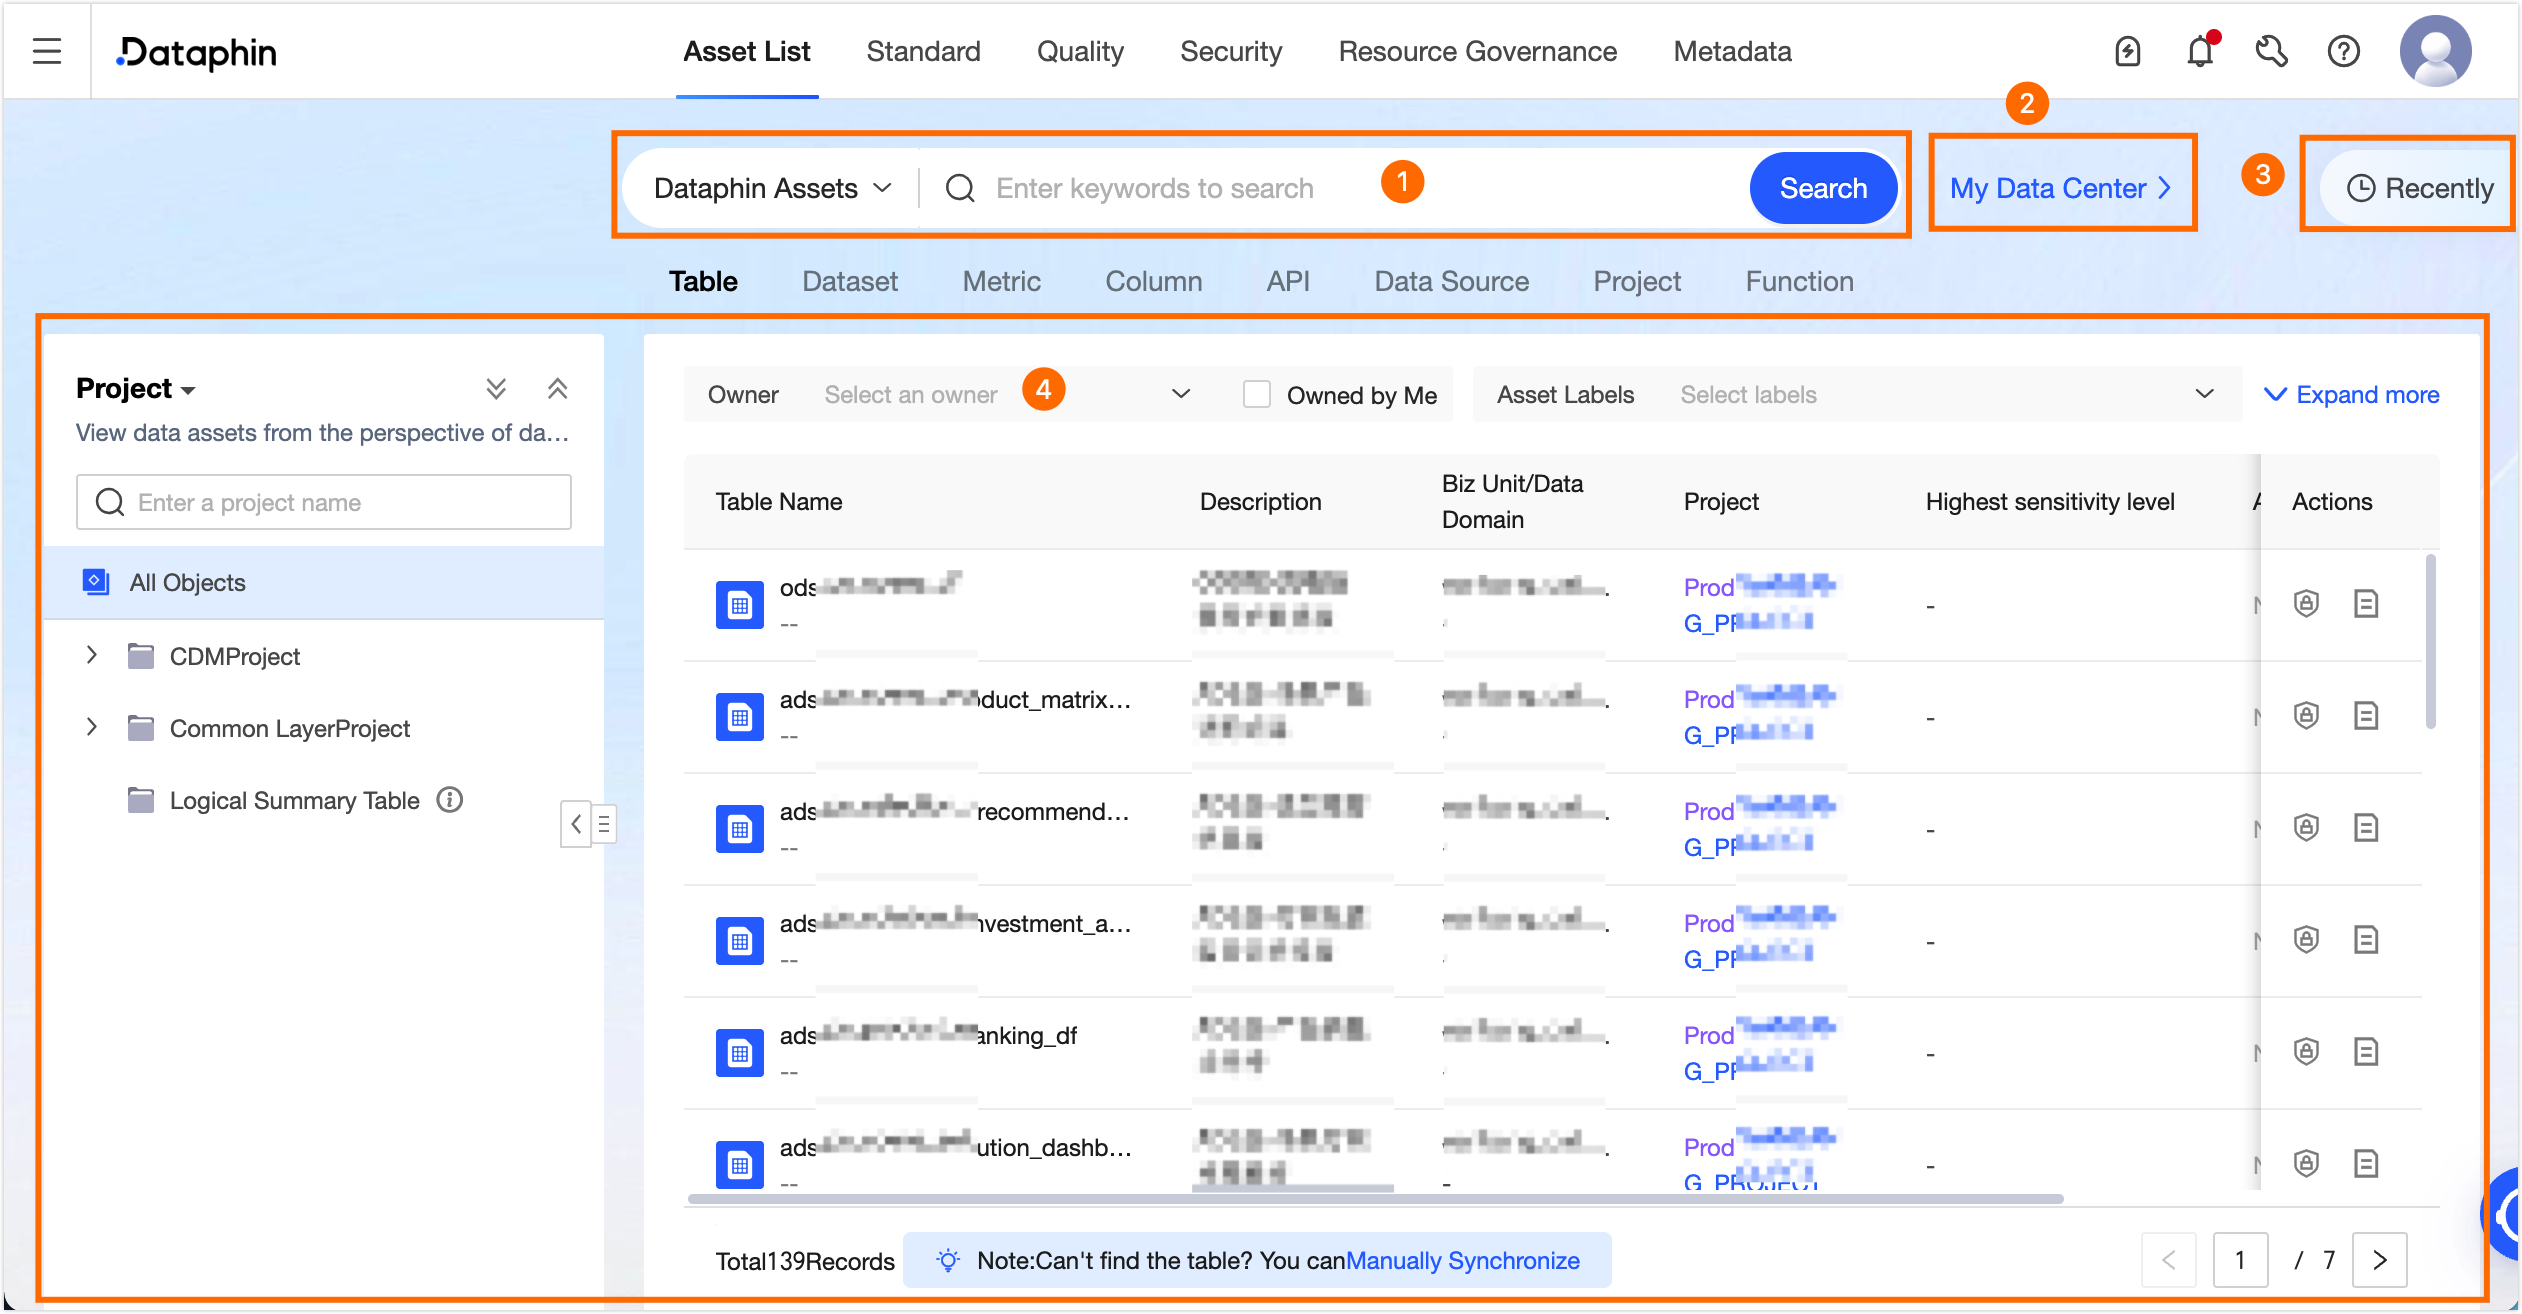
On the Dataphin homepage, click Governance > Asset Inventory in the top menu bar to go to the Asset Inventory page.
|
Area |
Description |
|
① Asset Search area |
Search for Dataphin assets or other system assets by name or description keywords. For more information, see Search For Data. |
|
② Personal data center |
View assets that you are responsible for, have favorited, have subscribed to, and are available to you. For more information, see personal data center. |
|
③ My history |
|
|
④ Asset list |
View the list pages for various asset types. For more information, see Dataphin asset list overview. |
Search For Data
On the asset list page, search for various types of assets.
|
Area |
Description |
|
Dataphin asset search area |
Search for assets by name or description keywords.
|
|
Other system assets search area |
When metadata collection and management is enabled for the current tenant, switch between Dataphin assets and other system assets to view details for each asset type.
|
Dataphin Asset List
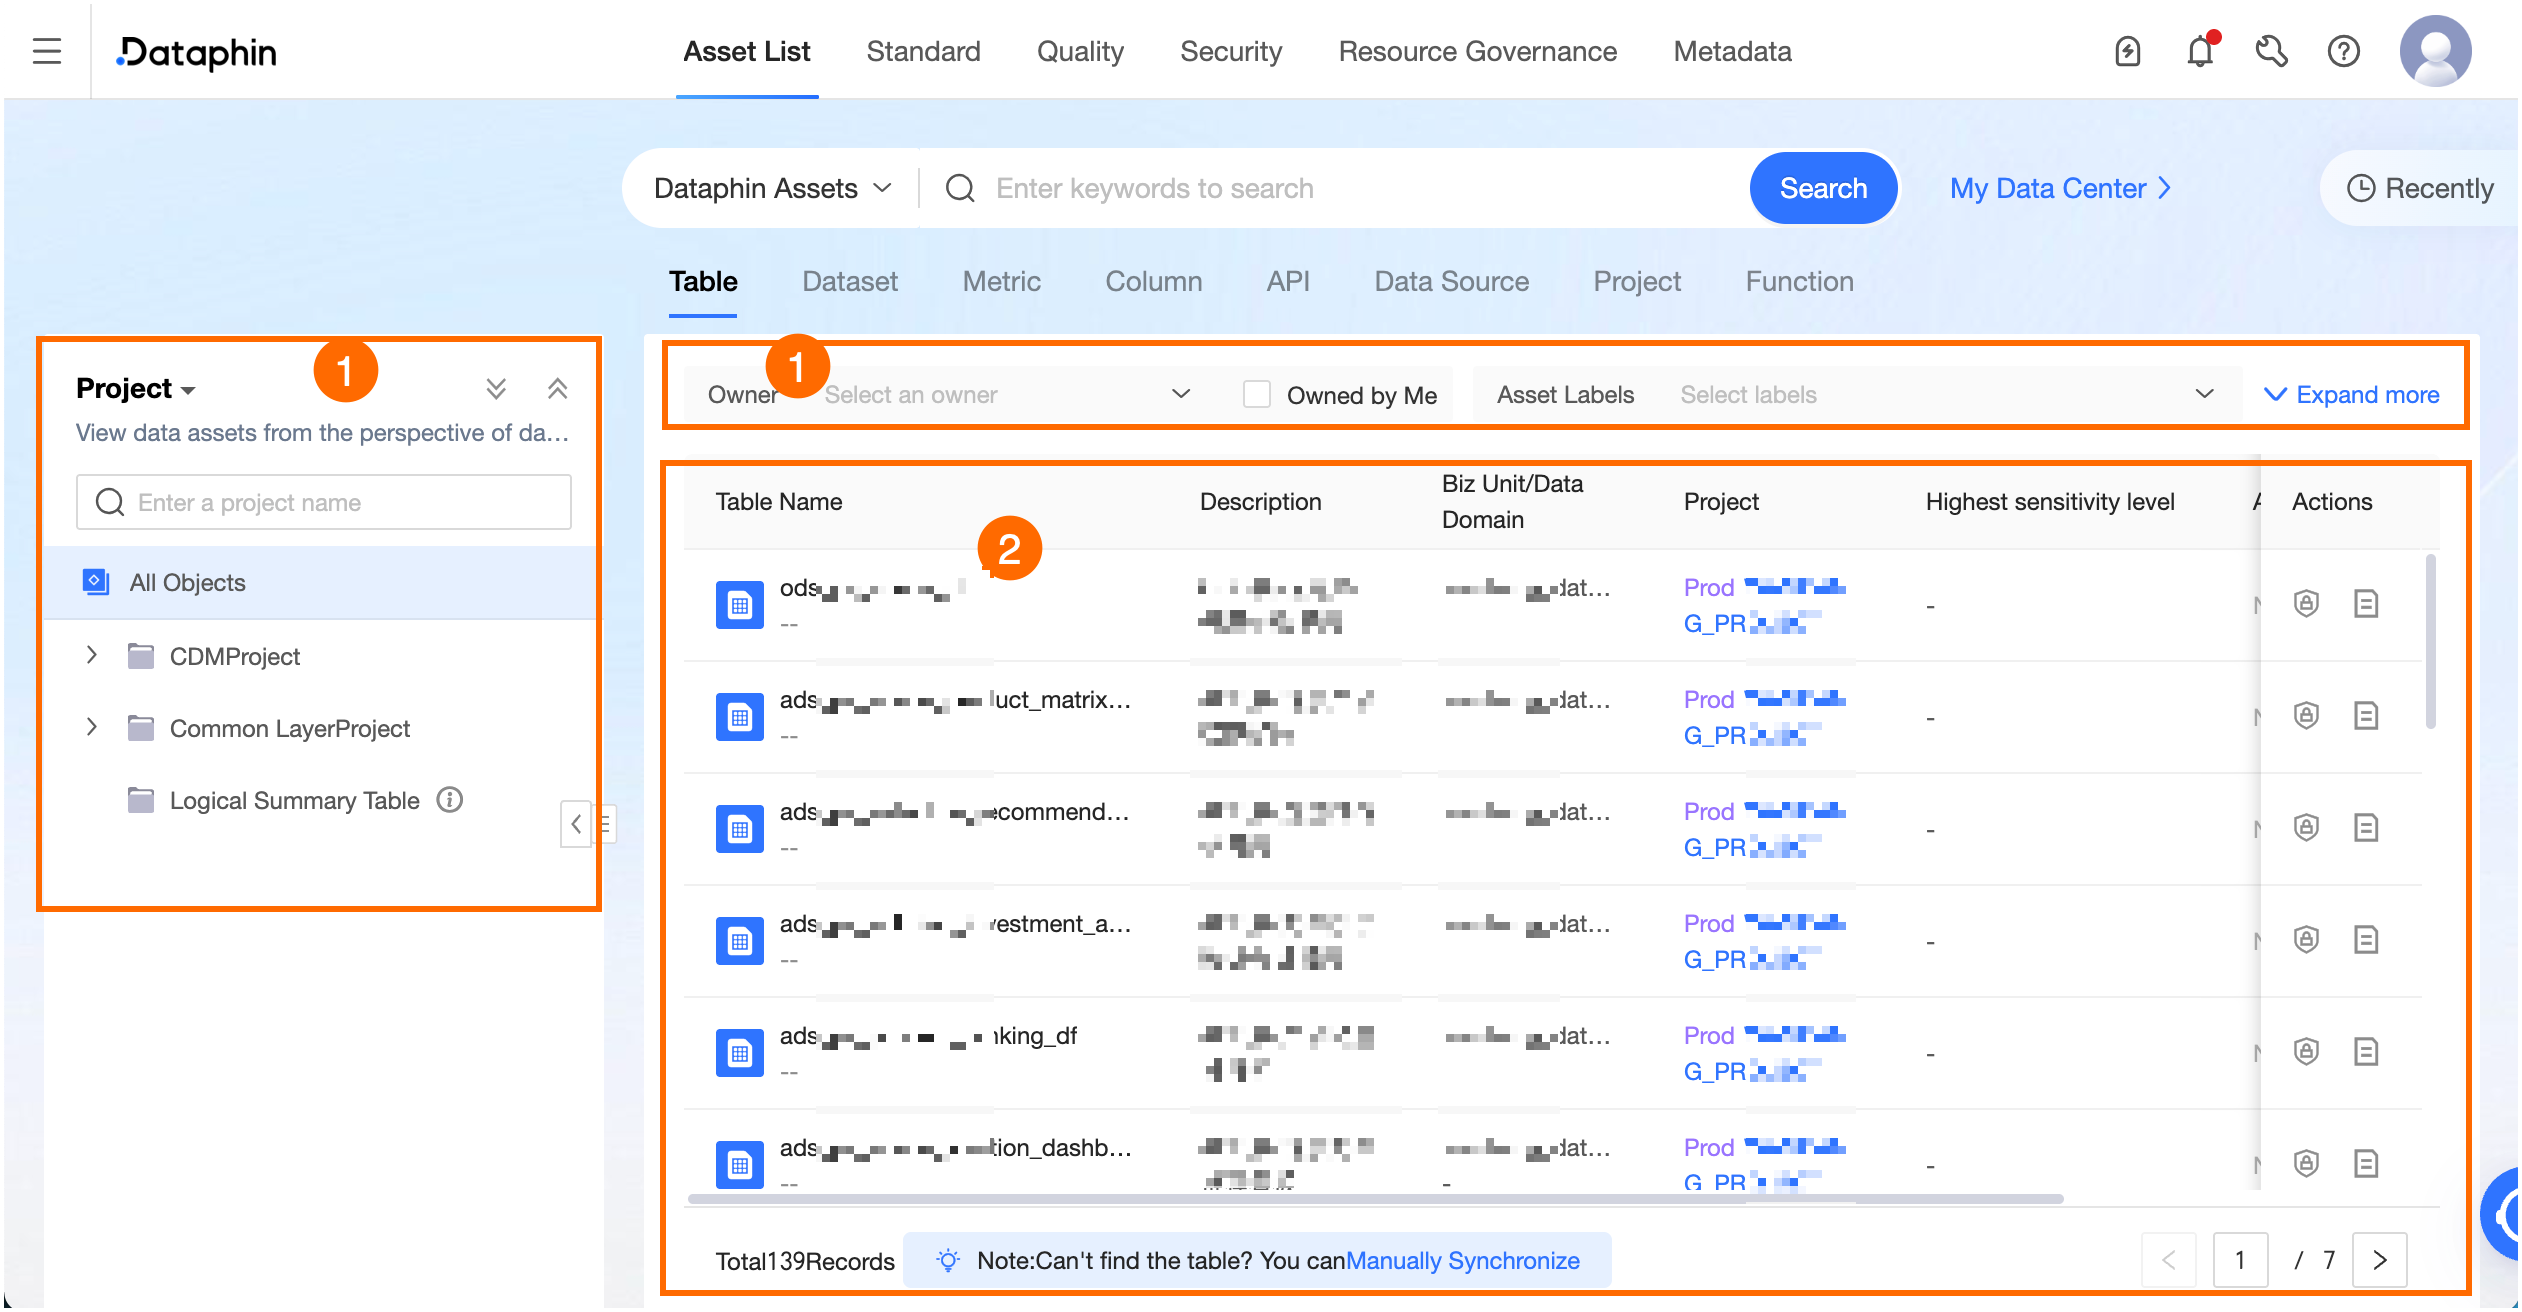
The Dataphin asset list displays information about various asset objects. The following image uses a data table as an example.
|
Number |
Description |
|
Data table |
|
|
① Filter area |
Note
The data domain/subject domain view and related filters require the Intelligent R&D feature to be enabled. In the project view, the summary logical table directory is displayed only when the Intelligent R&D feature is enabled. |
|
② List area |
Displays filtered results, including table name, description, data domain/subject domain (Intelligent R&D edition only), project (hidden when the summary logical table directory is selected), maximum sensitivity level (requires Asset Security), asset tags, and owner. You can also apply for permissions or view asset details.
|
|
Metric |
|
|
① Filter area |
|
|
② List area |
Displays a filtered list of metrics, including metric name, statistical granularity, statistical period, parent summary table, parent project, data domain, environment, business owner, description, and update frequency. You can also view metric details. View Details: Click a metric name or the View Details |
|
Field |
|
|
① Filter area |
|
|
② List area |
Displays filtered fields, including field name/description, field type, data domain, environment, parent project, parent table, table type, and parent table owner. You can also view field details. View Details: Click a field name or the View Details |
|
API |
|
|
① Filter area |
You can refine your search by filtering by Service Project, API Type, and owner. You can also quickly filter for APIs that are Owned by me. |
|
② List area |
Displays filtered APIs, including API name/ID, description, parent project, call mode, API type, operation type, data volume, data source, number of applications/calls, owner, last update time, and data update frequency. You can also view API details. View Details: Click an API name or the View Details |
|
Data source |
|
|
① Filter area |
You can refine your search by filtering by Type, Purpose, and environment. |
|
② List area |
Displays filtered data sources, including data source name, description, environment, purpose, type, owner, and update time. You can also apply for permissions or view data source details.
|
|
Project |
|
|
① Filter area |
You can refine your search by filtering by data domain, Project Mode, environment, and compute engine. |
|
② List area |
Displays filtered projects, including project name, description, data domain, environment, project mode, and creator. You can also enter the workspace or view project details.
|
|
Function |
|
|
① Filter area |
You can refine your search by filtering by project, Type, Creator or Created by me, environment, Application Scenario, and Function Source. |
|
② List area |
Displays filtered functions, including function name, description, environment, function type, function source, parent project, creator, and compute engine. You can also view function details. View Details: Click a function name or the View Details |
Other system assets list
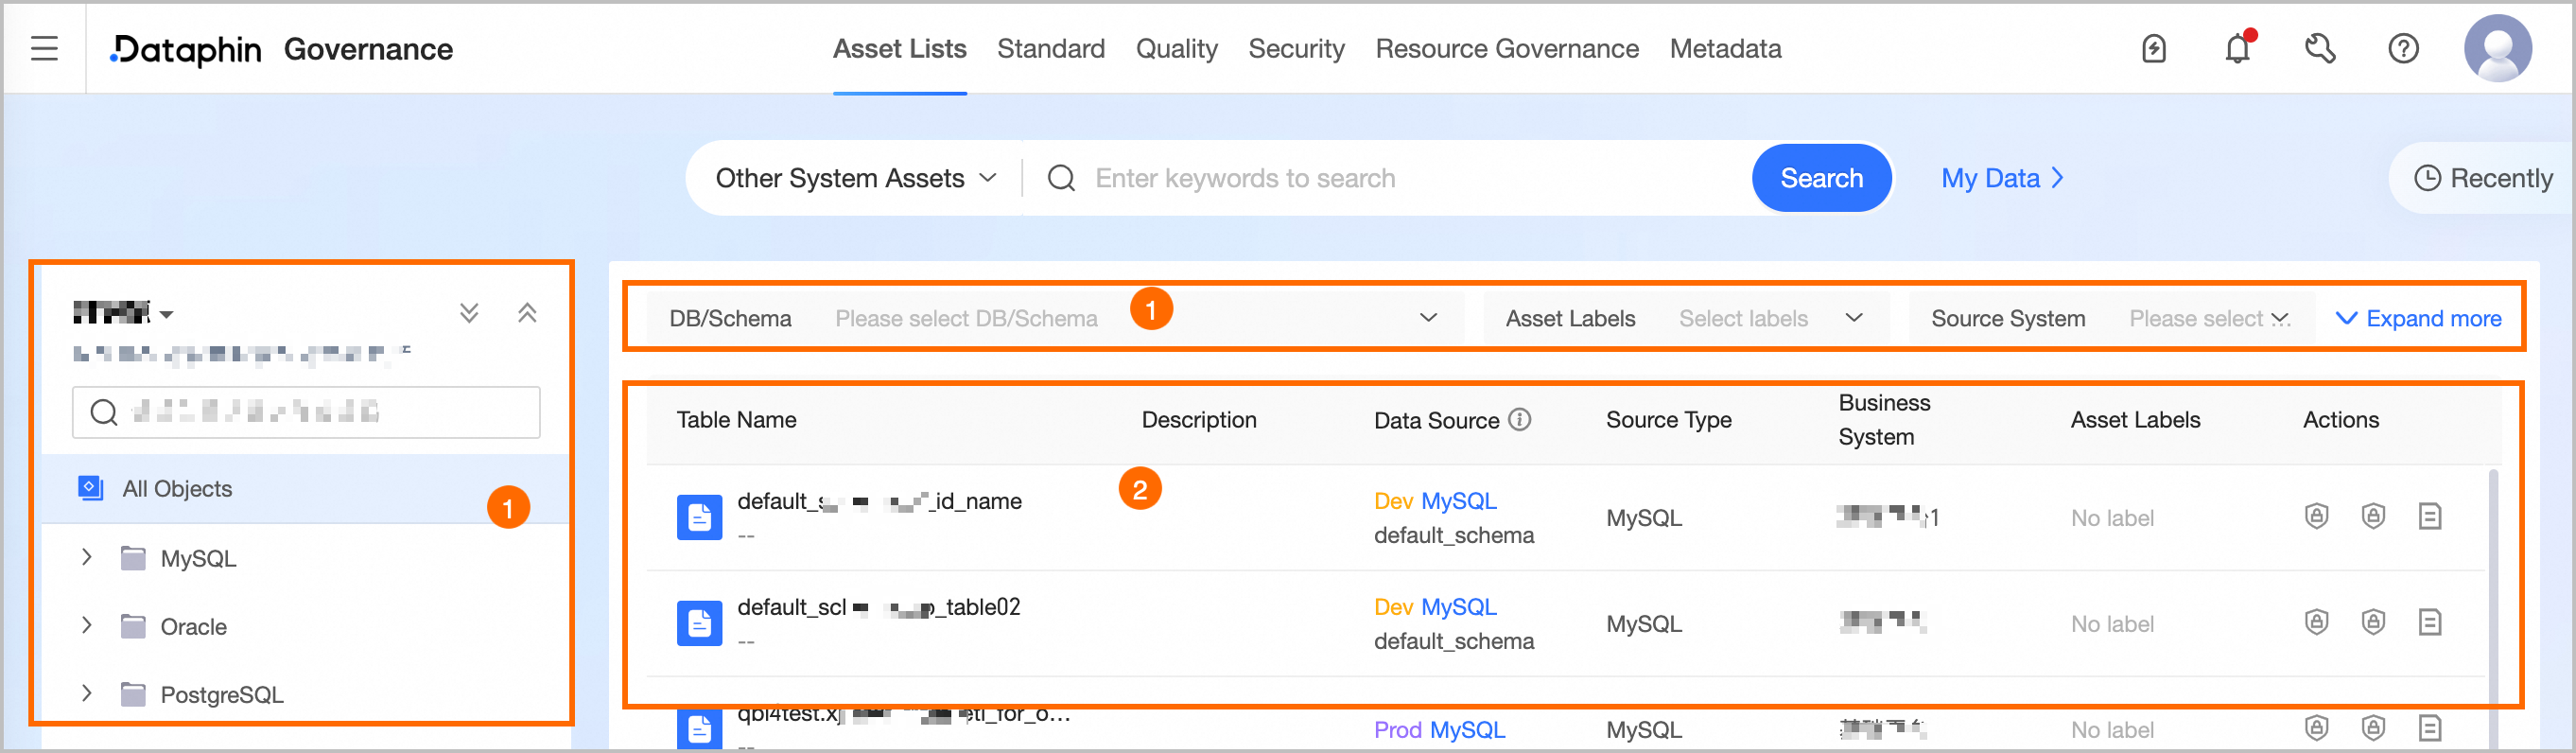
The metadata collection and management feature must be enabled.
The other system assets list displays metadata collected from data sources.
|
Number |
Description |
|
① Filter area |
|
|
② Metadata list |
This list shows the filtered metadata, including table name, description, source data source, source data source type, source system, maximum sensitivity level (requires Data Security), and asset tags. You can also apply for data source permissions or view asset details.
|