All Products
Search
Document Center

Dataphin:MaxCompute physical table and field details

Last Updated:Apr 10, 2025

This topic explains how to view details of physical tables and fields in MaxCompute.

Physical table details entry

  1. On the Dataphin home page, click Administration > Asset Checklist in the top menu bar.

  2. Click the Data Table tab, select the desired physical table, and click either the table name or the Actionsimage icon to open the object details page.

Physical table details
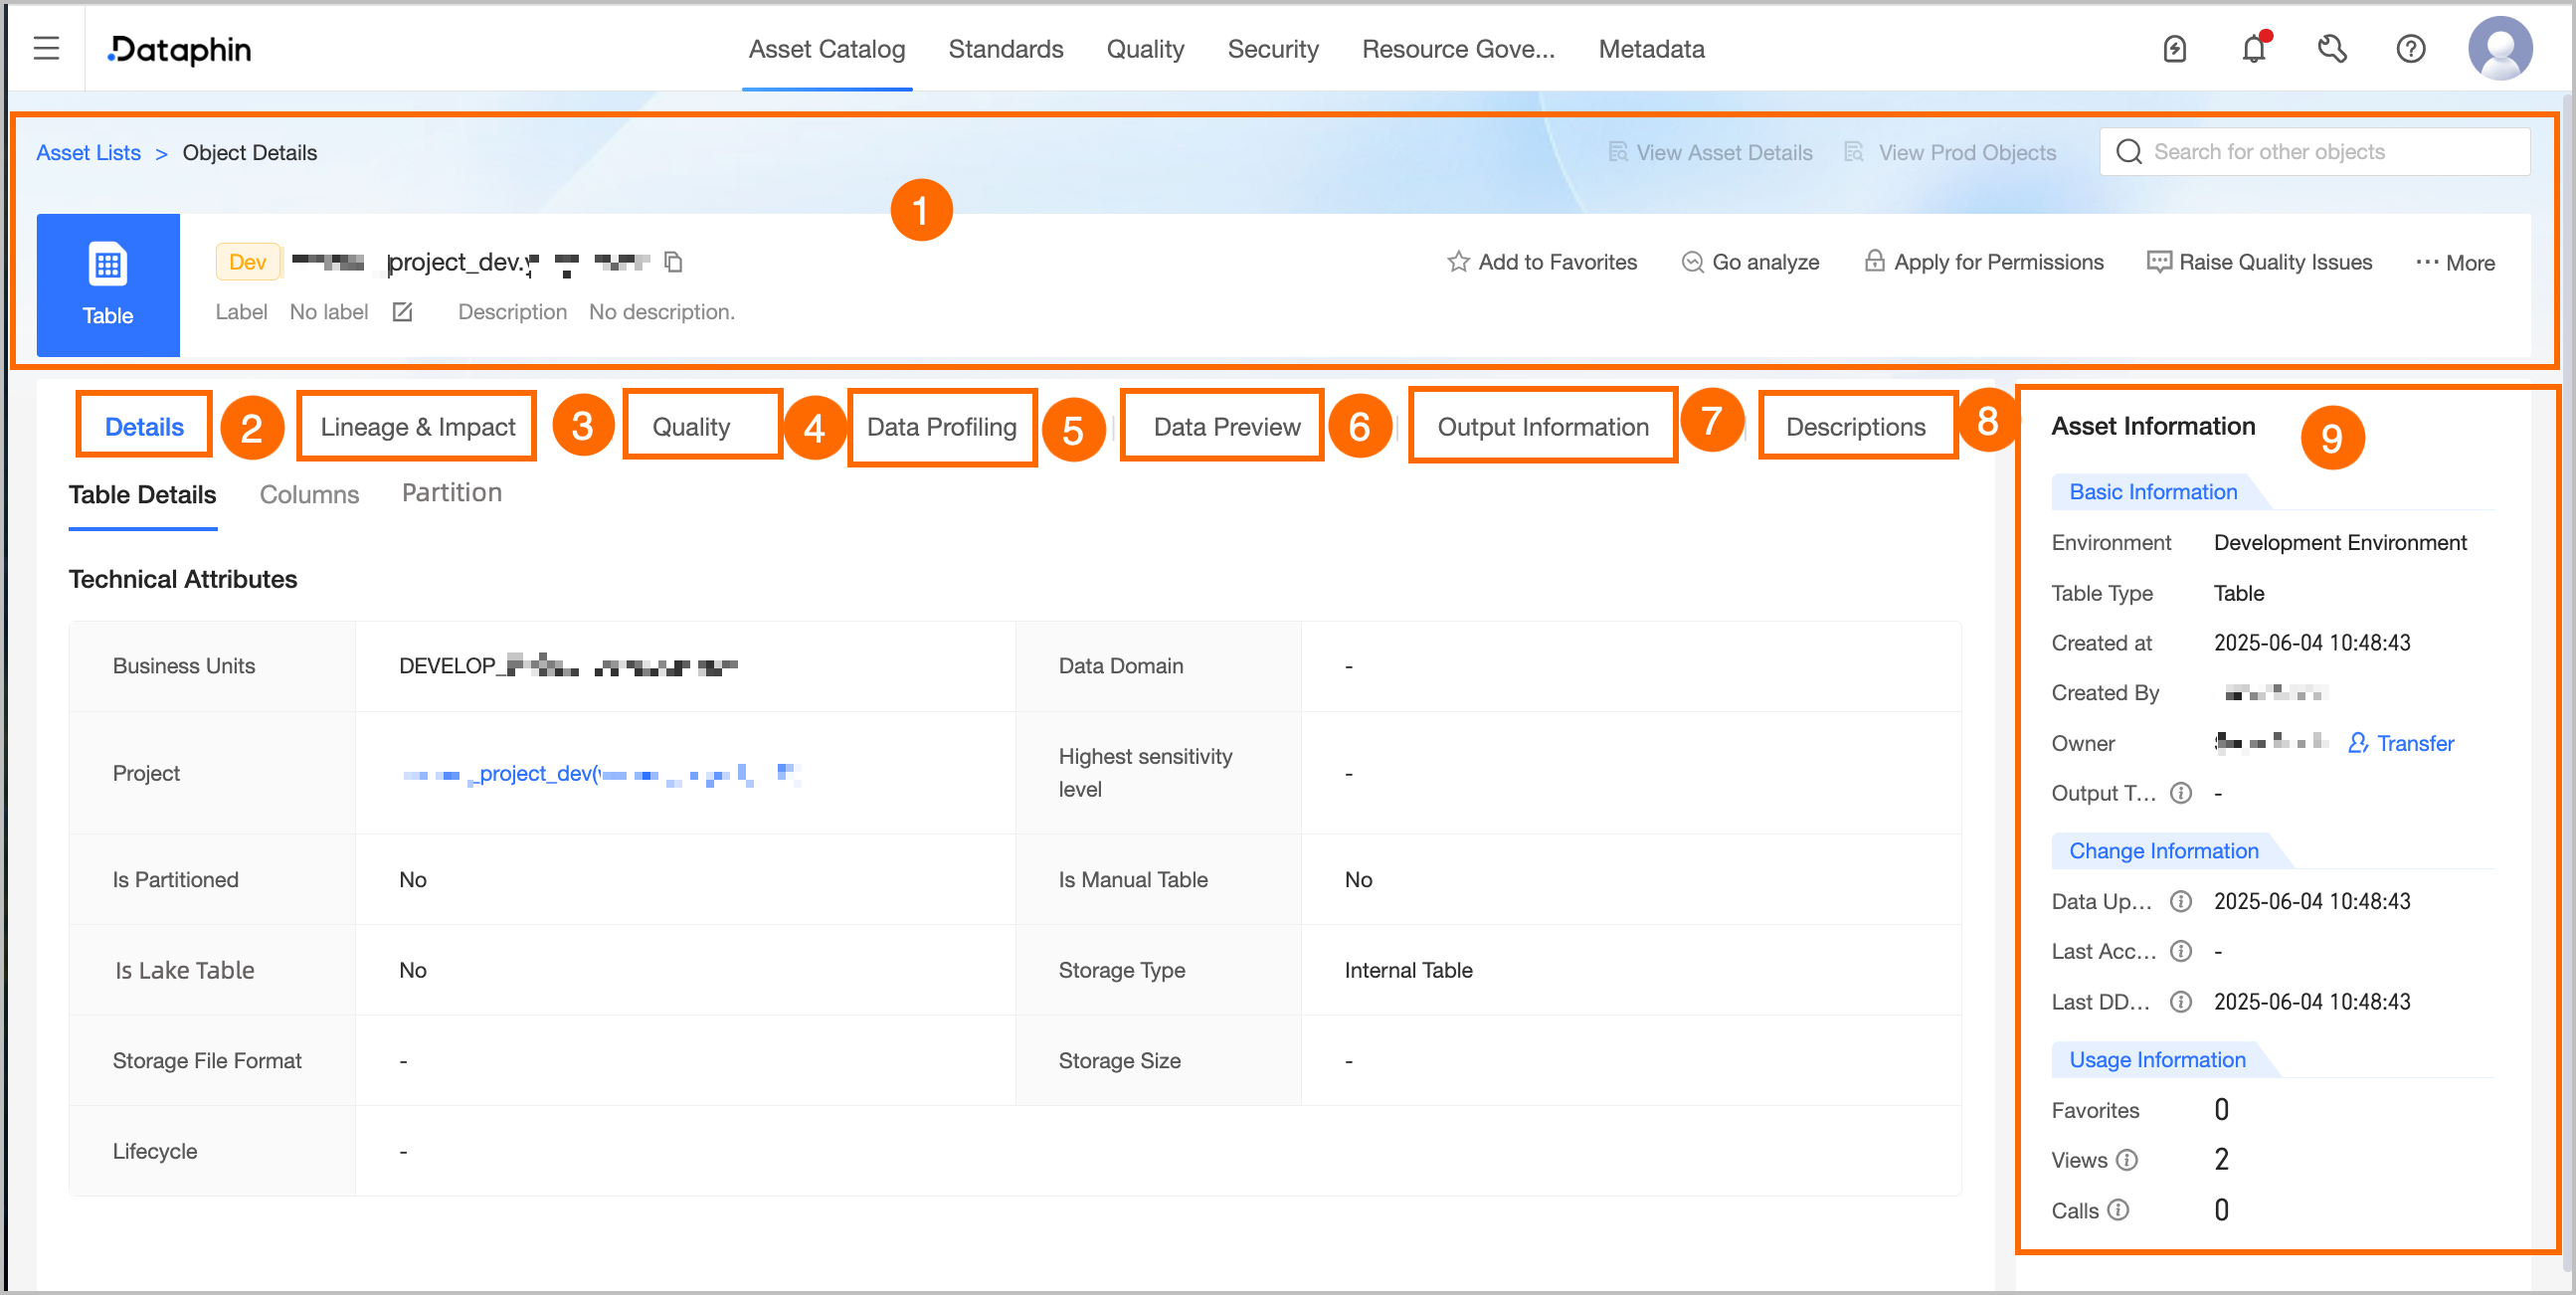
image

Area

Description

① Summary information

Displays information such as the type, environment, name, tag, and description of the table. You can also perform the following operations:

  • Search for other asset objects: You can quickly search and switch to view details of other assets.

  • View Asset Details: If the current object has been listed in the Asset directory, you can quickly jump to the directory details page to view the listed information.

  • View Production/development Objects: Supports quickly switching to the object details in the corresponding production/development environment.

  • Tag: Displays the tag values configured for the current asset. To modify the tags, you can click Edit:

    • The length of each tag value must not exceed 128 characters.

    • Each asset object can be configured with up to 20 tag values.

    • Super administrators can modify asset tags for all table types. The current table owner can modify asset tags for tables they own; project administrators can modify asset tags for physical tables under the projects they manage.

  • Favorite: Click to add to or remove from favorites. After adding to favorites, you can view the last 30 assets you favorited in the Asset checklist > My Footprint for easy subsequent queries. You can also view all favorited assets in the Personal Data Center. For more information, see View and manage my favorited assets.

  • Go Analysis: Click to jump to the Notebook page to automatically create the corresponding Notebook task. For more information, see Create a Notebook.

  • Request Permission: Click to quickly jump to the permission request page for the current table. For more information, see Request, renew, and return table permissions.

  • Feedback quality issues: You can use this feature to provide feedback to the current quality owner about quality issues encountered during the use of the asset (such as unstable data output or inaccurate data content) to notify the relevant owner to make timely corrections, thereby promoting the improvement of asset availability and health. For configuration details, see Add and manage issue checklists.

    You need to enable the Data Quality module to use the feedback quality issues feature. Subsequently, you can view the processing flow and results of feedback issues in the issue checklist of the quality module.

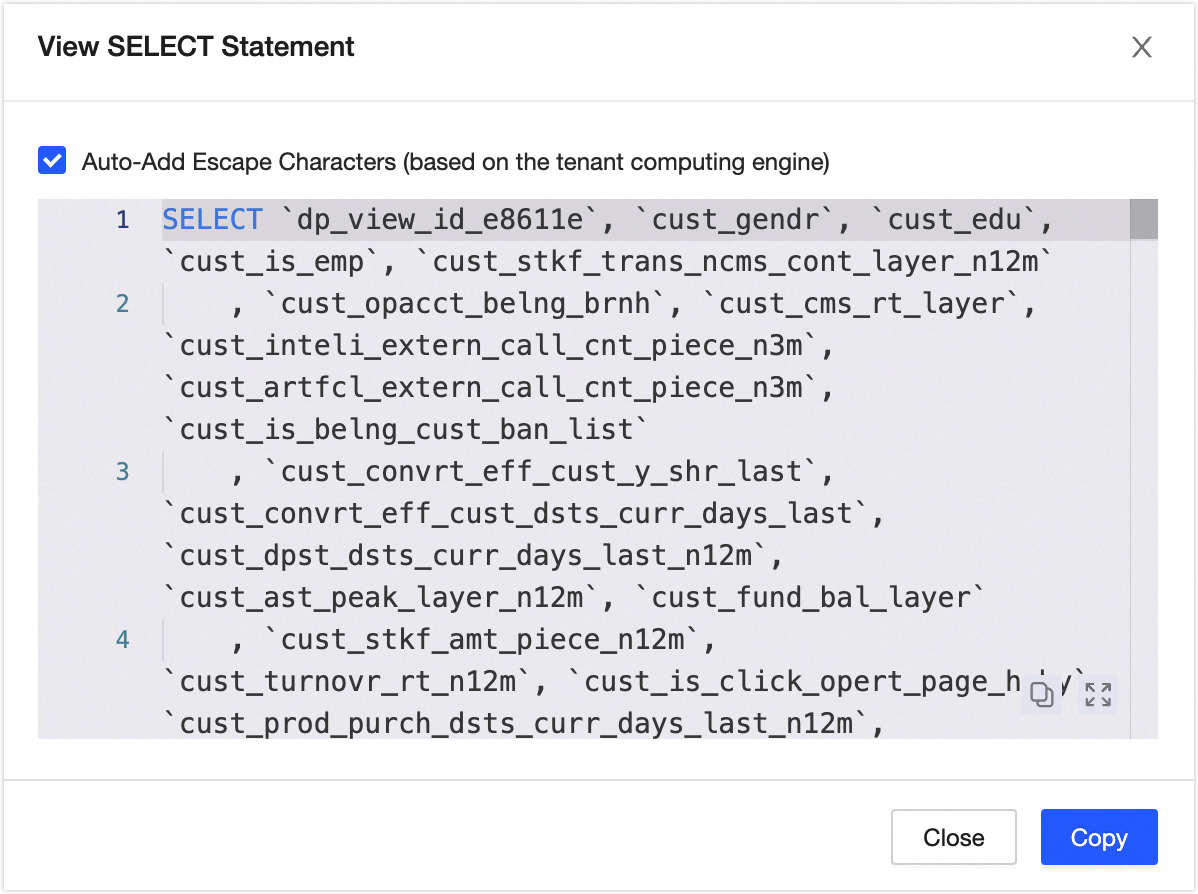
  • Generate Select Statement: Click to generate the current table query statement. You can choose whether to add escape characters. You can copy the query statement and then query data on the ad hoc query or analysis page.

    image

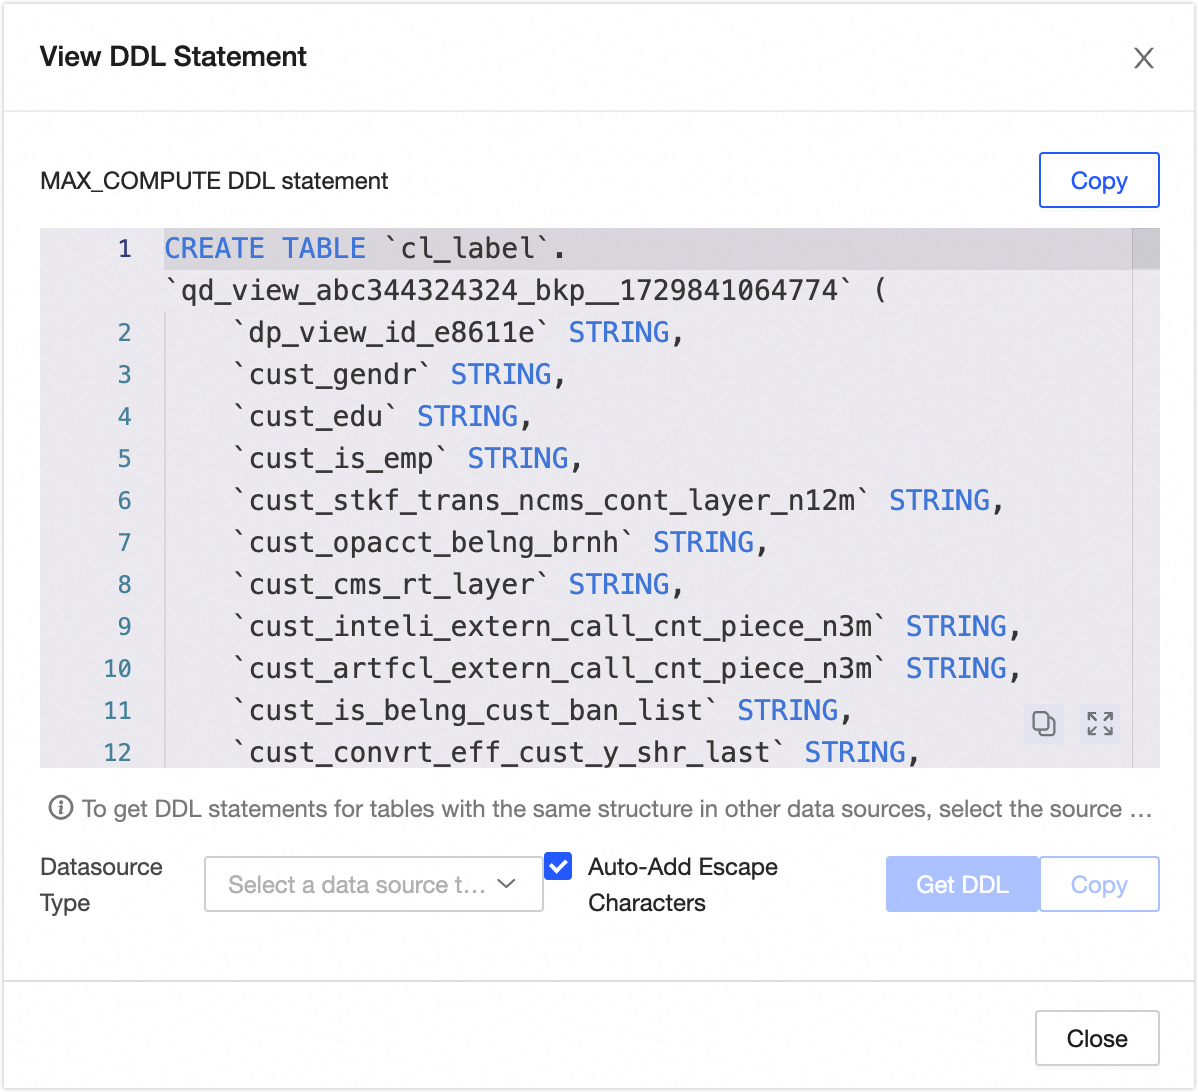
  • View DDL Statement: Click to view the DDL statement corresponding to the current data table in the tenant compute engine. In addition, you can select the Data Source Type and click Generate DDL Statement. The system will generate a table DDL statement with the same structure as the current table in the specified type of data source system. If you select Automatically Add Escape Characters, the generated DDL statement will automatically add corresponding escape characters according to the selected source type, reducing issues such as system keyword mis-escape.

    image

  • Edit Table: Supports jumping to the Development - Table management page to edit the DDL information of the table. For more information, see Create an offline physical table.

  • Export Fields: Export field information in the table in CSV format, making it easy for other developers or business personnel to quickly analyze and use.

  • View Transfer-out Records: Displays the last 100 transfer-out records of the current data table owner.

  • View Permission List: View data table permission information.

  • Refresh Metadata: If the data table is not created through the Dataphin platform, or due to system metadata retrieval latency causing no results when querying new tables, you can click Refresh Metadata to obtain the latest metadata information and refresh the metadata of the specified data table into the Dataphin system.

Note

Analysis platform tables do not support Go Analysis, request permission, feedback quality issues, edit table, view transfer-out records, or view permission list operations.

② Detail information

Displays information about the table, fields, and partitions.

  • Detail: Displays the attribute information of the table, including data block, subject area, project, highest sensitivity level, whether it is a partitioned table, whether it is a manually created table on the analysis platform, storage type, storage format, storage size, lifecycle, and location.

    • Project: The project information to which the current table belongs. Click the project name to jump to the asset details page of the project.

    • Highest sensitivity level: The highest sensitivity level of the current table fields, allowing you to quickly understand the data confidentiality of the current table data. The Data classification levels from low to high are L1, L2, L3, L4 (public to top secret), and custom data classifications.

    • Storage type: The storage type of the current table, including internal table and foreign table.

    • Storage size: The actual storage size of the current table, updated T+1.

    • Lifecycle: The retention time of the current table, in days.

    • Location: Only MaxCompute, Hive type compute source foreign tables, and Hive,Greenplum type data source foreign tables, support viewing the storage address of the current table, for example: hdfs://node01.exp5:8020/user/hive/warehouse.

  • Field Information: Includes field name, description, data type, associated standard (requires purchasing the Data Standard module), data classification (requires purchasing the security module), data classification (requires purchasing the security module), heat information. You can also click the data lineage Actionsimage icon in the column to view the field lineage with the specified field as the central field.

  • Partition Info: You can view the partition information of the data table. Multi-level partitions will be displayed according to the combination results of each level of partition, with different partitions connected by /. For example: ds=20221001/pt1=a/pt2=b. Note: The number of partition records and storage size information are for reference only.

    image

③ Lineage & impact

  • Lineage displays the data lineage between tables and fields.

    • Table-level lineage sources include integration sync tasks, custom lineage compute tasks, and SQL compute tasks and logical table tasks that the system can automatically parse lineage from. For more information, see Table-level lineage.

    • Field lineage sources include custom lineage compute tasks and SQL compute tasks and logical table tasks that the system can automatically parse lineage from. For more information, see Field-level lineage.

      Note

      The system parses the table and field lineage relationships in the development environment when tasks are submitted; it parses the table and field lineage relationships in the production environment when tasks are published. A single task submission or publication supports parsing up to 100,000 lineage relationships. If exceeded, it will not be recorded and cannot be displayed in the asset checklist.

  • Impact is divided into data table impact and integration sync impact.

    • Data table impact: Displays the direct descendant tables that reference the current table and the indirect descendant tables that reference the direct descendant tables. Supports exporting data and displaying only direct descendant tables operations.

      • Export Data: Supports exporting to Excel for business personnel to browse.

      • Display Only Direct Descendant Tables: When selected, only the descendant tables directly affected by the current table are displayed by default. When deselected, all descendant impact tables are displayed, with a maximum of 15 levels (starting from the direct descendant of the current table as the first level).

    • Integration sync impact: Displays the integration sync tasks where the current table and descendant tables are used as source tables. Supports exporting data and displaying only the current table impact operations.

      • Export Data: Supports exporting to Excel for business personnel to browse.

      • Display Only Current Table Impact: When selected, only the integration tasks where the current table is used as an input table are displayed by default. When deselected, the integration tasks where the current table and all descendant impact tables are used as input tables are displayed, with a maximum of 15 levels (starting from the direct descendant of the current table as the first level).

④ Quality overview

If you have enabled the Data Quality feature, it displays an overview of rule verification and a list of quality monitoring rules for the current data table. Click the View Report Details button or the View Rule Details button to quickly jump to the corresponding page in the Data Quality module for more details.

Note

Analysis platform tables do not support viewing quality overviews.

⑤ Data exploration

If you have enabled the Data Quality feature, you can configure data exploration tasks for the data table to quickly understand the data overview, assess data availability and potential threats in advance. If you need to enable automatic exploration, you can enable the corresponding configuration in the Metadata Center > Exploration configuration. For more information, see Create a data exploration task.

⑥ Data preview

If you have the data permission to query the current table, you can use the data preview feature to query only the results corresponding to the fields for which you have select permission and preview the first 50 data entries. For information on how to request permission, see Request, renew, and return table permissions.

You can search or filter the filtered data by field, search, view single row data details, perform automatic column width adjustment and row-column conversion operations. You can also click the sort icon after the field to perform No Sort, Ascending, Descending operations. Double-click the field value to copy the field value with one click.

⑦ Output information

Output tasks include the data write tasks of the object, data lineage automatic parsing or custom configuration tasks with the current table as the output table, and tasks with node output name = project name.table name.

The output task list is updated in near real-time, and the output details are updated T+1.

image.png

  • ① View Output Details: Only supports viewing the output details of recurring tasks. For more information, see Output details.

  • ② Go To Operation: Click the Go To Operation button to jump to the task list page of the Operation Center and filter out the current task for more information.

⑧ Usage instructions

You can add usage instructions for the data table to provide information reference for data browsers and consumers. You can click Add Usage Instructions and fill in the usage instructions title and content to complete the addition. image

⑨ Asset information

Displays detailed information such as the Basic Information, Change Information, and Usage Information of the physical table.

  • Basic information: Includes the environment, table type, creation time, creator, owner, and output tasks of the table.

    • Owner: The current table owner supports transferring the current table owner to other users. In the Transfer Owner dialog box, you can choose whether to synchronize the transfer of the development/production environment table. After selecting the Recipient, click OK to immediately transfer out. It is recommended to synchronize the recipient in a timely manner after the transfer. You can view the transfer information on the transfer-out records page. For more information, see View transfer-out records.

      Note
      • Super administrators can transfer the owner of all table types. The current table owner can transfer the tables they own.

      • Project administrators can transfer the owner of physical tables under the projects they manage.

    • Output Task: You can view the output tasks of the current table, including the data write tasks of the object, data lineage parsing or configuration tasks with the current table as the output table, and tasks with node output name = project name.table name. Click the name of the output task to jump to the operation details page of the data table.

      Note

      Only supports viewing the output details of recurring tasks.

  • Change information: Includes data changes, recent access, and DDL changes.

    • Data Updated At: The last table content change time (corresponding to DML operations) parsed by Dataphin based on SQL. Changes triggered by external systems are not counted. Real-time updates.

    • Last Accessed At: The last select time (corresponding to DQL operations) parsed by Dataphin based on SQL. Access triggered by external systems is not counted. Real-time updates.

    • Last Ddl Time: The last table structure change time (corresponding to DDL operations) parsed by Dataphin based on SQL. Changes triggered by external systems are not counted. Real-time updates.

  • Usage information: Includes the number of favorites, page views, and visits.

    • Number Of Favorites: Displays the number of users who favorited the current table. Real-time updates.

    • Page Views: Displays the page views (PV) of the current data table. Each refresh increases by one. Real-time updates.

    • Visits: Based on SQL parsing, when the table is selected in a Dataphin task (corresponding to DQL operations), it is counted as one visit. T+1 updates. Displays the total number of visits in the last 30 days.

Table-level lineage

The table-level lineage page shows the lineage relationship diagram for integration sync tasks, custom lineage compute tasks, and SQL compute tasks, along with logical table tasks that the system can automatically parse lineage from.

image

Area

Description

Search and quick operation area

  • Search: Supports searching the nodes expanded on the current page based on the table name keyword. Supports clicking the left/right arrows after the search box or using the direction keys on the keyboard to quickly switch the selected nodes. The system defaults to locating the first node hit.

  • Display Only Direct Lineage: Click Filter - Display only direct lineage to display the upstream and downstream related tables with direct lineage relationships of the current table.

    Note
    • Direct lineage is the upstream and downstream related assets read or written through select, insert, and other statements.

    • Associated lineage is the related assets referenced through join, group by, where conditions, and other methods.

    • Table-level lineage will display the corresponding identifier as long as it contains fields with direct lineage.

  • Hide Source Tables: Click Filter - Hide source tables to hide table objects from data sources and their downstream.

  • Hide Deleted Tables: Click Filter - Hide deleted tables. Lineage is parsed when tasks are submitted and published. In special cases, if the data table is not deleted through Dataphin scheduling tasks (such as deleted through ad hoc queries or directly on the engine side), it will not trigger lineage updates and will still be displayed in the lineage diagram. When selected, table objects that have been deleted or not yet collected will not be displayed.

Legend area

The data tables supported by table-level lineage include Physical Table, Logical Dimension Table, Logical Fact Table, Logical Summary Table, Logical Tag Table, View, Materialized View, Logical View, Meta Table, Mirror Table, Datasource Table.

Lineage diagram display area

Displays the complete event chain diagram. You can manually expand multiple levels of upstream or downstream. Supports fuzzy search based on data table name keywords.

  • Central node: Displays the name of the current asset and uses Current Table to identify it in the upper left corner of the node.

  • Other nodes: Click a node with the mouse to highlight the upstream and downstream related lineage relationships of the node.

  • Fields within the table: Hover over the node with the mouse and click the right drop-down arrow to support fuzzy search by field name. Click the field name to jump to the asset details page to view the lineage relationship.

  • Node connection: If there is a circular dependency (such as one field in the table depending on another field), it will be marked with a dashed line.

Object details area

Hover over the table with the mouse to display the details of the table.

Source table: Displays the Name, File Format, Storage File Format, Data Source, and Lineage Source of the table.

Dataphin data table: Displays the Name, File Format, Storage File Format, Block of logical tables and logical views / Project of physical tables and physical views, Owner, Storage Size, Lifecycle (Hadoop cluster compute engines do not support displaying this information), Description, and Lineage Source information. You can also perform View Lineage, View DDL, and Request Permission operations.

  • View Lineage: Click to quickly view the table-level lineage of the table.

  • View DDL Statement: When the data table is a physical table, physical view, or mirror table, you can click to view the DDL statement of the table.

  • Request Permission: Click to quickly jump to the table permission request page for the table.

Field-level lineage

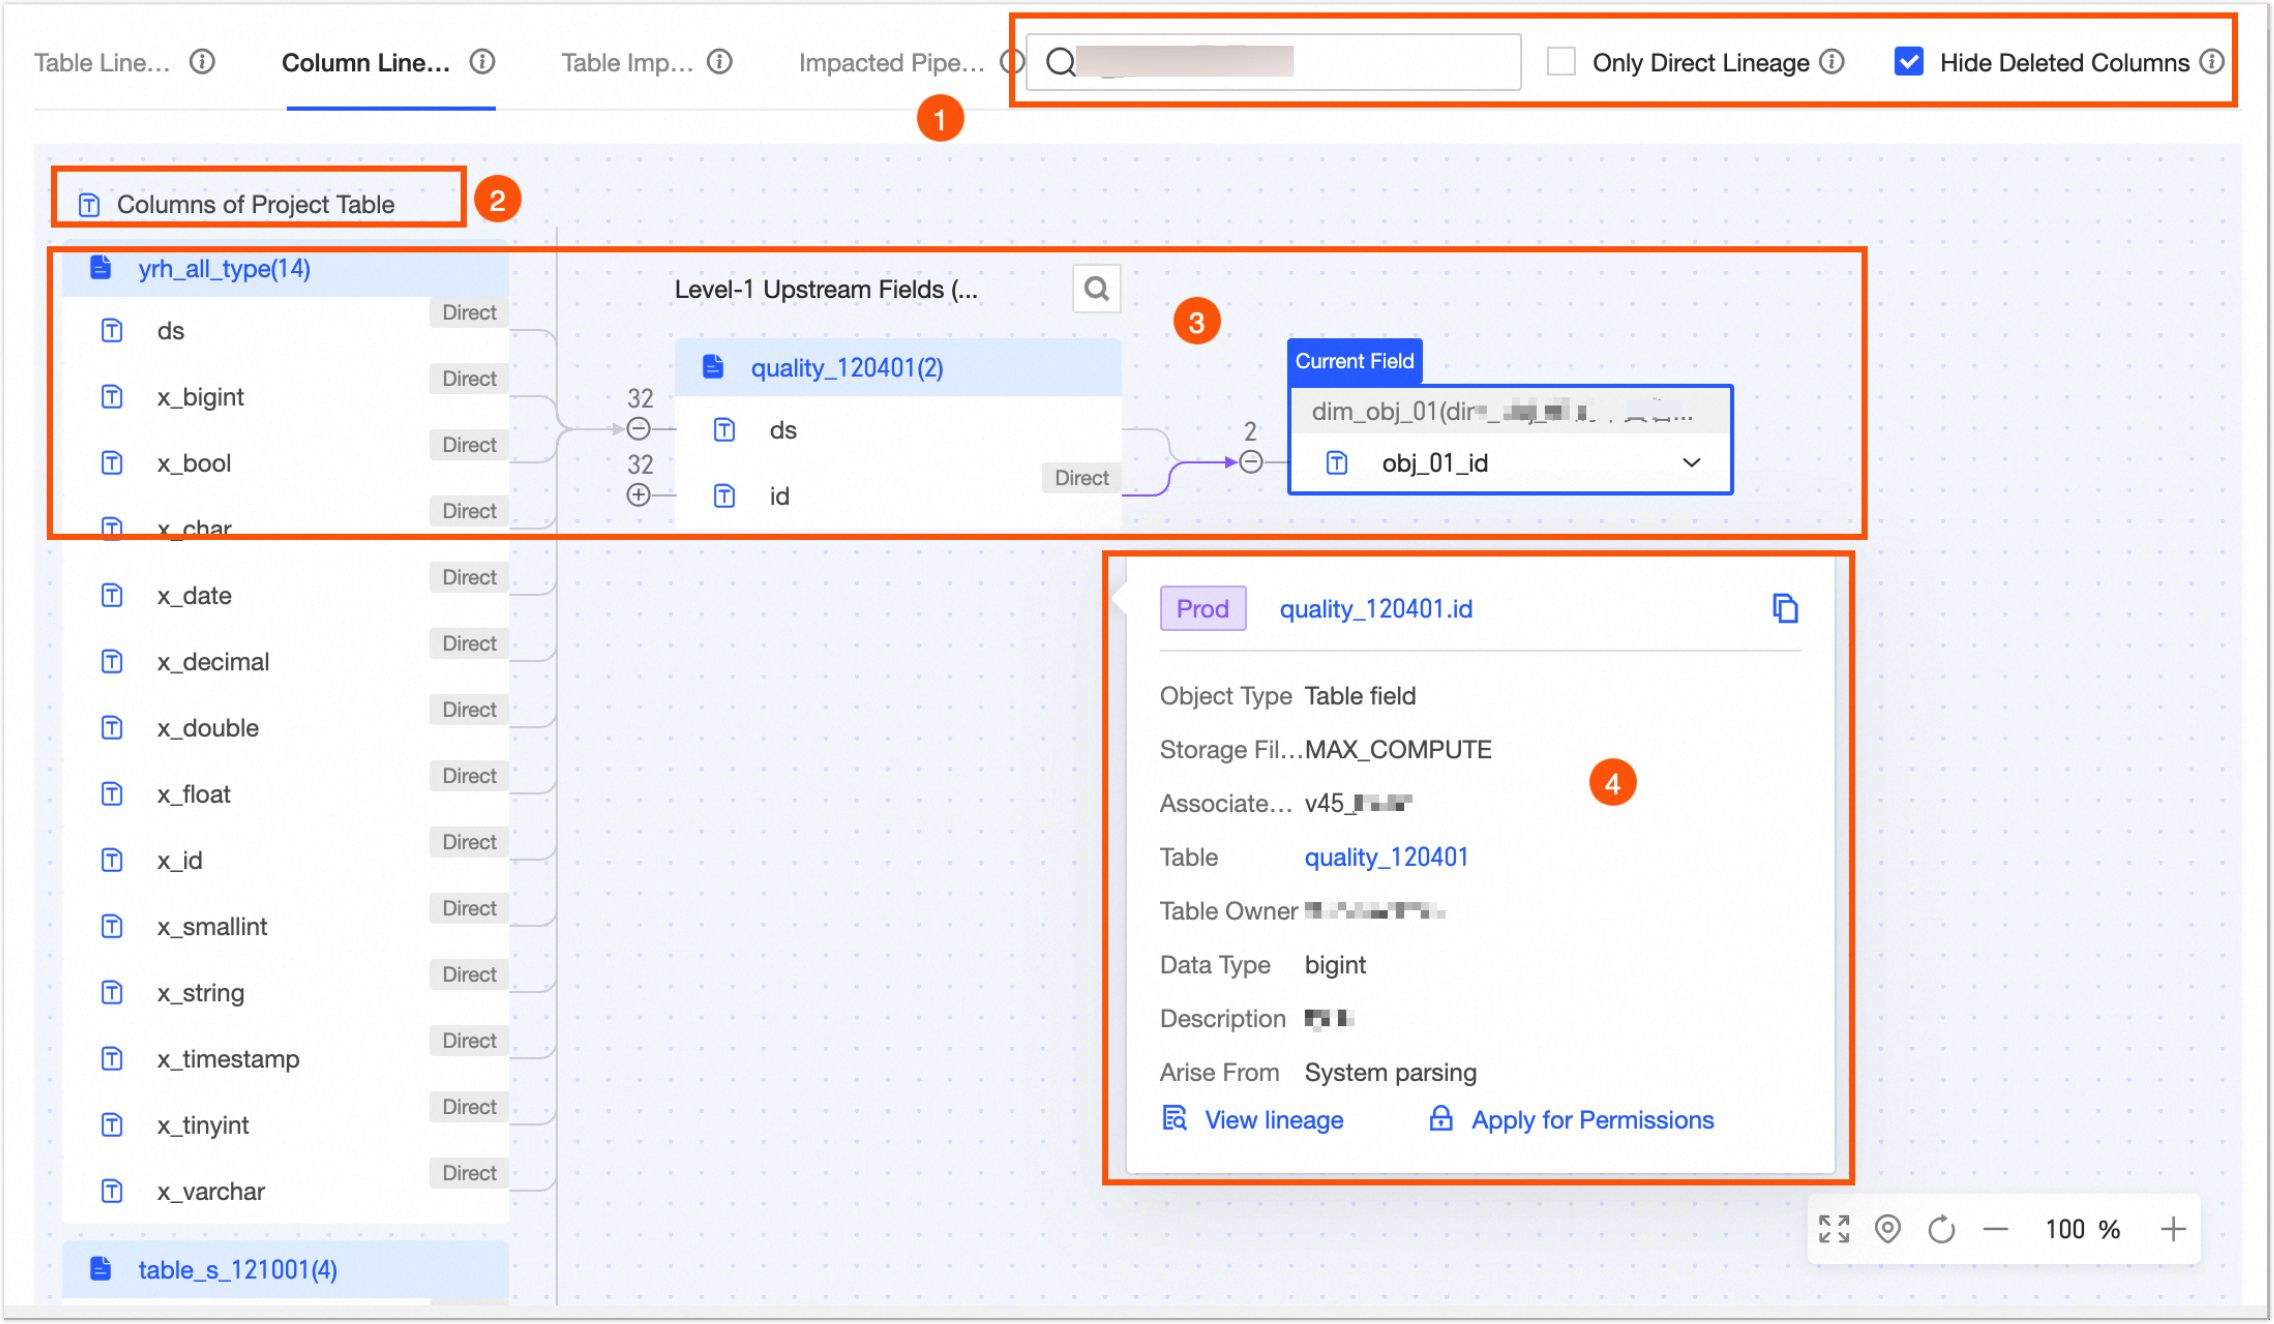
The field lineage page shows the lineage relationship diagram for custom lineage compute tasks, SQL compute tasks, and logical table tasks that the system can automatically parse lineage from.

image

Area

Description

Search and quick operation area

  • Search: Supports searching the nodes expanded on the current page based on the field name keyword. Supports clicking the left/right arrows after the search box to switch the nodes hit. The system defaults to locating the first node hit.

  • Display Only Direct Lineage: When selected, only the upstream and downstream related fields with direct lineage relationships of the current field are displayed.

    Note
    • Direct lineage is the upstream and downstream related assets read or written through select, insert, and other statements. Specially, when processing the calculation logic of fields through the where condition in the filter component or using built-in functions in the field calculation component, the field lineage diagram will display as direct lineage.

    • Associated lineage is the related assets referenced through join, group by, where conditions, and other methods.

  • Hide Deleted Fields: Lineage is parsed when tasks are submitted and published. In special cases, if the data table is not deleted through Dataphin scheduling tasks (such as deleted through ad hoc queries or directly on the engine side), it will not trigger lineage updates and will still be displayed in the lineage diagram. When selected, deleted table objects will not be displayed.

Legend area

The fields supported by field lineage include Compute Source Table Fields and Data Source Table Fields.

Lineage diagram display area

Displays the complete event chain diagram. You can manually expand multiple levels of upstream or downstream. Supports fuzzy search based on field name keywords. Specially, if there is a circular dependency, it cannot be expanded further, and you need to continue viewing downstream from the starting node.

Central node: Displays the current field and the name of the table it belongs to, and uses Current Field to identify it in the upper left corner of the node. Supports fuzzy search by field keyword to switch and view different field lineage diagrams.

Object details area

Hover over the field with the mouse to display the Name, File Format, Storage File Format, Block of logical tables and logical views / Project of physical tables and physical views, Table, Table Owner, Data Type, Description, and Lineage Source information of the field. You can also perform View Lineage and Request Permission operations.

  • View Lineage: Click to quickly view the field lineage of the field.

  • Request Permission: Click to quickly jump to the table permission request page for the table where the field is located.

Output details

You can view the output tasks for the data table, which include data write tasks for the object, data lineage parsing or configuration tasks with the current table as the output table, and tasks where the node output name equals the project name.table name.

image

Area

Description

Taskdetails

Displays the Node Name, Task ID, Block, and Owner information.

Recurring instance

Displays the Average Start Time, Average Output Time, and Average Running Duration information.

  • Average Start Time: Statistics of the average start time of the first run of all normally scheduled recurring instances in the last 15 days. T+1 updates.

  • Average Output Time: Statistics of the average end time of the first successful run of all normally scheduled recurring instances in the last 15 days. Re-run scenarios are not included in the statistics. T+1 updates.

  • Average Running Duration: Statistics of the average running duration of all successful run records of all normally scheduled recurring instances in the last 15 days. The average running duration statistics of script tasks include re-run scenarios, while the average running duration statistics of logical table tasks do not include re-run scenarios. T+1 updates.

    Note

    Hour and minute instances support viewing running details by cycle, based on the cycle interval divided by the latest scheduling configuration of the current task, and calculate the average value of historical instances with the same scheduled time.

Running details

Displays the Data Timestamp, Status, Scheduled Time, Start Time, End Time, and Running Duration information. You can also perform View Instance and View Log operations in the Actions column.

  • View Instance: Click the View Instance button. In the Recurring Instance list, you can view and manage tasks. For more information, see View and manage script instances.

  • View Log: You can view the running log details of the instance task.

Field details

This section displays the details of the data table where the current field is located. For more information, see Physical Table Details.