Container Intelligence Service provides the pod diagnostics feature to help you diagnose pods. This topic describes the pod diagnostic items and the solutions on how to fix pod issues.
Container Intelligence Service develops a diagnostics system based on expert experience and trains an AI-assisted diagnostics model. The pod diagnostics feature helps locate the root cause of issues. Pod diagnostics includes diagnostic items and root cause.
Diagnostic items: includes pod, node, node component, cluster component, and Elastic Compute Service (ECS) controller manager diagnostics.
Root cause: locates the root cause of issues and provides suggestions on how to fix the issues. The pod diagnostics feature collects information about clusters and nodes, identifies anomalies, and then performs in-depth diagnostics.
When you use the pod diagnostics feature, ACK runs a data collection program on each node in the cluster to collect diagnostic results. The collected information includes the system version, the status of workloads, Docker, and kubelet, and the key error information in system logs. The data collection program does not collect business information or sensitive data.
Scenarios
The following table describes the scenarios of pod diagnostics and AI-assisted diagnostics.
Category | Scenario |
Pod diagnostics | Pods are not processed by the scheduler. |
Pods cannot be scheduled because they do not meet the requirements of the constraints for scheduling. | |
Pods are scheduled but are not processed by the kubelet. | |
Pods are waiting for the volumes to reach the Ready state. | |
Pods are evicted. | |
Pods are evicted due to insufficient disk space. | |
Pods are evicted due to insufficient memory space on the node. | |
Pods are evicted due to insufficient disk indexes. | |
Sandboxed containers in pods fail to be created. | |
Pods remain in the Terminating state. | |
Out-of-memory (OOM) errors occur on containers in pods. | |
Containers in pods exceptionally exit. | |
Containers in pods remain in the CrashLoopBackOff state. | |
Containers in pods are not ready. | |
Pods fail to pull container images. | |
Timeout errors occur when pods pull container images. | |
AI-assisted diagnostics | The status of pods is abnormal. |
OOM errors occur on pods. | |
Containers in pods exceptionally exit. | |
The configuration of the ConfigMaps or Secrets of pods is invalid. | |
Pods fail to pass health checks. | |
The configuration of the persistent volume claims (PVCs) of pods is invalid. | |
Errors occur when pods pull container images. |
Procedure
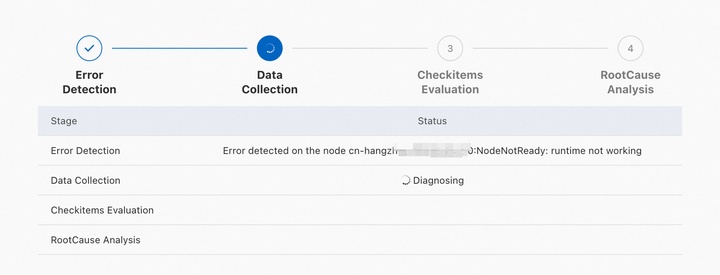
The cluster diagnostics feature collects information about clusters and nodes, identifies anomalies, and then performs in-depth diagnostics. The expert mode and AI mode are used to help locate the root cause of issues. Diagnostic results are generated through the following steps: anomaly identification, data collection, diagnostic item check, and root cause analysis.
Anomaly identification: collects basic data, such as node status, pod status, and cluster event streams, and analyzes the anomalies based on the collected data.
Data collection: collects and diagnoses context-related data based on the results of anomaly identification. For example, ACK collects node information in Kubernetes, ECS information, Docker process status, and kubelet process status.
Diagnostic item check: checks whether key metrics are normal based on the collected data. For example, the node diagnostic items include the Docker process status and ECS status. Node diagnostics are classified into multiple categories. ACK lists the diagnostic items of different categories and provides the description of each diagnostic item.
Root cause analysis: analyzes the root cause of issues based on the collected data and the check results of diagnostic items.
Diagnostic results
The diagnostic results include the results of root cause analysis and the results of diagnostic item check. The results of root cause analysis include detected anomalies, root cause, suggestions for fixes. The results of diagnostic item check include the check results of each diagnostic item. Diagnostic item check is used to locate the cause that may not be identified by root cause analysis.
The diagnostic items may vary based on the cluster configuration. The actual diagnostic items on the diagnostic page shall prevail.
Pod diagnostic items
Category | Description |
Diagnoses common pod issues, including pod status, image pulling, and network connectivity. | |
Diagnoses common node issues, including node status, network status, kernel logs, kernel processes, and service availability. | |
Diagnoses the status of key node components, including the network and volume components. | |
Diagnoses common cluster issues, including the availability of the API server and DNS service and the status of the NAT gateway. | |
Diagnoses common ECS instance issues, including the status of ECS instances, network connections, operating system, and disk I/O. |
Pod
Diagnostic item | Description | Solution |
Number of container restarts | Indicates the number of times that the containers in a pod restart. |
Check the status and log of the pod. For more information, see Pod troubleshooting. |
Container image download failures | Check whether the other pods on the node of the current pod fail to download the container image. | |
Validity of Secrets used by pods to pull container images | Check the validity of the Secrets used by pods to pull container images. | |
Connectivity between pods and CoreDNS pods | Check the connectivity between the pods and the CoreDNS pods. | Check the connectivity between the pods and the CoreDNS pods. |
Connectivity between pods and CoreDNS Service | Check the connectivity between the pods and the CoreDNS Service. | |
Connectivity between pods and DNS server in the host network | Check the connectivity between the pods and the DNS server in the host network. | Check the connectivity between the pods and the DNS server in the host network. |
D status of container processes in pods | Check whether container processes in pods are in the D state. | In most cases, container processes are waiting on disk I/O if the container processes are in the D state. Restart the corresponding ECS instance to resolve this issue. If the issue persists, submit a ticket. |
Pod initialization | Check whether pods are initialized. | Check the status and log of the pod. For more information, see Pod troubleshooting. |
Pod scheduling | Check whether pods are scheduled. | Check the status and log of the pod. For more information, see Pod troubleshooting. |
Node
If the following issues persist after you adopt the solutions described in the following table, collect the node logs and then submit a ticket.
Diagnostic item | Description | Solution |
Connectivity errors to the Kubernetes API server | Checks whether the node can connect to the Kubernetes API server of the cluster. | Check the configurations of the cluster. For more information, see Troubleshoot ACK clusters. |
AUFS mount hangs | Checks whether AUFS mount hangs occur. | |
BufferIOError errors | Checks whether BufferIOError errors occur in the node kernel. | |
Cgroup leaks | Checks whether cgroup leaks occur on the node. | Cgroup leaks may interrupt monitoring data collection and lead to container startup failures. Log on to the node and delete the cgroup directory. |
Abnormal chronyd process status | Checks whether the chronyd process on the node is in an abnormal state. If the chronyd process on the node is in an abnormal state, system clock synchronization may be affected. | If the chronyd process on the node is in an abnormal state, system clock synchronization may be affected. Run the |
Image pulling by containerd | Checks whether the containerd runtime can pull images as expected. | Check the configurations of the node network and images. |
Containerd status | Checks the status of the containerd runtime. | |
CoreDNS pod availability | Checks whether the node can access the IP address of the CoreDNS pod. | Check whether the node can access the IP address of the CoreDNS pod. For more information, see What do I do if the DNS query load is not balanced among CoreDNS pods?. |
Image status | Checks whether images are damaged. | |
Overlay2 status of images | Checks whether the overlay2 file system in images is damaged. | If the overlay2 file system in images is damaged. |
System time | Checks whether the system time is correct. | None. |
Docker container startup | Checks whether Docker containers fail to be started. | |
Docker image pulling | Checks whether the node can pull Docker images as expected. | Check the configurations of the node network and images. |
Docker status | Checks the status of Docker. | |
Docker startup time | Checks the startup time of Dockerd. | None. |
Docker hang errors | Checks whether Docker hang errors occur on the node. | Run the |
ECS instance existence | Checks whether the ECS instance exists. | Check the status of the ECS instance. For more information, see FAQ about nodes and node pools. |
ECS instance status | Checks the ECS instance status. | Check the ECS instance status. For more information, see FAQ about nodes and node pools. |
Ext4FsError errors | Checks whether Ext4FsError errors occur in the node kernel. | |
Read-only node file system | In most cases, the node file system becomes read-only due to disk failures. You cannot write data to a read-only node file system and your business may be affected. | Use the fsck command to repair the node file system and then restart the node. |
Hardware time | Check the consistency between the hardware time and system time. If the difference between the hardware time and system time is longer than 2 minutes, component errors may occur. | Run the |
DNS | Checks whether domain names can be resolved on the node. | Checks whether domain names can be resolved on the node. For more information, see DNS troubleshooting. |
Kernel oops errors | Checks whether oops errors exist in the node kernel. | |
Kernel versions | Checks whether the kernel version is outdated. An outdated kernel version may lead to system failures. | Update the node kernel. For more information, see FAQ about nodes and node pools. |
DNS availability | Checks whether the node can access the cluster IP address of the kube-dns Service to use the DNS service provided by the cluster. | Check the status and logs of CoreDNS pods. For more information, see DNS troubleshooting. |
Kubelet status | Checks the kubelet status. | Checks the kubelet logs. For more information, see Troubleshoot ACK clusters. |
Kubelet startup time | Checks the startup time of kubelet. | None. |
CPU utilization | Checks whether the CPU utilization of the node is excessively high. | None. |
Memory utilization | Checks whether the memory utilization of the node is excessively high. | None. |
Memory fragmentation | Checks whether memory fragments exist on the node. | If memory fragments exist on the node, log on to the node and run the |
Swap memory | Checks whether swap memory is enabled for the node. | Swap memory cannot be enabled. Log on to the node and disable swap memory. |
Loading of network device drivers | Checks the loading of VirtIO drivers on network devices. | Errors occur during the loading of VirtIO drivers on network devices. |
Excessively high CPU utilization of the node | Checks the CPU utilization of the node within the last week. If the CPU utilization of the node is high and a large number of pods are scheduled to the node, the pods compete for resources. This increases CPU utilization and may result in service interruptions. | To avoid service interruptions, set resource requests and limits to proper values to avoid running an excessively large number of pods on the node. |
Private node IP existence | Checks whether the private node IP address exists. | If the private node IP address does not exist, remove the node and add the node to the cluster again. Do not release the ECS instance when you remove the node. For more information about how to remove a node from a cluster, see Remove a node. For more information about how to add a node to a cluster, see Add existing ECS instances. |
Excessively high memory utilization of the node | Checks the memory utilization of the node within the last week. If the memory utilization of the node is high and a large number of pods are scheduled to the node, the pods compete for resources. This increases memory utilization, leads to out of memory (OOM) errors, and may result in service interruptions. | To avoid service interruptions, set resource requests and limits to proper values to avoid running an excessively large number of pods on the node. |
Node status | Checks whether the node is in the Ready state. | Restart the node. For more information, see FAQ about nodes and node pools. |
Node schedulability | Checks whether the node is unschedulable. | If the node is unschedulable, check the scheduling configuration of the node. For more information, see Node draining and scheduling status. |
OOM errors | Checks whether OOM errors occur on the node. | |
Runtime check | Checks whether the runtime of the node is the same as the runtime of the cluster. | For more information, see Can I change the container runtime of a cluster from containerd to Docker?. |
Outdated OS versions | Checks whether the OS version used by the node has known bugs, and whether the OS version used by the node is outdated and has stability issues. The preceding issues may cause the Docker and containerd components to malfunction. | Update the OS version. |
Internet access | Checks whether the node can access the Internet. | Check whether SNAT is enabled for the cluster. For more information, see Enable an existing ACK cluster to access the Internet. |
RCUStallError errors | Checks whether RCUStallError errors occur in the node kernel. | |
OS versions | Checks the OS version used by the node. If an outdated OS version is used by the node, the cluster may not run as normal. | None. |
Runc process leaks | If runc process leaks occur on the node, the node may periodically enter the NotReady state. | If runc process leaks occur, check the leaked runc process and manually terminate the processes. |
SoftLockupError errors | Checks whether SoftLockupError errors occur in the node kernel. | |
Systemd hangs | Checks whether systemd hangs occur on the node. | If systemd hangs occur on the node, log on to the node and run the |
Outdated systemd versions | Checks whether the systemd version used by the node has known bugs. Outdated systemd versions have stability issues that can cause the Docker and containerd components to malfunction. | Update the systemd version. For more information, see systemd. |
Hung processes | Checks whether hung processes exist on the node. | |
unregister_netdevice errors | Checks whether unregister_netdevice errors occur in the node kernel. |
NodeComponent
Diagnostic item | Description | Solution |
CNI component status | Checks whether the Container Network Interface (CNI) plug-in runs as expected. | Check the status of the network component used by the cluster. For more information, see FAQ about network management. |
CSI component status | Checks whether the Container Storage Interface (CNI) plug-in runs as expected. | Check the status of the volume component used by the cluster. For more information, see FAQ about CSI. |
ClusterComponent
Diagnostic item | Description | Solution |
aliyun-acr-credential-helper version | Checks whether the aliyun-acr-credential-helper version used by the cluster is outdated. | If the aliyun-acr-credential-helper version used by the cluster is outdated, update aliyun-acr-credential-helper. For more information, see Use the aliyun-acr-credential-helper component to pull images without using a secret. |
API Service availability | Checks whether the API Service of the cluster is available. | Run the |
Insufficient available pod CIDR blocks | Checks whether the number of available pod CIDR blocks in the cluster that has Flannel installed is less than five. Each node in a cluster is attached to a pod CIDR block. If all pod CIDR blocks are used, the new nodes that you add to the cluster cannot work as expected. | |
CoreDNS endpoints | Checks the number of CoreDNS endpoints. | Check the status and logs of CoreDNS pods. For more information, see DNS troubleshooting. |
CoreDNS cluster IP addresses | Checks whether cluster IP addresses are allocated to CoreDNS pods. If cluster IP addresses are not allocated to CoreDNS pods, service interruptions may occur. | Check the status and logs of CoreDNS pods. For more information, see DNS troubleshooting. |
NAT gateway status | Checks the status of the NAT gateway used by the cluster. | Log on to the NAT Gateway console to check whether the NAT gateway is locked due to overdue payments. |
Excessively high rate of concurrent connection drops on the NAT gateway | Checks whether the rate at which concurrent connections are dropped on the NAT gateway is high. | If the rate is high, upgrade the NAT gateway. For more information, see FAQ about upgrading standard Internet NAT gateways to enhanced Internet NAT gateways. |
ECSControllerManager
Diagnostic item | Description | Solution |
Overdue payments related to ECS instance components | Checks whether the disk or network bandwidth of the ECS instance is unavailable due to overdue payments within your account. | If the disk or network bandwidth of the ECS instance is unavailable due to overdue payments within your account, top up your account. |
Overdue payments related to the ECS instance | Checks whether the pay-as-you-go ECS instance is suspended due to overdue payments. | If the pay-as-you-go ECS instance is suspended due to overdue payments, you must first top up your account and then restart the instance. |
ECS instance NIC status | Checks whether the NIC of the ECS instance works as expected. | If the NIC of the ECS instance does not work as expected, restart the instance. |
ECS instance startup status | Checks whether the boot operation can be performed on the instance as normal. | If the boot operation cannot be performed on the instance as normal, you must create another instance. |
Status of ECS instance backend management system | Checks whether the backend management system of the ECS instance works expected. | If the backend management system of the ECS instance does not work as expected, restart the instance. |
Status of ECS instance CPUs | Checks whether CPU contention or CPU binding failures occur at the underlying layer of the ECS instance. | If CPU contention exists, the instance may fail to obtain CPUs or may encounter other issues. Restart the instance. |
Split locks in the CPUs of the ECS instance | Checks whether split locks occur in the CPUs of the ECS instance. | Split locks occur in the CPUs of the ECS instance. For more information, see Detecting and handling split locks. |
Status of DDos mitigation for the ECS instance | Checks whether the public IP address of the instance suffers from DDoS attacks. | If the IP address of the ECS instance suffers from DDoS attacks, purchase other anti-DDoS services. For more information, see Comparison of Alibaba Cloud Anti-DDoS solutions. |
Limited read/write capabilities of the cloud disk | Checks whether the read/write capabilities of the cloud disk are limited. | If the maximum read and write IOPS of the disk has been reached, the read and write operations on the disk are limited. For more information about how to view disk metrics, see Block storage performance. |
Loading of the ECS instance disk | Checks whether the cloud disk can be attached to the ECS instance when the instance is started. | If the instance fails to be started because the cloud disk fails to be attached to the instance. Stop the instance and then start the instance again. |
ECS instance expiration | Check whether the subscription of the instance has expired. | If the ECS instance has expired, renew the instance. For more information, see Renew a subscription instance. |
ECS instance OS crashes | Checks whether OS crashes occur on the ECS instance. | If OS crashes occur on the ECS instance within the last 48 hours, troubleshoot the system logs to identify the cause. For more information, see View system logs and screenshots. |
Status of the ECS instance host | Checks whether failures occur on the physical server on which the ECS instance is deployed. | If failures occur on the physical server on which the ECS instance is deployed, the instance may be in an abnormal state and the instance performance is downgraded. Restart the instance. |
Loading of the ECS instance image | Checks whether ECS instance can load the image when the system initializes the instance. | The ECS instance failed to load the image due to issues related to the system and image. Restart the instance. |
I/O hangs on the ECS instance disk | Checks whether I/O hangs occur on the system disk of the ECS instance. | If I/O hangs occur on the system disk of the ECS instance, check the disk metrics. For more information, see View the monitoring data of a cloud disk. For information about how to troubleshoot I/O hangs on Alibaba Cloud Linux 2, see Detect I/O hangs of file systems and block layers. |
ECS instance bandwidth upper limit | Checks whether the total bandwidth of the ECS instance has reached the maximum bandwidth allowed for the instance type. | If the total bandwidth of the ECS instance has reached the maximum bandwidth allowed for the instance type, upgrade the instance to an instance type that provides higher bandwidth capabilities. For more information, see Overview of instance configuration changes. |
Upper limit of the burst bandwidth of the ECS instance | Checks whether the burst bandwidth of the instance exceeds the upper limit of burst bandwidth allowed for the instance type. | If the burst bandwidth of the instance exceeds the upper limit of burst bandwidth allowed for the instance type, upgrade the instance to an instance type that provides higher bandwidth. For more information, see Overview of instance configuration changes. |
Loading of the ECS instance NIC. | Checks whether the NIC of the ECS instance can be loaded. | If the NIC cannot be loaded, the network connectivity of the instance is affected. Restart the instance. |
NIC session establishment on the ECS instance | Checks whether sessions can be established to the NIC of the ECS instance. | If sessions cannot be established to the NIC or if the maximum number of sessions supported by the NIC is reached, the network connectivity or throughput of the instance is affected. Restart the instance. |
Key operations on the ECS instance | Checks whether the operations that you recently performed on the instance succeeded. These operations include starting and stopping the instance and upgrading the configurations of the instance. | If the operations that you recently performed on the instance failed, perform the operations again. |
Packet loss on the ECS instance NIC | Checks whether inbound or outbound packet loss occurs on the NIC of the ECS instance. | If inbound or outbound packet loss occurs on the NIC of the ECS instance, restart the instance. |
ECS instance performance degradation | Checks whether the performance of the instance is temporarily degraded due to issues in the software or hardware. | If the performance of the instance is degraded, the time when the performance is degraded is displayed. You can view the historical events or system logs of the instance to identify the cause of the performance degradation. For more information, see View historical system events. |
Compromised ECS instance performance | Checks whether the performance of the ECS instance is compromised. | The ECS instance can provide only the baseline performance due to insufficient available CPU credits. |
ECS instance disk resizing | Checks whether the disk of the ECS instance is resized. | After the disk is resized, the operating system cannot resize the file system. If the disk cannot be used after it is resized, resize the disk again. |
ECS instance resource application | Checks whether the physical resources, including CPU and memory resources, required by the ECS instance are sufficient. | If the physical resources required by the ECS instance are insufficient, the instance cannot be started. Wait a few minutes and start the instance again. You can also create an ECS instance in another region. |
ECS instance OS status | Checks whether kernel panics, OOM errors, or internal failures occur in the OS of the ECS instance. | These faults may be caused by improper configurations of the instance or user programs in the OS of the instance. Restart the instance. |
ECS instance virtualization status | Checks whether exceptions exist in the core services at the underlying virtualization layer of the instance. | If exceptions exist, the instance may not respond or may be unexpectedly suspended. Restart the instance. |