Malicious attacks or traffic abuse against your domain name can cause sudden bandwidth spikes, resulting in unexpectedly high bills. Because the resulting bills cannot be waived or refunded, this document outlines best practices to mitigate these risks.
Mitigate immediate losses
If your domain name experiences malicious attacks or traffic abuse resulting in high bills, take immediate action to mitigate losses. First, configure a bandwidth cap and enable traffic throttling for individual requests. After implementing these controls, you can analyze your logs to configure more targeted security settings.
Bandwidth usage
Downstream speed
Analyze the cause
Check billing details for abnormal traffic
You can view the billing details of cloud services on the Billing Details tab. Select a statistical dimension and a statistical period to view reports based on different dimensions. For more information, see Billing details.
Set Statistical Period to By Detail and Product to Alibaba Cloud CDN. Review the bill carefully for unusual increases in traffic and bandwidth to identify the abnormal traffic periods. For more information, see Bill Query.
If you have purchased a CDN resource plan, also check the plan status: on the Resource Plans page of the CDN console, review the remaining quota and expiration time to determine whether the plan has expired or has been used up. After a resource plan expires or is exhausted, subsequent traffic is settled on a pay-as-you-go basis, which can also cause a noticeable increase in your bill. For more information, see Resource plan management. Note that a newly purchased resource plan applies only to traffic generated after the purchase and cannot offset charges that have already been billed. For more information, see Resource plan deduction rules.
Examine log files for abnormal traffic
Basic query: offline logs
Download offline logs to view access logs for the relevant time period. Analyze the HTTP request details to identify suspicious IP addresses, User-Agents, and more. Offline logs contain limited data fields. If you want to view more data, use the real-time logs feature.
CDN logs record only basic access information, including the access time, client IP address, requested URL, User-Agent, Referer, response size, HTTP status code, and cache status. These fields cannot directly determine whether a request originates from a scraping tool or a regular browser. Although the User-Agent field can indicate the client type, it can be forged and is therefore not a reliable basis for judgment. You can analyze high-frequency IP addresses, abnormal User-Agents, and access behavior patterns to indirectly identify suspicious traffic, but you cannot confirm the specific access method or intent from the logs alone.
Use command-line tools to quickly parse the offline log files and extract information such as the top 10 IP addresses or User-Agents by request volume. For details, see Analyze offline logs.
Traffic quota exhausted early with no abnormal daily average
If more than half of your monthly traffic quota is consumed in less than a month, but the daily average traffic shows no noticeable abnormal peaks, use the following steps to investigate:
In the CDN console, choose Statistics & Analytics > Operations Report > Hot URL. Check the traffic share of each URL and identify whether large files, such as MP4 videos, are consuming a disproportionate amount of traffic.
Choose Operations Report > Top Client IP. Check the IP ranges with the highest request volume and identify whether search engine crawlers, such as Baiduspider, are generating large volumes of requests.
Choose Log Management > Offline Logs. Download the raw access logs by domain name and date, and then analyze the User-Agent distribution to quantify the share of crawler traffic.
If a large file is consuming excessive traffic, replace the video with an image or reduce the video bitrate to lower traffic consumption at the source.
If traffic from a specific IP range is abnormal, configure an IP blacklist in Edge Security to block it.
NoteBlocking the IP range may affect legitimate users.
If the traffic consumption reflects normal business demand, purchase a traffic resource plan on the Resource Plan Management page to increase your quota.
In Usage Query, monitor the traffic quota consumption rate and configure traffic alerts to receive early warnings.
Advanced query: operation reports and real-time logs
You must customize operation reports to enable statistical analysis. If you have already configured real-time log delivery or subscribed to operation reports, you can view historical log data. Operation reports are a free, built-in feature of Alibaba Cloud CDN.
To generate real-time logs, you must first enable Log Service (SLS) and ensure logs are delivered successfully. This is a paid feature. For pricing details, see Pricing Details.
You must configure both real-time logs and operation reports in advance. If you did not configure these features before the high charges occurred, you can use only offline logs for historical analysis.
Resolve the issue
After obtaining log or report data, analyze its characteristics to identify the attack type. You can typically extract features by analyzing key metrics such as Top IP, Top User-Agent, and Top Referer.
Block suspicious IP addresses
To restrict access from suspicious IP addresses, configure an IP blocklist. Analyze your logs to identify suspicious IP addresses and add them to this list. For detailed instructions, see Configure IP Blocklist/Whitelist.
IP blocklisting is effective when attackers use a fixed set of IP addresses. However, if attackers continuously rotate IP addresses to bypass the blocklist, static IP blocking alone cannot prevent ongoing traffic abuse. In such cases, refer to the Upgrade to ESA and enable WAF and bot protection section below for a more comprehensive protection solution.
Filter suspicious User-Agents
Attackers send large volumes of requests with a spoofed User-Agent header to bypass security checks. A spoofed User-Agent can be an empty value, a random string, or a forged string that mimics a common browser. You can configure a User-Agent whitelist or blocklist to reject requests with abnormal User-Agents. For example, to reject requests with an empty User-Agent or a non-compliant random string, you can use the parameters this-is-empty-ua and RandomString respectively. For detailed instructions, see Configure UA Blocklist/Whitelist.
Block suspicious referers
Attackers spoof the Referer header in requests to impersonate legitimate sources and send malicious requests. Configure a Referer blocklist or whitelist to allow access from legitimate referers, prevent unauthorized third-party websites from hotlinking your resources, and reject requests with malicious Referer values. In the Rules input field, enter the abnormal Referer values that you found in the logs. We recommend selecting the Ignore Scheme option. For detailed instructions, see Configure Referer Blocklist/Whitelist.
Upgrade to ESA and enable WAF and bot protection
If attackers continuously rotate IP addresses to bypass the IP blocklist, static IP blocking alone cannot effectively prevent traffic abuse. In such cases, we recommend migrating your domain name to ESA. ESA provides a rich set of protection features, including WAF protection, DDoS protection, and traffic abuse prevention, which not only secure your data but also improve access speed and user experience. You can quickly migrate your domain name by using the CDN, DCDN, and ESA: Feature comparison guide. Then, follow the guide below to enable the security features of ESA.
WAF
ESA WAF provides a wide range of rule-matching and blocking capabilities, including IP access rules, whitelist rules, and custom rules, to prevent attacks and protect your core business data.
Configure an IP access rule
In the ESA console, go to Websites and click your target website in the Website column.
On the website details page, choose .
To define a rule, select a match type, such as IP/CIDR Block, ASN, or Region, enter a value, select an Action, and then click Create Rule. Supported action types are listed in Actions.
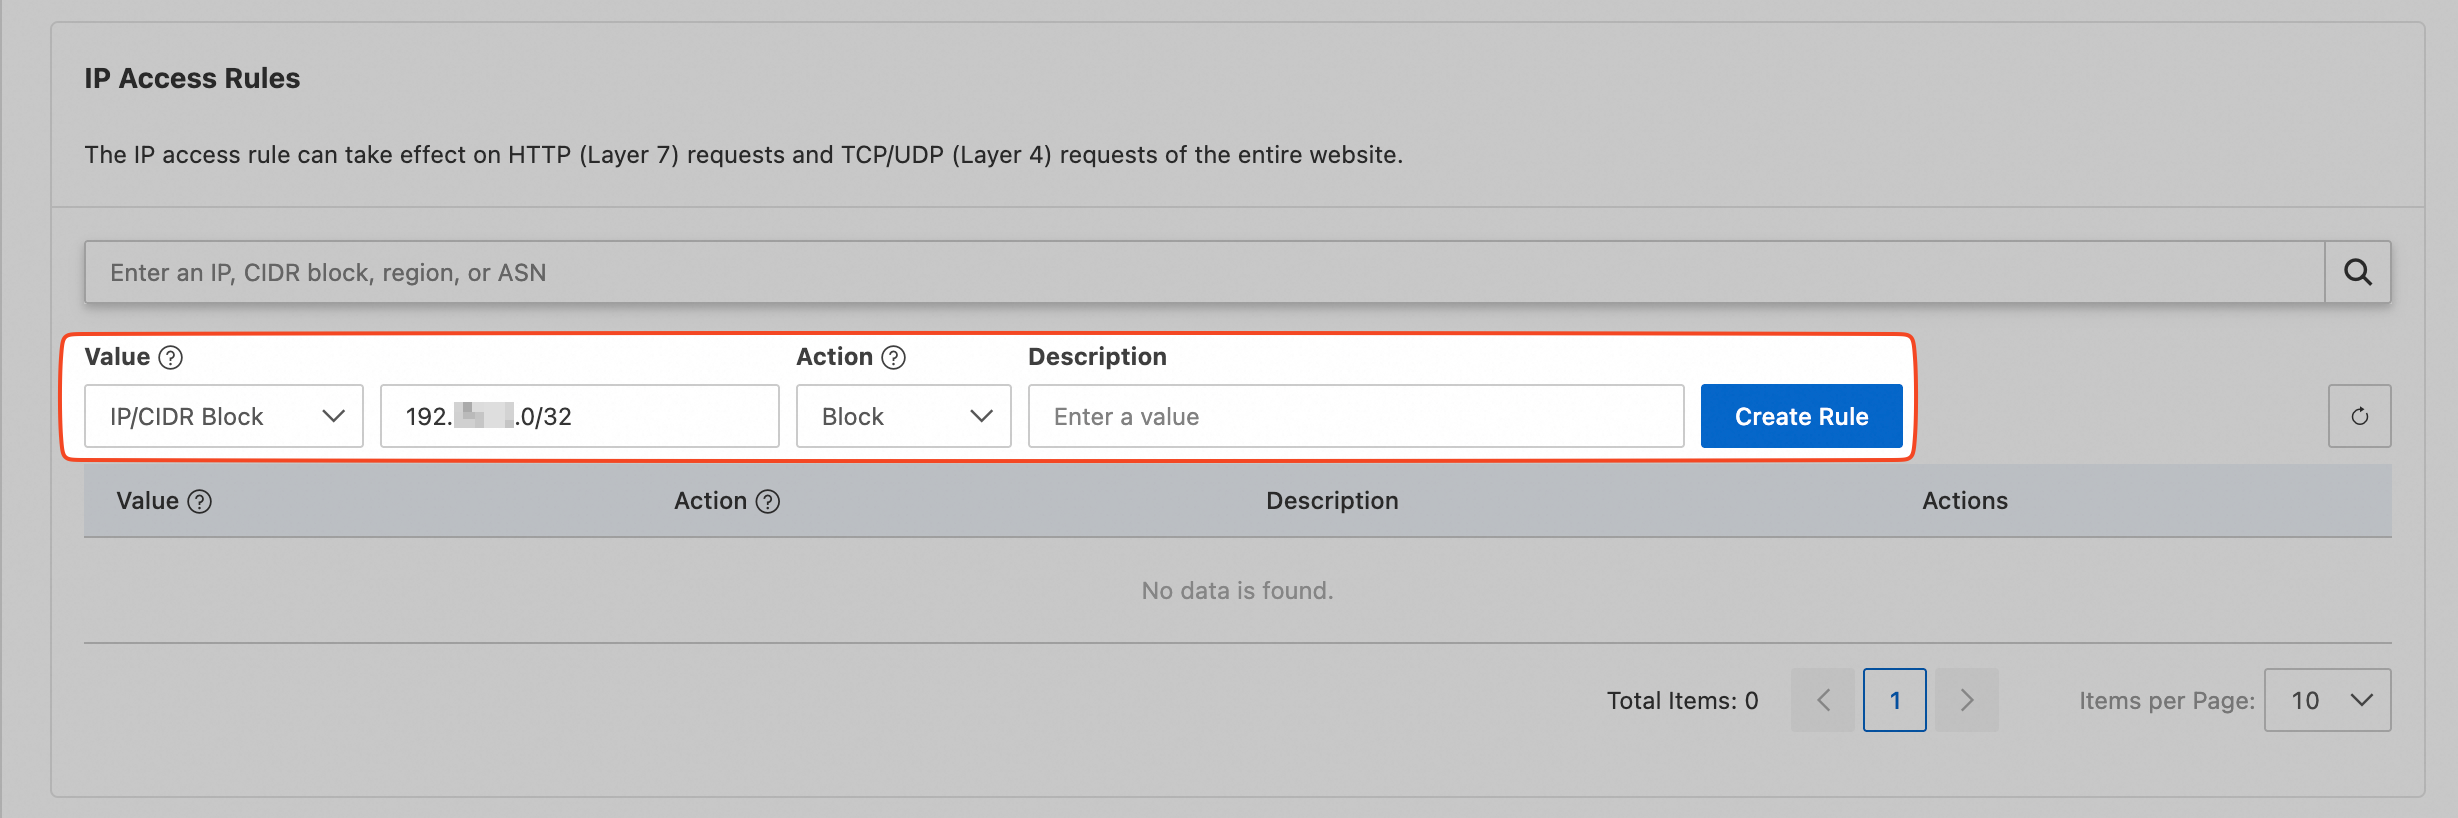
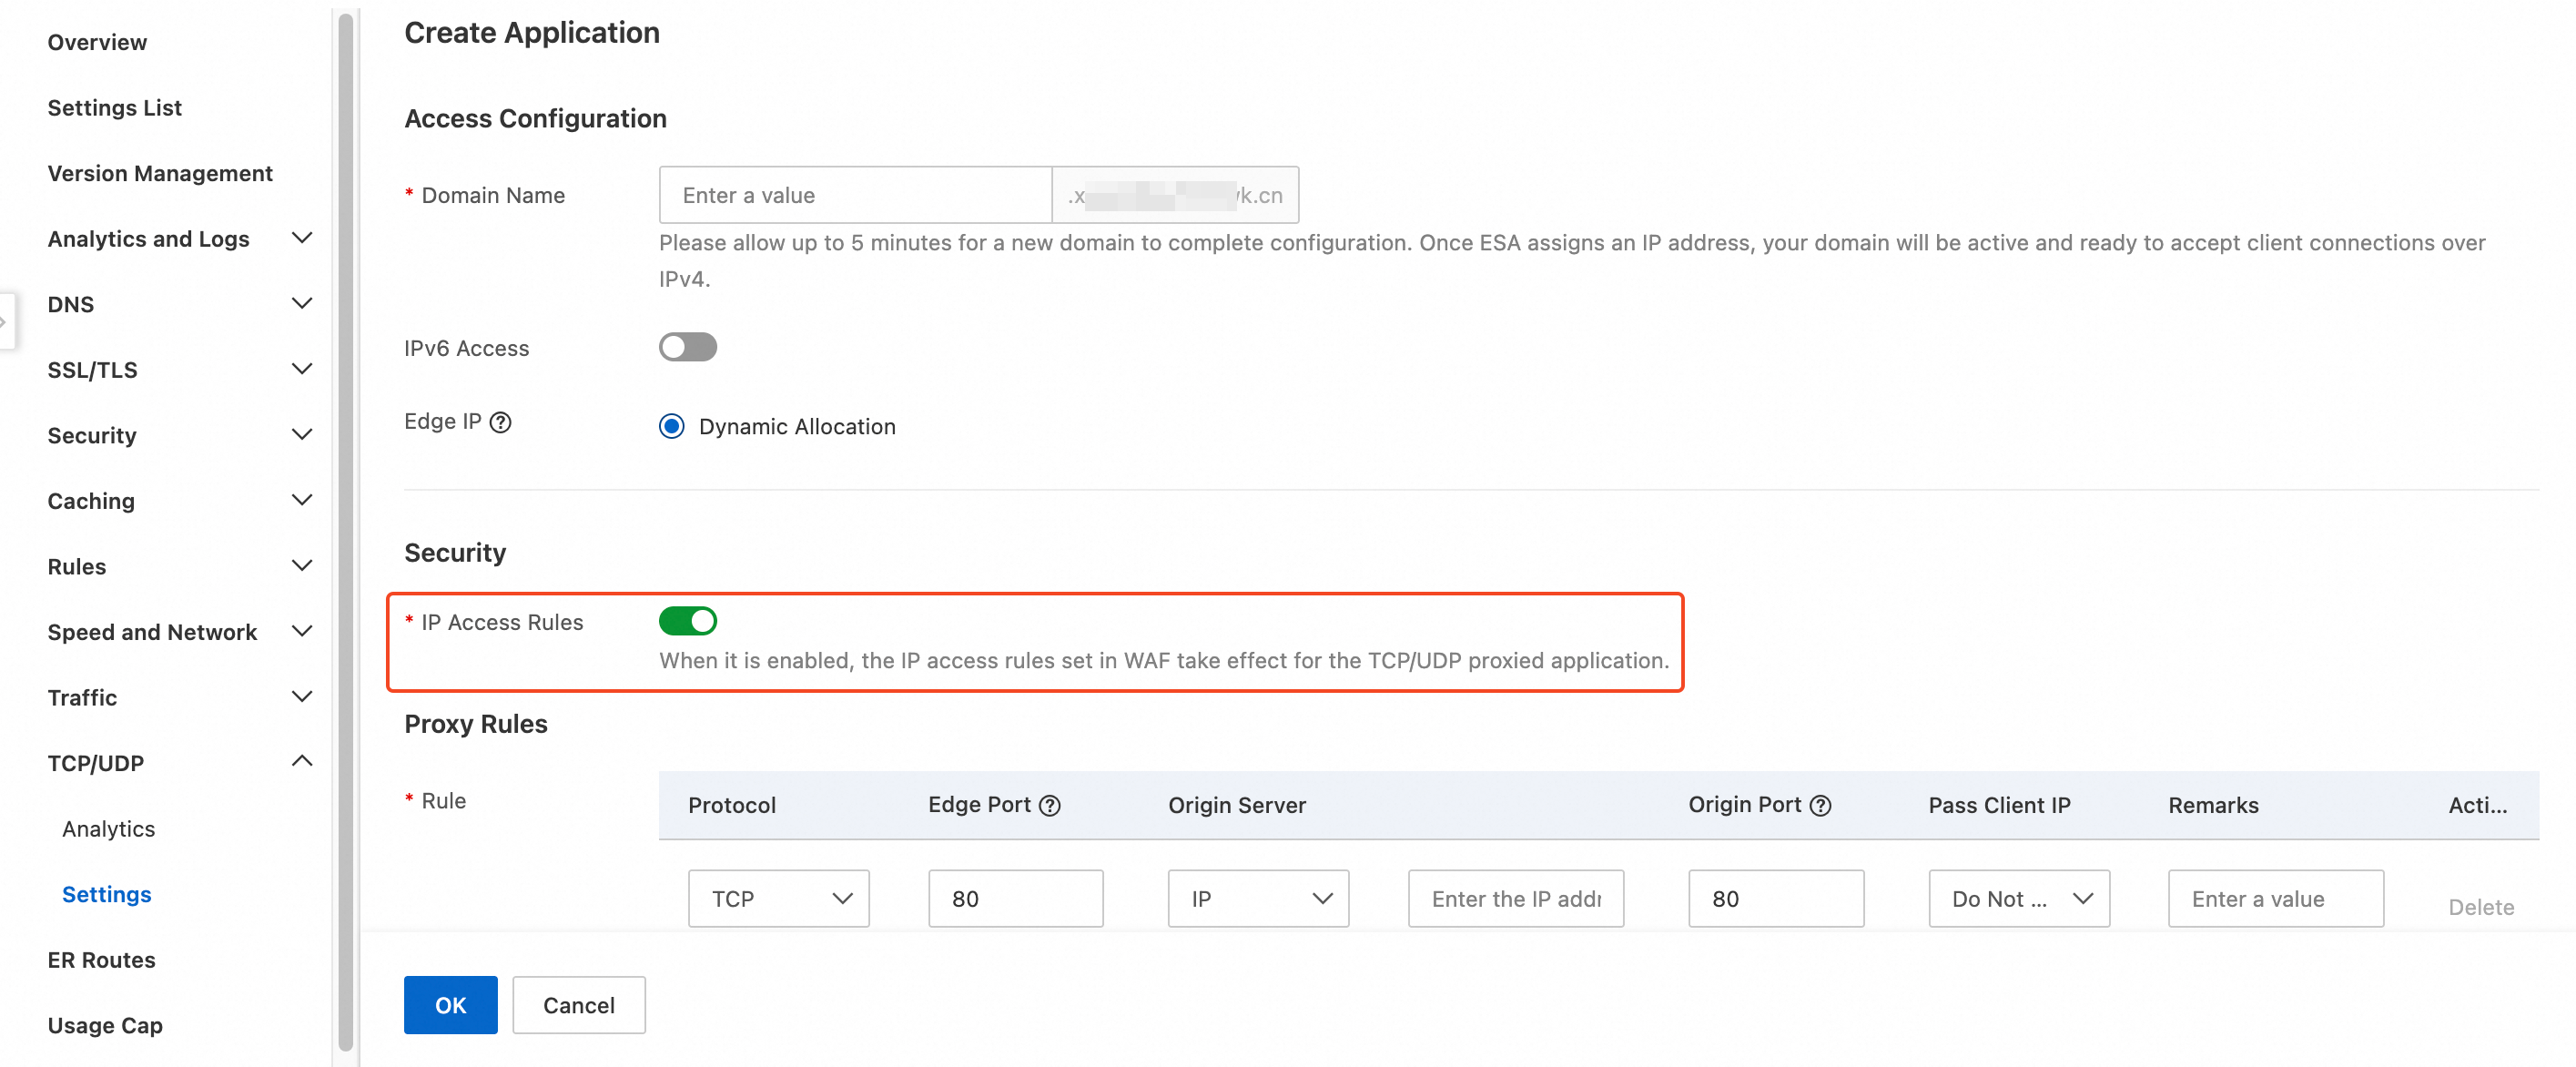
Optional: Rules apply to Layer 7 (HTTP) by default. TCP/UDP (Layer 4) IP access rules require an Enterprise plan. To also cover Layer 4 (TCP/UDP) requests, go to TCP/UDP > Settings. On the Settings page, click Create Application. In the Create Application panel, enable IP Access Rules.
Create a whitelist rule
In the ESA console, go to Websites. In the Actions column for the target site, click
 > WAF.
On the website details page, navigate to .
On the Whitelist Rules tab, click Create Rule.
Enter a Rule Name.
In the If requests match... section, specify the request characteristics. For more information, see Composition of a rule expression.
In the Then skip... section, specify the protection rules to skip.
All Rules: Bypasses all WAF and bot management rules.
Specific Rule Category/ID: Select rules to bypass. For example, for managed rules, you can enter a rule ID of specify a rule type, such as bot management or rate limiting.
Click OK.
Configure a custom rule
In the ESA console, select Websites. In the Website column, click the target website.
In the left-side navigation pane, choose .
Click the Custom Rules tab, and on the Custom Rules tab, click Create Rule.
Enter a Rule Name.
In the If requests match... area, configure the match conditions. For more information, see Rule expression syntax.
In the Then execute... area, specify an action for matching requests. For more information, see Actions.
Click OK.
When you configure rules, note the following:
User-Agent matching and case sensitivity: When you configure a rule to match on the User-Agent, if you select the Case-insensitive match mode, the match value must be in all lowercase. Also, make sure to select the correct match precision—Equals for an exact match or Contains for a partial match—based on your needs. An incorrect mode can prevent the rule from taking effect, for example, by allowing requests that should be blocked (returning a 200 status code).
Rules engine limitations: The WAF rules engine currently supports boolean matching, such as checking if a request field contains a specific string. It does not support more complex logic like counting occurrences or array lengths. Therefore, you cannot create a rule to "block a request if the URL contains a keyword more than N times." WAF protection policies must be based on request attributes like client IP, User-Agent, Referer, or URI. You cannot block traffic based solely on business-layer identifiers, such as a visitor ID.
Bot protection
ESA's Quick Start supports configuration in both Simple Mode and Advanced Mode. Simple Mode allows you to quickly configure bot management for your current site, while Advanced Mode provides more precise bot rules for targeted adjustments to your website or app.
Use Smart Mode
Simple Mode is a bot and crawler management feature for entry-level users. Unlike Advanced Mode, which requires professional expertise to configure complex rules, Simple Mode categorizes traffic into three types by default and lets you select an action for each category. Available for all plans, though some features have plan restrictions.
Configure global policies
In the ESA console, select Websites. In the Website column, click the target site.
In the navigation pane on the left, choose .
On the Bots page, select Smart Mode, configure the items as described below, and then click Configure.
Definite Bots: This category includes many malicious crawlers. Set the action to Block or Slider CAPTCHA.
Likely Bots: Lower risk than Definite Bots but may include malicious crawlers and other traffic. Set the action to Monitor, or to Slider CAPTCHA during high-risk periods.
Verified Bots: This category usually includes crawlers from search engines that support SEO. Set the action to Allow. To block all search engine crawlers, set the action to Block.
Protect static resources from bots
On an Enterprise plan, configure protection for static resources against malicious bots.
Enabling static resource protection may block legitimate bots that periodically fetch static resources, such as email clients. Enable with caution.
Enable JavaScript detection
On an Enterprise plan, use lightweight and invisible JavaScript detection to collect browser fingerprints and improve bot detection accuracy.
Use Professional Mode
Configure protection rulesets for specific requests with separate effective periods. Advanced Mode also protects mobile applications and lets you apply rulesets to other sites in your account.
In the ESA console, select Websites. In the Website column, click the target site.
In the navigation pane on the left, choose .
On the Bots page, select Professional Mode, and click Create Ruleset.
Enter a Rule Set Name. Set Service Type to Browsers, and set SDK Integration to Automatic Integration (Recommended).
In the If requests match... section, configure a rule expression to match target requests. For example, to protect against bots from the Chinese mainland:
(ip.geoip.country in {"CN"}). Supported fields are listed in available rule matching fields for Bots.
Select the protection actions to add.
For search engine bots:
Whitelist: Allow specific search engine bots that you trust.
Fake Crawler Interception: Blocks all search engine bots. Use with Legitimate Bot Management to allow only specific bots.
For known bot libraries:
Bot Threat Intelligence Library: An Alibaba Cloud IP library of known malicious bot sources. Enable Slider CAPTCHA to counter them.
IDC Blacklist Blocking: If your clients do not connect from public clouds or IDCs, use Data Center Blacklist to block requests from these sources.
For requests that need to be identified:
Identify bots by request characteristics: Identifies non-browser bots by comparing their access features with those of real user browsers.
Identify bots by request behavior: ESA analyzes client traffic, automatically trains a machine learning model, and generates protection rules and blacklists. Configure countermeasures based on these rules and blacklists.
Custom throttling: If you want to allow some bot requests but prevent them from accessing your site too frequently, you can limit the request rate from a specific IP address or session. A protection action is applied to requests that exceed the specified threshold.
In the Effective Time area, click Edit next to the relevant rule, set the effective period, and then click OK.
After you complete the configuration, click OK.
Security Analytics
Security Analytics displays data on blocked and monitored requests, as well as total request volume for WAF and bot management. Use this data to dynamically adjust your protection rules.
Analysis dimensions
-
Filter: Filters by Host, HTTP Version, and Client IP. Only matching data is displayed.
-
Query time: By default, data for the Last 24 Hours is displayed. You can set a custom range to query data from the last 30 days.
View security analytics reports
During traffic spikes or suspected attacks, use security analytics to analyze HTTP/HTTPS traffic in real time. Compare traffic against your baseline for legitimate requests by examining header structure, payload patterns, and access frequency. For anomalous traffic such as SQL injection or CC attacks, the WAF DPI engine dynamically loads predefined or custom rulesets to block malicious requests and trace attack sources.
Data in Security Analytics is delayed by about 5 minutes.
Account level
View protection data across all sites in your account from a centralized dashboard.
-
Log on to the ESA console. In the navigation pane on the left, choose .
-
On the Security Analytics page, you can view protection information and use the Filter to select the data you need. You can click the
 icon to print the page report or click the
  icon to download the data as a CSV file for local analysis.
Site level
You can also view protection data for individual sites.
-
In the ESA console, go to Websites. In the Website column, click the target site.
-
In the navigation pane on the left, choose .
-
On the Security Analytics page, you can view protection information and use the Filter to select the data you need. You can click the
icon to print the page report or click the icon to download the data as a CSV file for local analysis.NoteProtect against unusual traffic covers anomaly response. You can create rules by clicking Create Custom WAF Rule from Filters or Create Bot Management Rule from Filters.

CC rate limiting
See Configure custom protection policies to configure rules and policies.
A sudden increase in API access volume triggers a monitoring alert. When checking real-time logs, you might find that during an attack, a single IP accesses the API over 3,000 times within 60 seconds. In contrast, during a non-attack period, a single IP accesses it at most 100 times in 60 seconds. Configure the CC protection policy with a threshold that is 2 to 3 times the access frequency during a normal period.
Check the real-time logs to locate the attacked resource and compare the access frequency during attack and non-attack periods. If there is a significant difference, you can configure this protection policy.
In normal business operations, if your servers call resources through public interfaces and there is concentrated access from internal IPs, add a match condition to exclude these IPs from the rule's count.
You need to adjust the protection path and the trigger threshold based on your business needs and the attacker's access frequency observed in the real-time logs. The following is a configuration example.
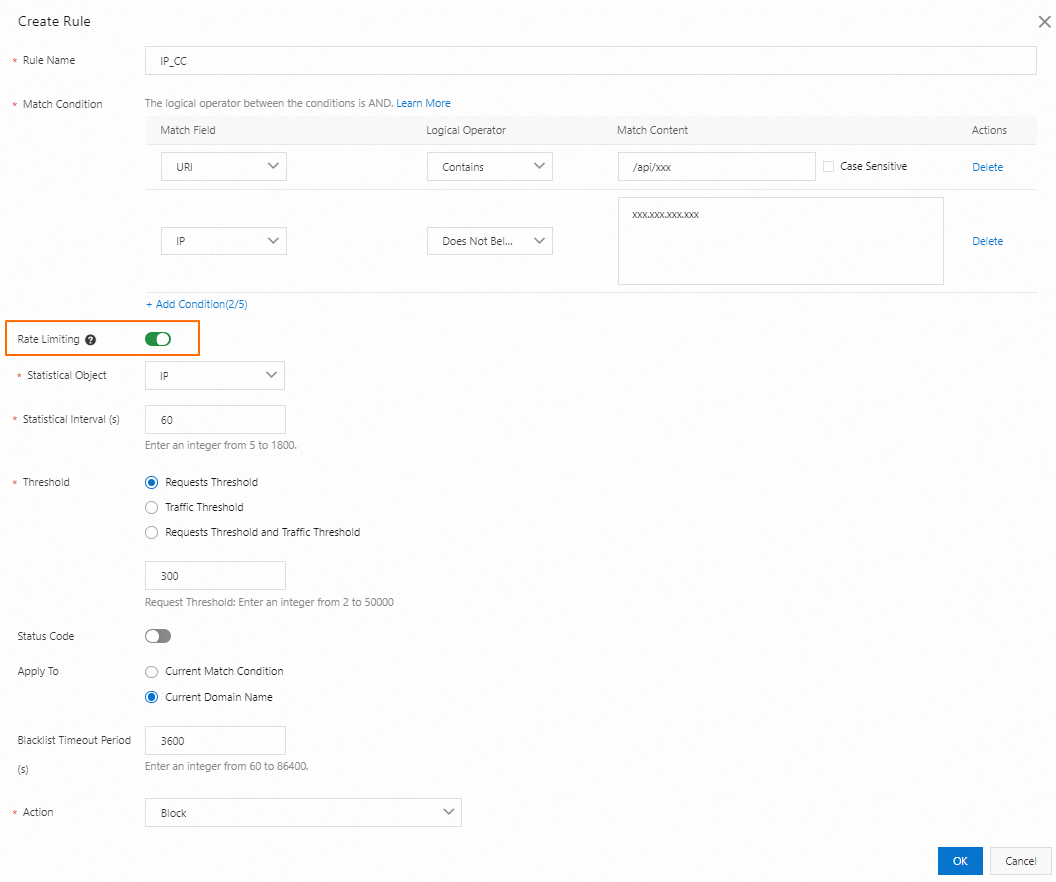
Parameter | Example value | Description |
Rule Name | A custom name for your rule. The name must meet the following requirements:
| Indicates that a request matches the rule if the requested path contains |
Match Condition |
| |
Rate Limiting | Turn on the Rate Limiting toggle. | Indicates that if a client IP matches the conditions more than 300 times within 60 seconds, the IP is added to the blocklist. |
Statistical Object | Select IP. | |
Interval (Seconds) | Enter | |
Threshold (times) | Enter | |
Status Code | Disabled by default. | Indicates that the IP address that triggers the rule is added to the blocklist. For 3600 seconds, all requests from this IP address are blocked. |
Apply To | Select Apply to entire domain. | |
Blocklist Timeout (seconds) | Enter | |
Action | Select Block. |
Malicious UA blocking
See Configure custom protection policies to configure rules and policies.
For app scenarios where an empty User-Agent is normal, this policy is not necessary.
If the User-Agent value is the app name, you need to add the app name used by normal traffic to the match content.
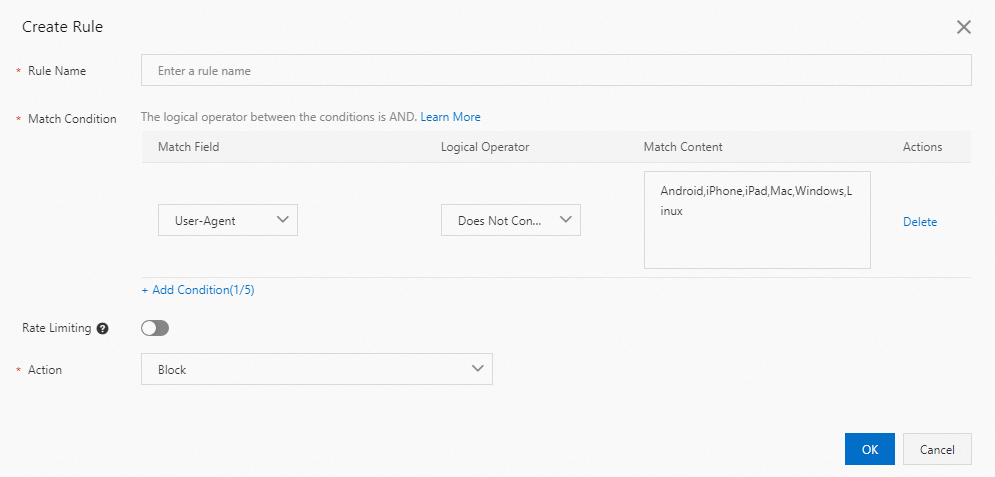
Parameter | Example value | Description |
Rule Name | A custom name for your rule. The name must meet the following requirements:
| Indicates that if the request's User-Agent does not contain |
Match Condition |
| |
Rate Limiting | Disabled by default. | |
Action | Select Block. |
Malicious UA rate limiting
See Configure custom protection policies to configure rules and policies.
A domain name or interface is flooded with requests, which drives up traffic charges. Real-time logs show that client IP addresses are scattered, but the User-Agent values are highly concentrated and do not match normal traffic. By comparing the attack window with a normal time range, you can see that the request volume for the same User-Agent is far lower during normal periods.
You need to adjust the protection path and trigger threshold based on your business needs, attacker characteristics, and frequency from real-time logs. The following is a configuration example.
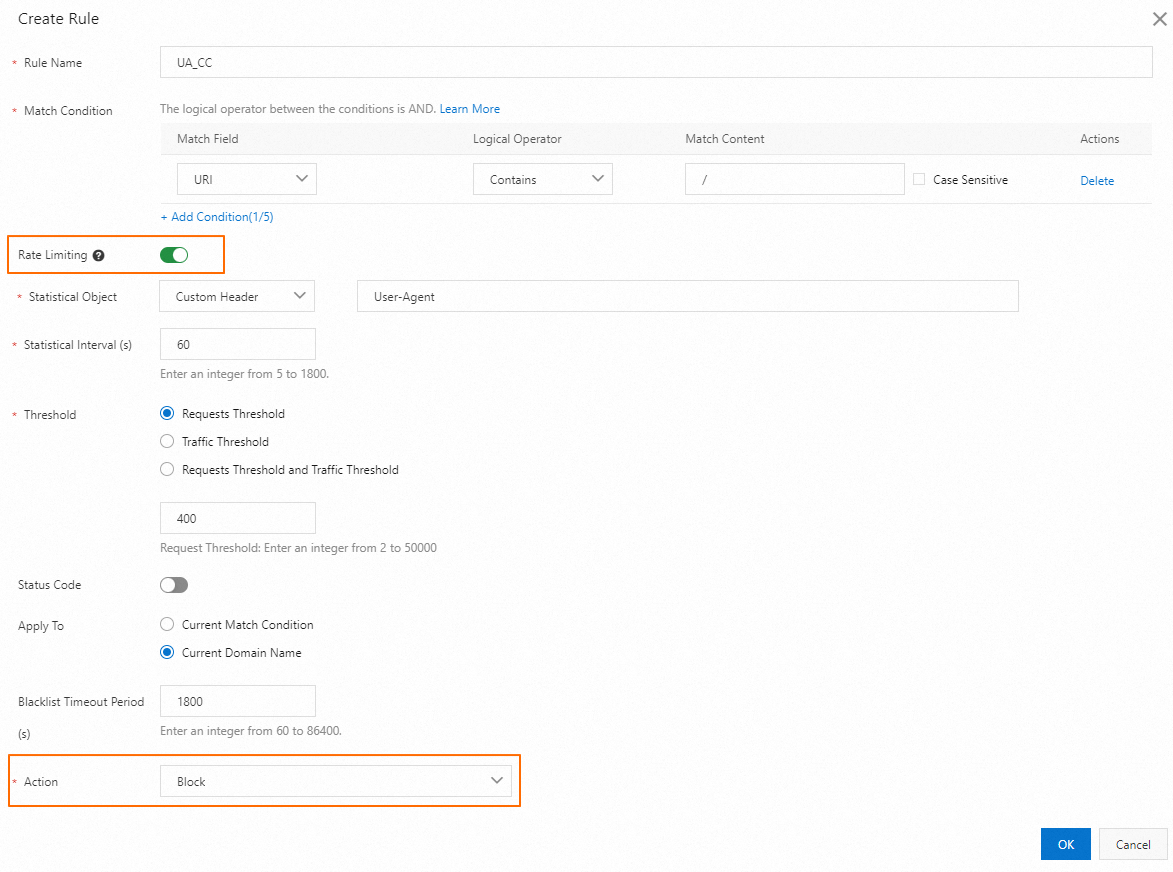
Parameter | Example value | Description |
Rule Name | A custom name for your rule. The name must meet the following requirements:
| Indicates that a request matches the rule if the requested path contains |
Match Condition |
| |
Rate Limiting | Turn on the Rate Limiting toggle. | This means that if a client request contains a |
Statistical Object | Select Custom Header and enter | |
Interval (Seconds) | Enter | |
Threshold (times) | Enter | |
Status Code | Disabled by default. | Indicates that the User-Agent that triggers the rule is added to a blocklist. For 1800 seconds, all requests with this User-Agent are blocked. |
Apply To | Select Apply to entire domain. | |
Blocklist Timeout (seconds) | Enter | |
Action | Select Block. |
Block malicious IPs
See Configure an IP blocklist to configure rules and policies.
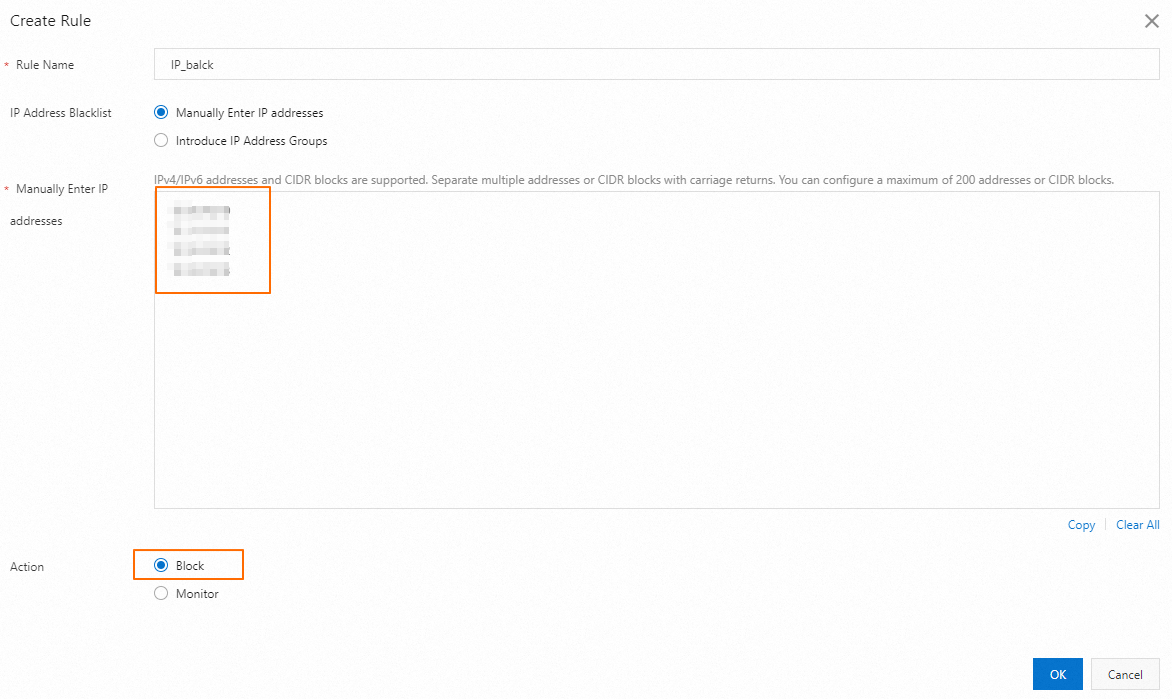
Bot blocking
See Configure bot protection to configure rules and policies, and enable the relevant protection items as needed.
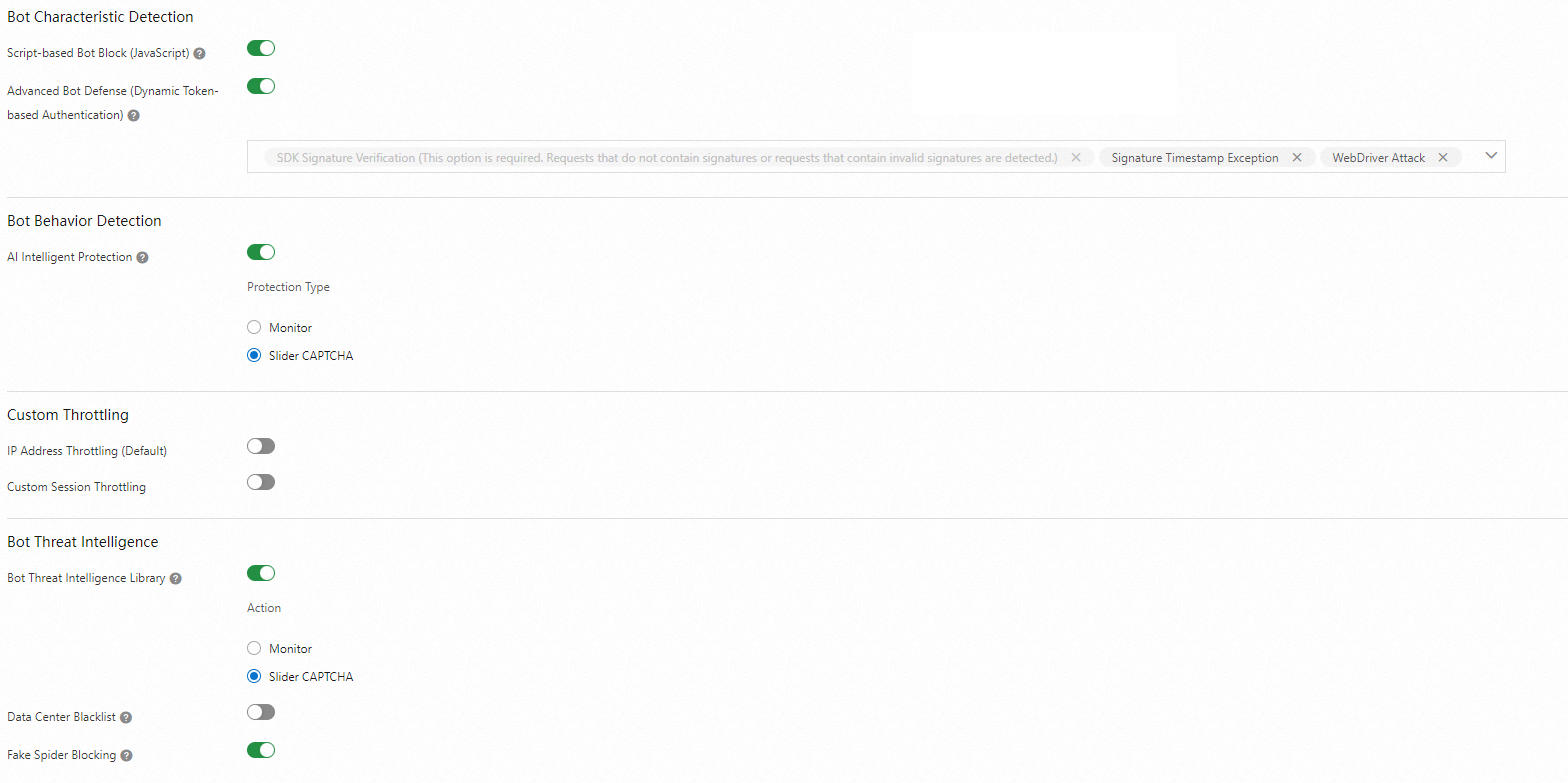
Next steps
Real-time monitoring
Configure real-time monitoring for the peak bandwidth of specified domain names in CDN. If the peak bandwidth reaches the configured threshold, the system sends an alert to administrators by SMS, email, or DingTalk. This helps you promptly detect potential risks. For more information, see Configure alert rules.
Cost alerts
In the top navigation bar of the console, choose Expenses > Expenses and Costs. Configure the following features to better control your account spending and avoid high bills.
-
Low balance alert: You can set an alert to be sent by SMS when your account balance falls below a specified amount.
-
High bill alert: You can enable an alert that sends an SMS notification if a daily bill for a product exceeds a specified threshold.
To ensure the integrity of the statistics and the accuracy of bills, CDN issues the bill approximately 3 hours after a billing cycle ends. The point in time at which the relevant fees are deducted from your account balance may be later than the point in time at which the resources are consumed within the billing cycle. CDN is a distributed service. Therefore, Alibaba Cloud does not provide the consumption details of resources in bills. Other CDN providers use a similar approach.
Access frequency control
CDN does not support access frequency control. If you require rate limiting, JavaScript challenges, or other bot traffic blocking capabilities, we recommend that you upgrade to ESA.