An availability zone-level failure is an extreme but possible fault for cloud services. If an availability zone fails, workloads in that zone can become unavailable, unreachable, or return data errors. This topic shows how to use Alibaba Cloud Container Service for Kubernetes (ACK) with Alibaba Cloud Service Mesh (ASM) to implement disaster recovery for such failures.
Background
High availability of managed components
All managed components of ACK clusters and ASM instances are deployed with multiple replicas evenly distributed across several availability zones. This ensures that the cluster and service mesh control plane remain operational even if a single availability zone fails. Similarly, worker nodes and elastic container instances within the cluster are also distributed across different availability zones. In the event of an availability zone-level failure, such as a power or network outage, the healthy availability zones continue to operate normally.
High-availability configurations and service mesh for availability zone failures
To handle availability zone-level failures, the first step is to deploy your application workloads evenly across different availability zones.
ACK supports multi-availability zone (AZ) node pools. When you create and manage a node pool, we recommend that you select vSwitches from different AZs and choose a balanced distribution policy when you configure an auto-scaling policy. This allows ECS instances to be evenly distributed across the multiple AZs specified for the scaling group. Furthermore, you can use features such as node auto-scaling, deployment sets, and multi-AZ distribution, combined with Kubernetes topology spread constraints, to evenly deploy workloads across different AZs. For details, see Recommended configurations for a highly available cluster architecture.
After your application is deployed across multiple availability zones, you need to monitor the health of your Kubernetes applications and cluster in real time to detect availability zone failures and respond quickly to restore services.
-
Service mesh technology improves the network observability of your system. The data plane proxies in the service mesh expose key metrics related to network requests and application service interactions. These metrics, which include data for specific availability zones, can signal various issues and help you detect availability zone failures.
-
For an availability zone-level failure, ASM provides disaster recovery by combining its traffic-shifting capabilities with your load balancer's. When an availability zone becomes unavailable, you can respond to alerts by configuring traffic shifting to temporarily redirect intra-cluster network traffic away from the affected availability zone. When the availability zone is healthy again, you can resume sending traffic to it.
Disaster recovery architecture
Handling availability zone-level failures involves several steps:
-
Deploying workloads evenly across multiple availability zones and provisioning capacity in each.
-
Monitoring service metrics to detect failures.
-
When an availability zone fails, quickly shifting traffic away from the affected zone (manually or automatically) to recover from the failure. This primarily involves:
-
Ingress traffic shifting: Ensure the load balancer serving as the traffic ingress stops sending traffic to the affected availability zone.
-
Intra-cluster traffic shifting: Ensure service calls within the cluster no longer send traffic to the affected availability zone.
-
As shown in the following figure, to handle failures across multiple availability zones, create an ACK cluster with worker nodes in multiple availability zones and deploy your workloads evenly across them. You can also collect control plane logs and cluster events from your ACK cluster and ASM instances into Log Service (SLS). ACK and ASM can collect metrics related to nodes, containers, and services into Alibaba Cloud Managed Service for Prometheus. This setup allows you to promptly observe failure events at different levels and view the status of services within the cluster through logs and Grafana dashboards. For the cluster ingress, use a load balancer that supports an active-active multi-availability zone architecture, such as a Network Load Balancer (NLB) or an Application Load Balancer (ALB).

ASM continuously reports access logs and request metrics for all traffic to and from services in the cluster. It aggregates metrics like response codes, latency, and request sizes. When a gray failure occurs in an availability zone, the request metrics and alert configurations provided by the service mesh are valuable for determining the scope and symptoms of the failure. This example describes how to view service traffic metrics reported by the service mesh. For information about cluster workload metrics and alert configurations, see Connect to and configure Managed Service for Prometheus, Alarm management for Container Service, and Event monitoring.
Disaster recovery configuration
This example demonstrates how to perform disaster recovery for an availability zone-level failure by using a cluster that spans multiple availability zones.
Step 1: Prepare the environment
-
Create an ACK managed cluster. When you create the cluster, select vSwitches from two availability zones to enable multi-AZ support. You can keep the default values for other settings. The node pool uses the balanced distribution scaling policy by default. For more information, see Create an ACK managed cluster.
-
Create an ASM instance with the same availability zone configuration as the ACK cluster. For more information, see Create an ASM instance.
-
Deploy the gateway and a sample application.
-
In the ASM instance, create an ASM Gateway and associate it with a Network Load Balancer (NLB). Select the same two availability zones for the NLB as for the ASM instance and ACK cluster (in this example,
cn-hangzhou-kandcn-hangzhou-h). For more information, see Use an NLB instance at an ASM ingress gateway.NoteThis example uses an ASM Gateway associated with an NLB as the traffic ingress. You can also use an Application Load Balancer (ALB) as the ingress for your application. ALBs also provide multi-availability zone disaster recovery and DNS record removal capabilities.
-
Disable the cross-zone forwarding feature for the NLB. This ensures that the NLB in each availability zone forwards traffic only to backends within the same availability zone.
-
Enable automatic sidecar injection for the
defaultnamespace. For more information, see Manage the global namespace. -
Deploy the sample application.
The preceding command deploys an application that consists of the
mocka,mockb, andmockcservices. Each service includes two stateless deployments, each with a single replica. The deployments are distributed to nodes in different availability zones by using differentnodeSelectorfields and are configured with environment variables to return the availability zone where they are located.NoteTo provide a clear demonstration, this example uses the
nodeSelectorfield of a pod to manually select the pod's availability zone. In a production high-availability environment, you should configure topology spread constraints to ensure that pods are distributed across different availability zones as much as possible. For more information, see Workload high-availability configuration.
-
Step 2: Monitor service metrics
When a failure occurs, workload logs, metrics, and alerts help you quickly detect the failure, determine its scope, and understand its impact or root cause.
-
Add an availability zone dimension to the request metrics.
The mesh proxy can automatically detect the availability zone where a workload is deployed and store this information in the proxy metadata. You can edit the metric dimensions to add the
localitydimension to the service mesh metrics and set its value toxds.node.locality.zone, which represents the availability zone of the workload. For more information, see Observability configurations. -
Send requests to the sample application to generate request metrics.
watch -n 0.1 curl nlb-xxxxxxxxxxxxx.cn-xxxxxxx.nlb.aliyuncsslb.com/mock -vExpected output:
> GET /mock HTTP/1.1
> Host: nlb-85h289ly4hz9qhaz58.cn-hangzhou.nlb.aliyuncsslb.com
> User-Agent: curl/8.7.1
> Accept: */*
>
* Request completely sent off
< HTTP/1.1 200 OK
< date: Sun, 08 Dec 2024 11:53:26 GMT
< content-length: 150
< content-type: text/plain; charset=utf-8
< x-envoy-upstream-service-time: 5
< server: istio-envoy
<
* Connection #0 to host nlb-85h289ly4hz9qhaz58.cn-hangzhou.nlb.aliyuncsslb.com left intact
-> mocka(version: cn-hangzhou-h, ip: 192.168.122.66)-> mockb(version: cn-hangzhou-k, ip: 192.168.0.47)-> mockc(version: cn-hangzhou-h, ip: 192.168.122.44)%
The output shows that requests are randomly routed to the two different availability zones, which indicates that the workloads in both zones are available.
-
After sending requests for a period of time, explore the metrics in Managed Service for Prometheus. For more information, see Metric Explorer.
-
View the request status code information for workloads in different availability zones.
To check the request rate for workloads in a specific availability zone (grouped by service name and response code), use the following PromQL query in your Prometheus instance:
sum by(app, response_code) (rate(istio_requests_total{locality="cn-hangzhou-h", reporter="destination"}[$__rate_interval]))Expected result:
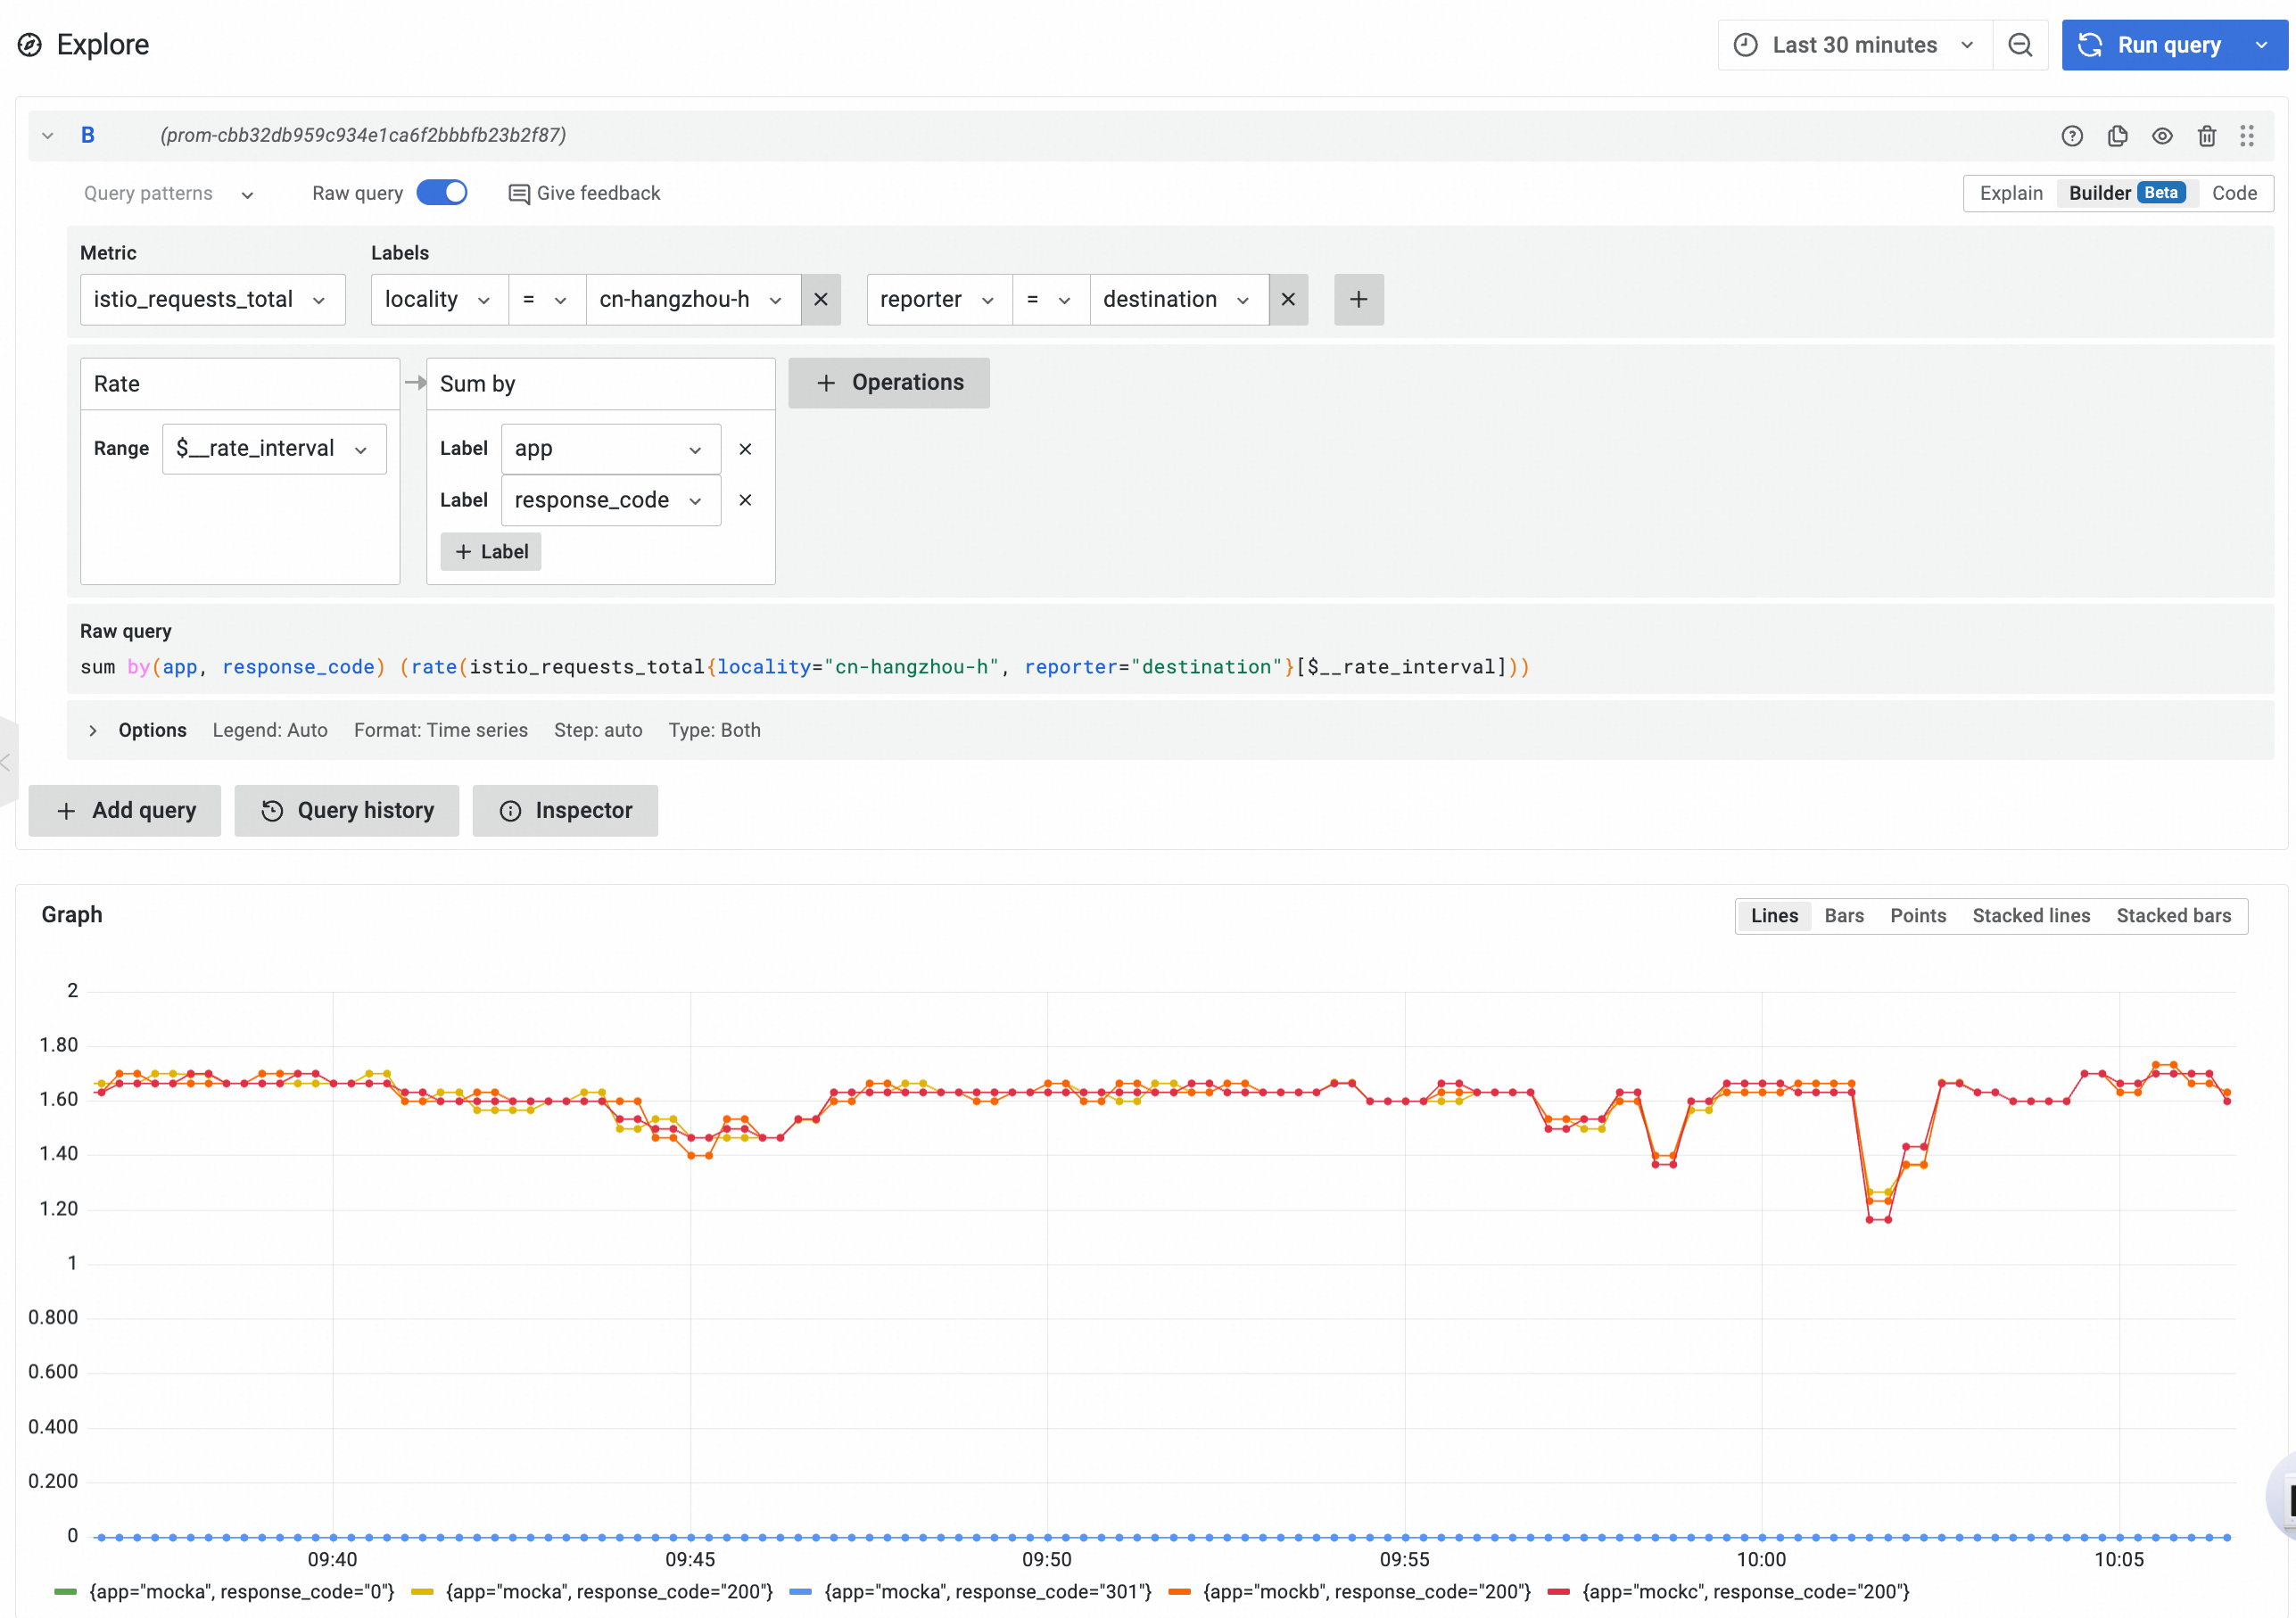
With an even deployment, the request rates received by the two availability zones are nearly identical. You can change the filter condition to
locality="cn-hangzhou-k"to view the request rate and status code information for thecn-hangzhou-kavailability zone. -
View the request latency information for workloads in different availability zones.
To check the average request latency for workloads in a specific availability zone (grouped by service name and response code), use the following PromQL query in your Prometheus instance:
sum by(app, response_code) (rate(istio_request_duration_milliseconds_sum{locality="cn-hangzhou-h", reporter="destination"}[$__rate_interval]))You can change the filter condition to
locality="cn-hangzhou-k"to view the average latency information for thecn-hangzhou-kavailability zone.
-
-
Configure alert rules based on the metrics.
You can configure alerts by using custom PromQL queries. When service latency or the rate of non-200 status codes exceeds a threshold, Prometheus sends an alert to the specified contact. For more information, see Create a Prometheus alert rule.
-
Create an alert rule based on application latency.
Use the following PromQL query to create an alert for the
mockbservice.sum by(response_code, locality) (rate(istio_request_duration_milliseconds_sum{app="mockb",reporter= "destination"}[1m])) > 3The preceding query triggers an alert if the average latency of the
mockbservice over a one-minute interval exceeds 3 ms. The alerts are grouped by status code and availability zone. -
Create an alert rule based on the service response status code.
Use the following PromQL query to create an alert for the
mockaservice.sum by (locality, response_code) (rate(istio_requests_total{app="mocka",reporter="destination",response_code!="200"}[1m])) >= 0
You can create alert rules for other applications by changing the
app="mockb"setting in the preceding alert rules. -
Step 3: Perform a disaster recovery drill
After you receive an alert that an availability zone in your ACK cluster is unhealthy or impaired, you can isolate the service workloads deployed in that zone from other zones. This allows you to investigate the cause of the failure while keeping your business running. Once the failure is resolved, you can restore traffic to the availability zone.
-
Isolate the nodes in the affected availability zone.
Apply a taint to the nodes to prevent new pods from being scheduled on them. After you apply the taint, the nodes become unschedulable. Existing pods remain on the nodes, but no new pods are scheduled in that availability zone. For more information, see Set the scheduling status for a node. The following example shows how to isolate the
cn-hangzhou-havailability zone by marking all nodes in it as unschedulable. -
Shift the north-south ingress traffic.
Because the NLB is configured for same-zone forwarding, you must use the DNS record removal feature of the NLB (or ALB) to quickly shift north-south traffic at the ingress layer when a failure occurs. This prevents external traffic from continuing to flow into the failed availability zone.
-
Log on to the NLB console and click the NLB instance that is associated with the ASM Gateway.
-
On the instance details page of the NLB, on the Zone tab, find the affected availability zone. In the Actions column, click Remove DNS, and then click OK in the dialog box that appears. After the DNS record is removed, the public IP address of the NLB in the affected availability zone is no longer included in DNS resolution records.
-
-
Shift the east-west traffic.
You can use the availability zone traffic shifting feature of Alibaba Cloud Service Mesh (ASM) to quickly redirect east-west traffic within the cluster, preventing it from reaching endpoints in a specific availability zone.
-
Log on to the Service Mesh console and click the ASM instance that is managing the cluster.
-
On the mesh details page, click Service Discovery Selectors. Click Show Advanced Settings, enter the region and availability zone information where the pods are located, and then click OK.
After this operation, the instance briefly enters an updating state. When the update is complete, endpoints in the specified availability zone are excluded from the service discovery scope.
-
-
Observe the isolation effect.
Continue to access the sample application. You will find that all responses come from services in the
cn-hangzhou-kavailability zone. This indicates that traffic has been completely shifted away from thecn-hangzhou-havailability zone. Expected output:> Host: nlb-xxxxxxxxxxxxxxxxxxx8.cn-hangzhou.nlb.aliyuncsslb.com > User-Agent: curl/8.7.1q > Accept: */* > A * Request completely sent off < HTTP/1.1 200 OKe < date: Tue, 10 Dec 2024 04:03:26 GMT < content-length: 1500 < content-type: text/plain; charset=utf-8 < x-envoy-upstream-service-time: 30 < server: istio-envoyr < s { [150 bytes data] {100 150 100 150 0 0 2262 0 --:--:-- --:--:-- --:--:-- 2238 * Connection #0 to host nlb-xxxxxxxxxxxxxxxxxxx8.cn-hangzhou.nlb.aliyuncsslb.com left intact -> mocka(version: cn-hangzhou-k, ip: 192.168.0.44)-> mockb(version: cn-hangzhou-k, ip: 192.168.0.47)-> mockc(version: cn-hangzhou-k, ip: 192.168.0.46)