The thread pool and connection pool monitoring feature lets you monitor key metrics for your application's thread pools and connection pools. These metrics include the core thread count, current thread count, maximum thread count, active thread count, and task queue size.
Prerequisites
Connect your application to Application Monitoring.
The thread pool and connection pool monitoring feature is available only in the Pro Edition of Application Monitoring.
Enable thread pool and connection pool monitoring
Agent versions earlier than 2.7.1.3 do not support thread pool and connection pool monitoring. You must upgrade the agent to version 2.7.1.3 or later. For more information, see Upgrade the ARMS agent.
-
Thread pool and connection pool monitoring is enabled by default for agent versions 2.7.3.5 and later.
-
For agent versions from 2.7.1.3 to 2.7.3.4, perform the following steps to manually enable the feature.
-
Log on to the ARMS console. In the left-side navigation pane, choose .
At the top of the Application List page, select a region, and then click the name of your target application.
NoteThe icons in the Language column have the following meanings:
 : Java applications connected to Application Monitoring.
 : Go applications connected to Application Monitoring.
 : Python applications connected to Application Monitoring.
-: Represents an application connected to Managed Service for OpenTelemetry.
-
In the left-side navigation pane, click Application Settings.
-
On the Custom Configuration tab, in the Pooled Monitoring Configuration section, turn on the Thread pool, connection pool monitoring switch.
View thread pool and connection pool metrics
After you enable this feature, view the monitoring metrics on the Application Details page, under the Thread Pool Monitoring and Connection Pool Monitoring tabs.
Figure 1. Thread pool monitoring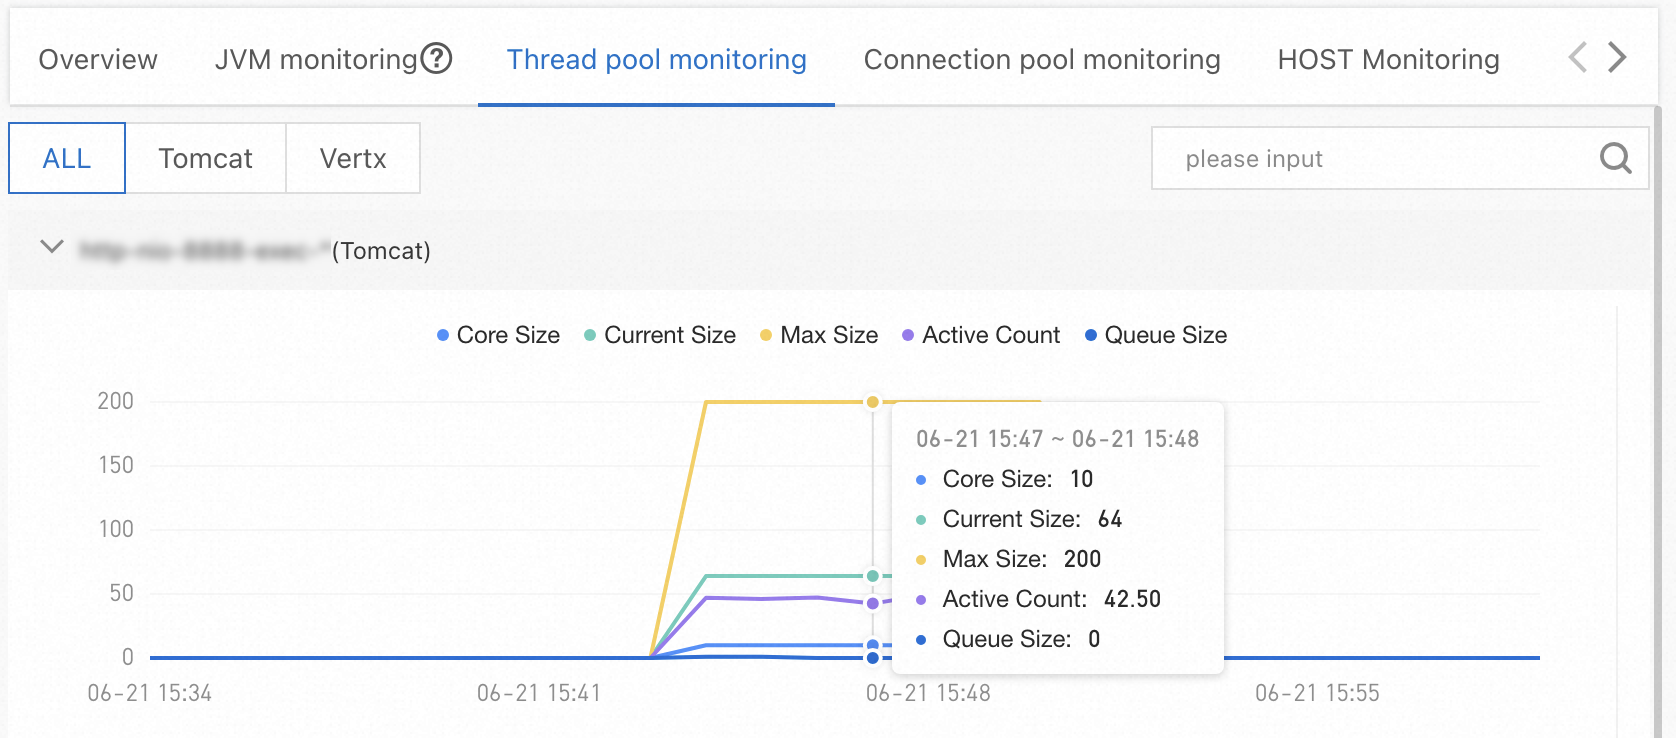
Figure 2. Connection pool monitoring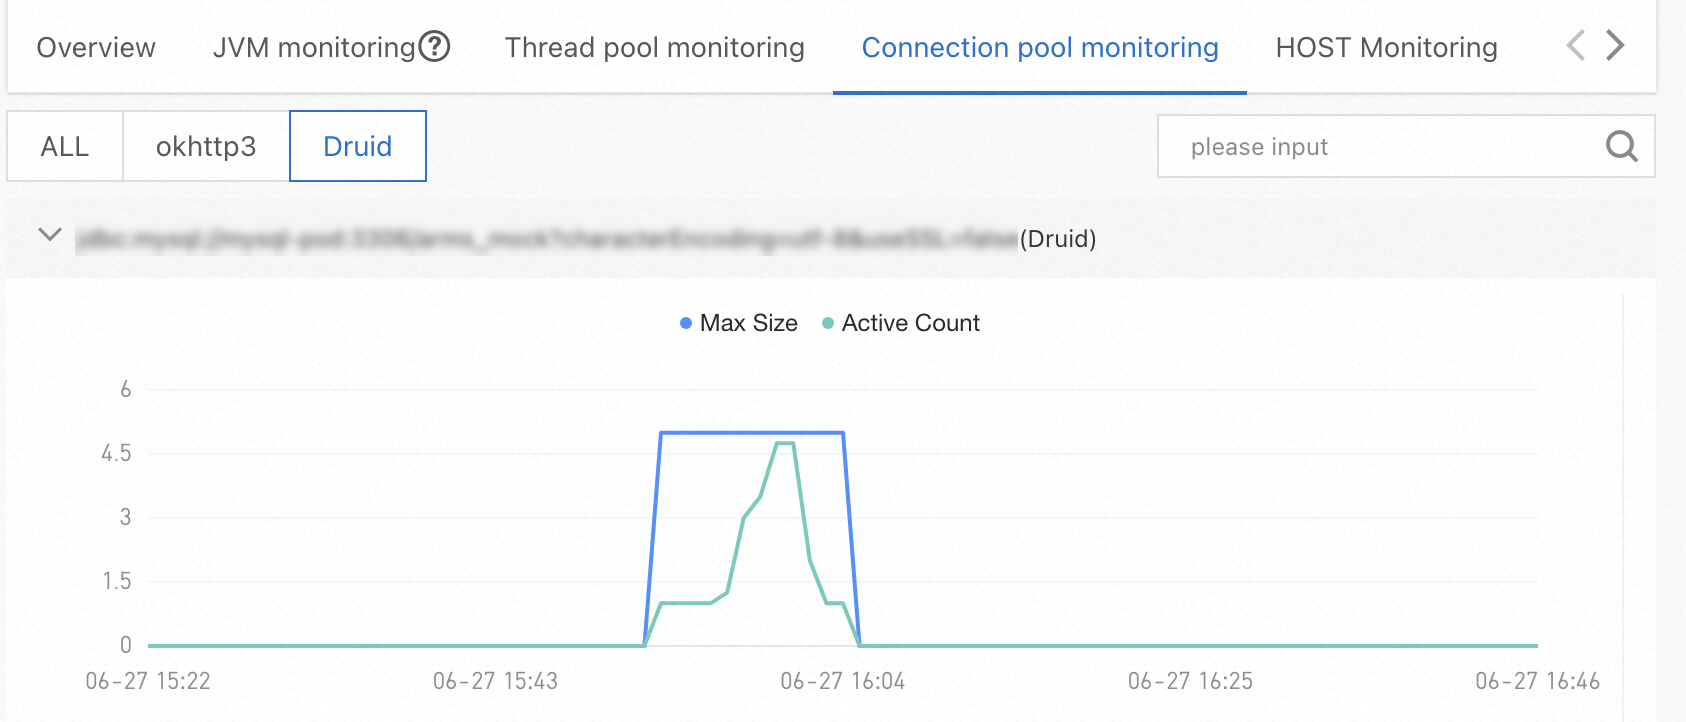
Supported frameworks for thread pools
Agent versions 4.1.x and later
Supported frameworks:
-
java.util.ThreadPoolExecutor: Typically used for Tomcat 8 to 9.1, Dubbo, HSF, Vert.x, and user-defined thread pools. -
org.apache.tomcat.util.threads.ThreadPoolExecutor: Typically used for Tomcat 9.1 and later. -
org.eclipse.jetty.util.thread.QueuedThreadPool: Typically used for Jetty. -
org.xnio.XnioWorker: Typically used for Undertow.
The following metrics are collected:
|
Metric name |
Supported framework |
Description |
|
|
|
The core thread count. This is a static configuration and does not typically change. |
|
|
|
The maximum thread count. This is a static configuration and does not typically change. |
|
|
|
The number of threads currently executing tasks. |
|
|
|
The current thread count, which includes both active threads and idle threads that are waiting for tasks. |
|
|
|
The highest recorded number of threads in the thread pool. |
|
|
|
The total number of tasks that have been scheduled for execution. |
|
|
|
The total number of tasks that have completed execution. |
|
|
|
The total number of tasks rejected by the thread pool. |
|
|
|
The current number of tasks waiting in the queue. |
Agent versions earlier than 4.1.x
Thread pool monitoring supports Tomcat, HSF, Dubbo, Vert.x, and Undertow frameworks. For Undertow, agent versions 3.1.x and earlier support Undertow 1.x to 2.0.x, while agent versions 3.2.x and later support all versions of Undertow.
The following metrics are collected:
|
Metric name |
Metric |
|
Core thread count |
|
|
Maximum thread count |
|
|
Active thread count |
|
|
Queue size |
|
|
Current thread count |
|
For the SchedulerX framework, the following metric is collected:
|
Metric name |
Metric |
|
Active thread count |
|
Supported frameworks for connection pools
Agent versions 4.1.x and later
Supported frameworks: DBCP (>2.0), Vibur DBCP (>11.0), c3p0 (>0.9.2), Druid, HikariCP (>3.0), Jedis (>3.0), Lettuce (>5.0), Redisson (>3.0), tomcat-dbcp (>8.0), and tomcat-jdbc (>8.0).
The following metrics are collected:
|
Metric name |
Supported framework |
Description |
|
|
DBCP, c3p0, Vibur DBCP, Druid, HikariCP, Jedis, Lettuce, Redisson, tomcat-dbcp, tomcat-jdbc |
The connection count. You can distinguish between active and idle connections by state. |
|
|
DBCP, Jedis, Druid, HikariCP, Lettuce, tomcat-dbcp, tomcat-jdbc |
The minimum number of idle connections. This is a static configuration and does not typically change. |
|
|
DBCP, Jedis, Druid, Lettuce, tomcat-dbcp, tomcat-jdbc |
The maximum number of idle connections. This is a static configuration and does not typically change. |
|
|
DBCP, Druid, Vibur DBCP, HikariCP, tomcat-dbcp, tomcat-jdbc |
The maximum connection count. This is a static configuration and does not typically change. |
|
|
c3p0, HikariCP, Jedis, tomcat-dbcp, tomcat-jdbc |
The number of pending connection requests. |
Agent versions earlier than 4.1.x
For OkHttp2 and OkHttp3, the following metrics are collected:
|
Metric name |
Metric |
|
Active connection count |
|
|
Current connection count |
|
For Apache HttpClient, the following metrics are collected:
|
Metric name |
Metric |
|
Current connection count |
|
|
Maximum connection count |
|
|
Waiting queue size |
|
For Druid, the following metrics are collected:
|
Metric name |
Metric |
|
Active connection count |
|
|
Maximum connection count |
|
For HikariCP, the following metrics are collected:
|
Metric name |
Metric |
|
Active connection count |
|
|
Maximum connection count |
|