Server-side errors -- particularly 5xx responses -- are among the hardest to troubleshoot because the root cause often hides deep in business logic. Traditional log-based debugging requires SSH access, manual log searches, and guesswork across distributed services.
Application Real-Time Monitoring Service (ARMS) eliminates this overhead through bytecode instrumentation. After you install the ARMS agent, it automatically captures, aggregates, and tracks exceptions -- no code changes required. From a single console you can identify when an exception first appeared, how often it recurs, and which method call triggered it.
This approach is especially useful when you need to:
Determine the time and frequency of a specific exception across a distributed cluster.
Compare today's exceptions against yesterday's, or post-release exceptions against pre-release baselines.
Retrieve the full request context -- parameters, upstream calls, and downstream calls -- for a specific exception.
Trace a failed transaction referenced in a support ticket back to its root cause.
How it works
The diagnostic workflow has three stages:
Install the ARMS agent on your application to start collecting exception data automatically.
Review exception statistics to identify trends, spikes, and the most frequent error types.
Trace exceptions to root cause by drilling into call snapshots and method stacks.
Prerequisites
Install the ARMS agent on your application. Choose the method that matches your deployment:
Java application: Manually install an ARMS agent
Java application in Container Service for Kubernetes (ACK): Automatically install an ARMS agent in ACK
Java application in an open-source Kubernetes cluster: Automatically install an ARMS agent in a Kubernetes environment
After installation, the agent begins collecting metrics automatically with day-over-day and week-over-week comparisons. Tracked metrics include average response time, request count, errors, real-time instances, full GC events, slow SQL queries, exceptions, and slow calls.
Review exception statistics
Use the ARMS console to identify which exceptions occur most frequently and how trends change over time.
Log on to the ARMS console.
In the left-side navigation pane, choose Application Monitoring > Applications.
In the top navigation bar, select the region where your application is deployed.
On the Applications page, click the name of your application.
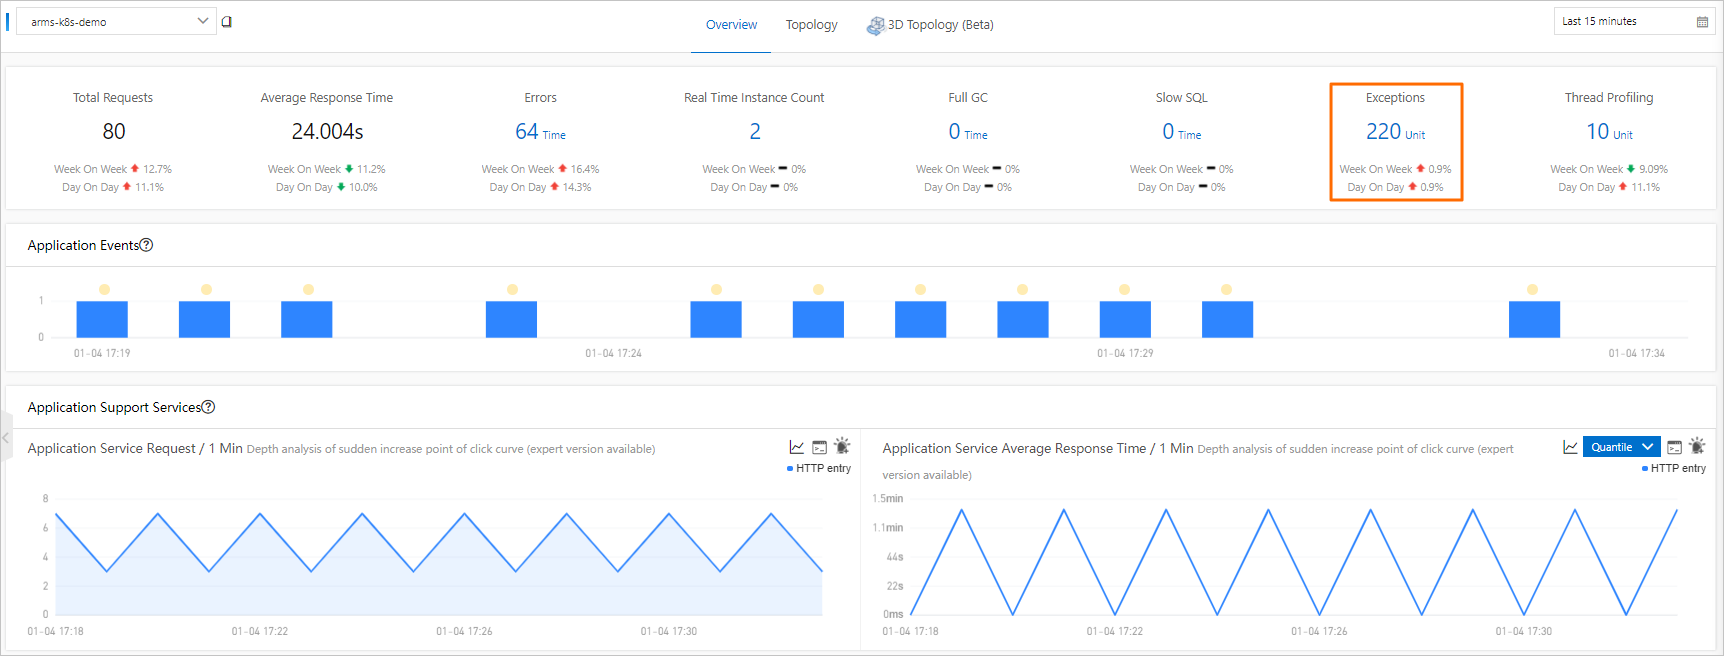
On the Application Overview page, click the Overview tab. The lower section displays the total number of exceptions and day-over-day and week-over-week changes.
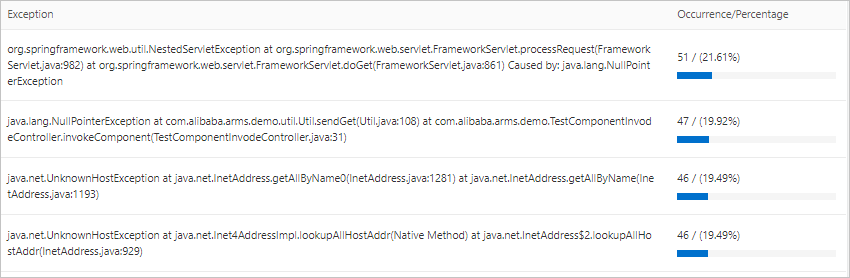
Scroll down to the Statistics Analysis section and locate Exception Type. This breakdown shows how many times each exception type has occurred.
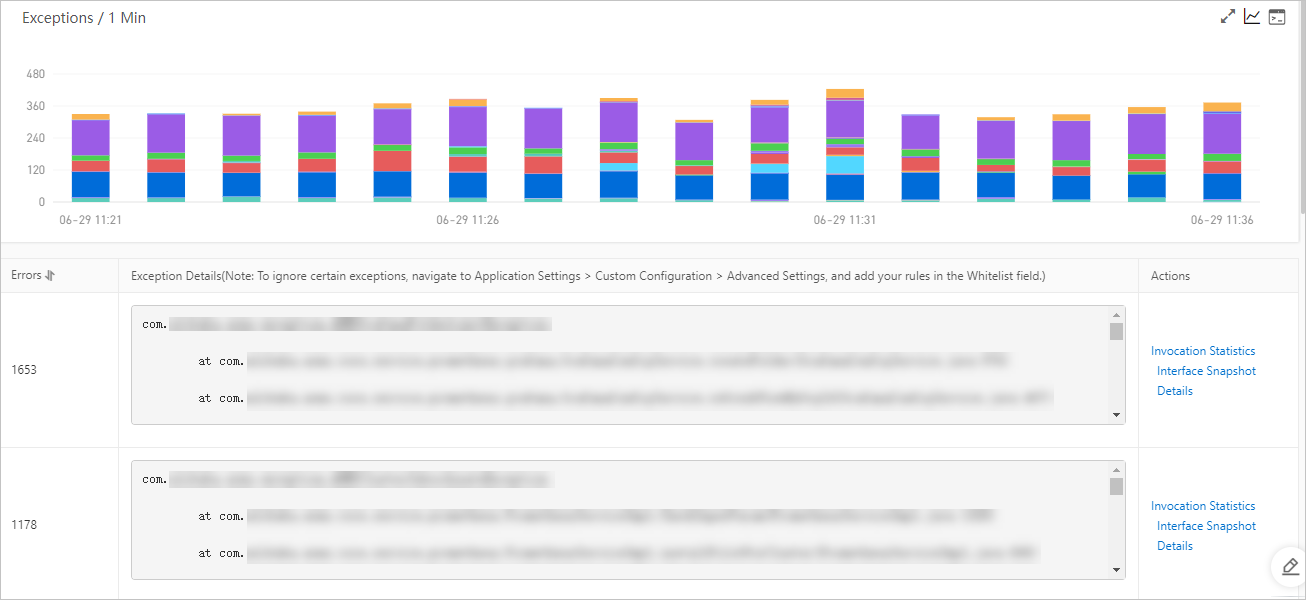
In the left-side navigation pane, click Application Details. On the Application Details page, click the Exception Analysis tab to view exception statistics charts, error counts, and exception stacks.
Trace an exception to its root cause
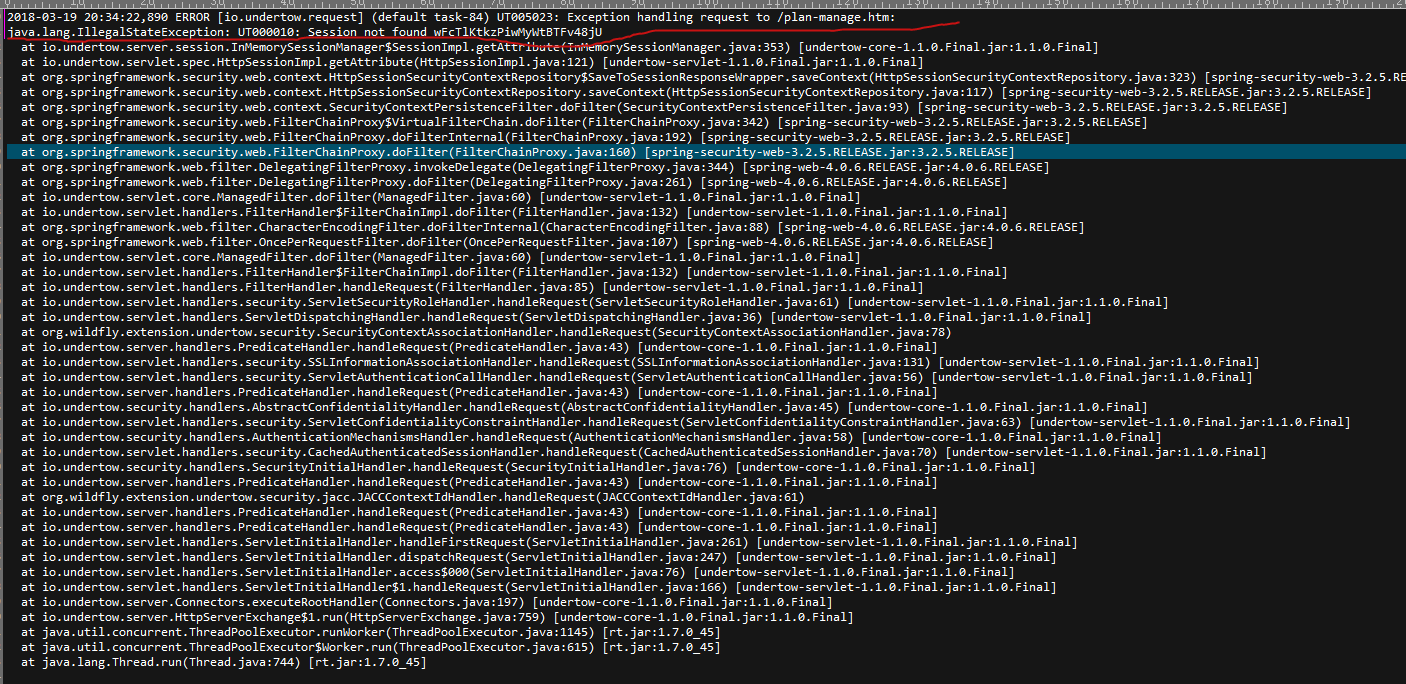
Exception statistics show what is failing, but not why. A stack trace in a log file tells you which line threw the exception, but lacks the full upstream and downstream call context and request parameters.
ARMS addresses this gap through bytecode instrumentation: it captures complete upstream and downstream call snapshots for every exception with minimal performance overhead. This gives you the full request context -- parameters, call chain, and method stack -- needed to identify root causes.
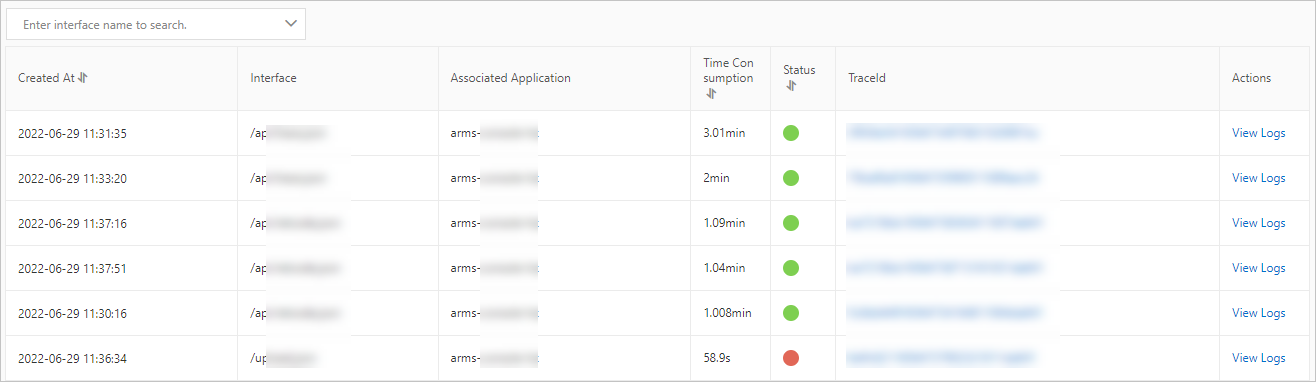
On the Exception Analysis tab, find the exception type to diagnose and click Interface Snapshot in the Actions column. The Interface Snapshot tab displays call traces associated with this exception type.
Click the TraceId of a specific call to open its full trace.
NoteFor advanced trace filtering, see Trace query.
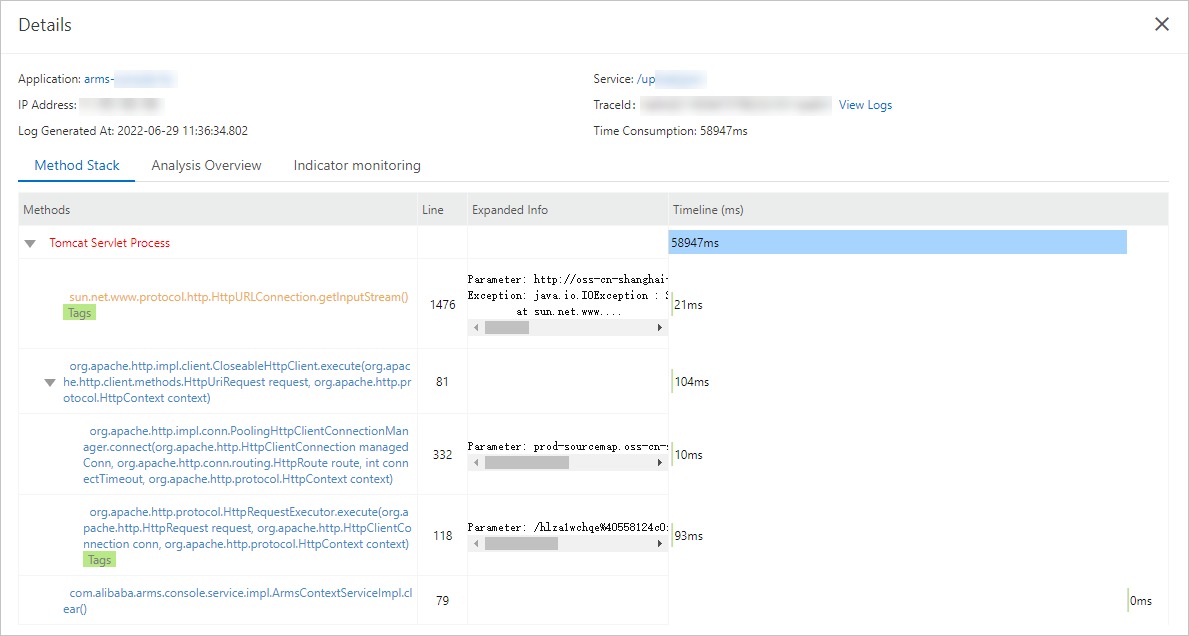
On the trace details page, review the complete call chain. In the Method Stack column, click the magnifier icon to inspect the method stack and understand the full execution context of the failed call.
After you identify the root cause, fix the underlying code. To resolve additional exceptions, return to the Interface Invocation tab and review other failed calls.
Set up proactive alerting
Configure alert rules so your team is notified the moment an exception occurs, rather than discovering it after the fact. You can create alert rules for a specific API or all APIs in your application. For details, see Application Monitoring alert rules.