This feature lets you monitor interface invocation details for an application. These details include SQL analysis, NoSQL analysis, exception analysis, error analysis, upstream and downstream services, and Traces.
Access from the ARMS console
Log on to the ARMS console. In the left-side navigation pane, choose .
On the Application List page, select the region in the top navigation bar and then click the name of the application.
NoteIcons in the Language column have the following meanings:
 : a Java application connected to Application Monitoring.
 : a Golang application connected to Application Monitoring.
 : a Python application connected to Application Monitoring.
-: an application connected to Managed Service for OpenTelemetry.
-
In the left-side navigation pane, click Interface Invocation.
Supported frameworks
This feature automatically discovers and monitors interfaces provided by the following web frameworks and remote procedure call (RPC) frameworks:
-
Tomcat 7+
-
Jetty 8+
-
Resin 3.0+
-
Undertow 1.3+
-
WebLogic 11.0+
-
SpringBoot 1.3.0+
-
HSF 2.0+
-
Dubbo 2.5+
Overview
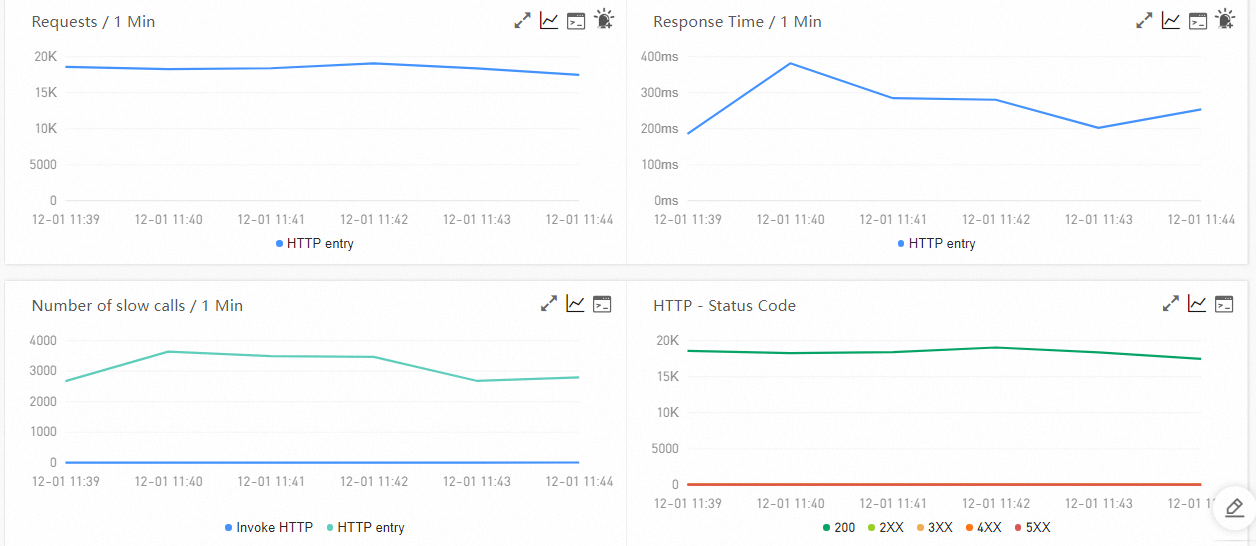
On the Overview tab, you can view time-series charts of the target interface's request count, response time, error count, and HTTP status code statistics.
Topology view
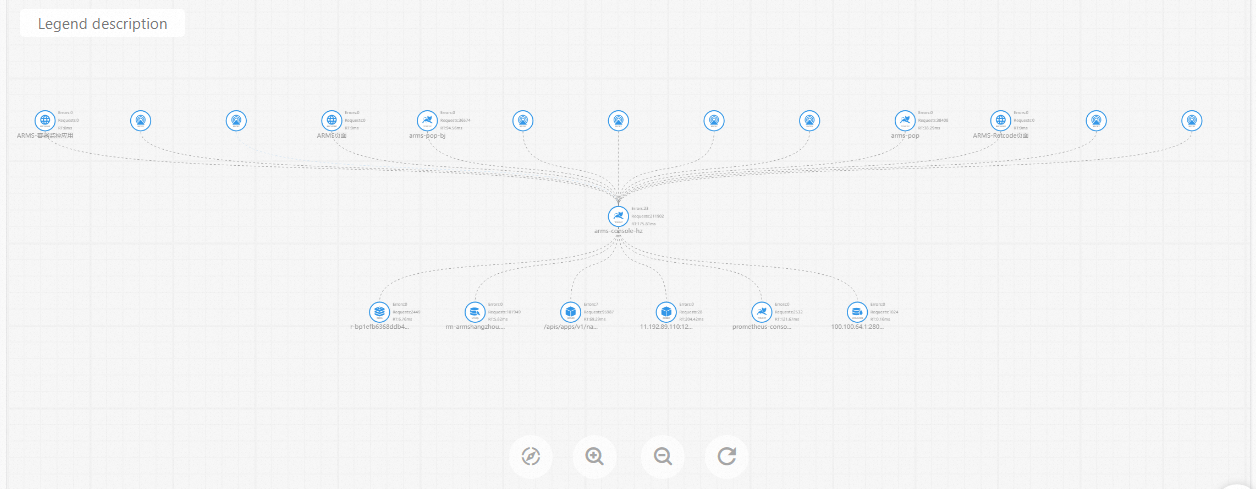
On the Topology View tab, you can view the target interface's detailed invocation topology.
SQL and NoSQL analysis
The SQL Call Analysis and NoSQL analysis tabs display a list of SQL and NoSQL requests initiated from the code of the selected service. You can use these tabs to identify which SQL or NoSQL statement is slowing a service. You can also click Call chain query for a specific SQL or NoSQL statement to view its full execution trace. For more information, see Traces.
Exception analysis
The Exception Analysis tab displays the Java exceptions thrown from the code of the selected service. You can also click Call chain query for a specific exception to view the full trace that contains the exception stack. For more information, see Traces.
Error analysis
The Error Analysis tab displays error and HTTP status code statistics for the application. You can also click a TraceId to view its corresponding trace details. For more information, see Traces.
Upstream and downstream services
The Upstream Trace and Downstream Trace tabs list the interfaces and performance metrics of upstream services (callers of the application) and downstream services (services called by the application). Performance metrics include response time, number of requests, and number of errors.
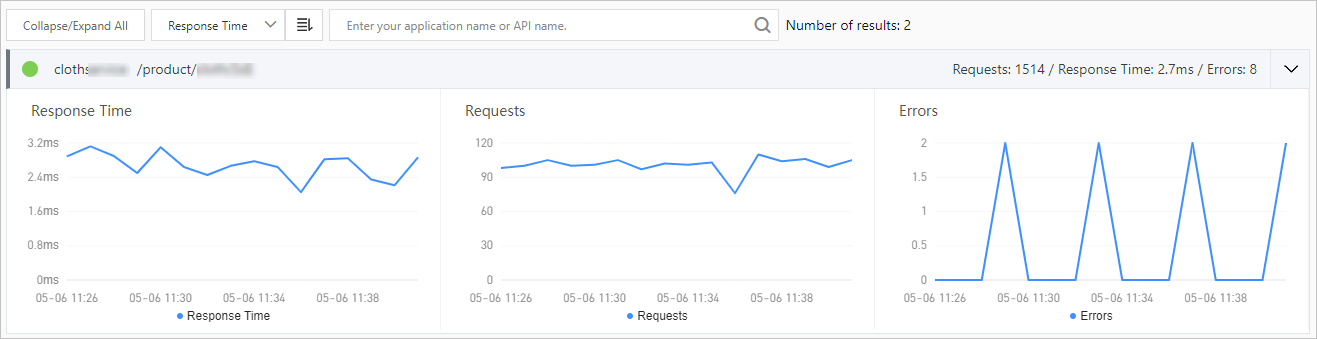
On the Upstream Trace and Downstream Trace tabs, you can perform the following operations:
-
At the top of the tab, click Collapse/Expand All to collapse or expand all interfaces listed below.
-
In the search box at the top of the tab, enter a keyword for an application name or an interface (span) name and click the search icon to filter for matching interfaces.
-
To expand or collapse an interface's performance metrics, click its panel or the arrow at the end of its row.
Traces
The Call chain query tab shows parameter details for the service interface, along with two related charts: one for the total number of traces and another for trace response times.
-
The Total Traces chart shows the total number of traces and the number of slow traces. A trace is defined as slow if its response time exceeds 500 milliseconds. This threshold is configurable in your application settings. This count does not include sub-traces generated by asynchronous calls to local APIs.
-
Data in the trace response time chart is derived from sampled trace details, so its accuracy depends on the sampling rate.
-
In the list of traces, click a TraceId to view the trace details. For more information, see Trace details.
-
Click View Logs to view the invocation logs for the interface.
NoteYou must associate trace IDs with the business logs of an application. This way, when an error occurs in the application, you can access the business logs that are associated with trace IDs to troubleshoot the error. For more information, see Associate trace IDs with Java business logs.