Each ApsaraMQ for RocketMQ instance edition enforces a Service Level Agreement (SLA) that guarantees messaging transactions per second (TPS) and message storage. Instance performance is fully managed, but keeping usage within specification limits is your responsibility. Without proactive alerts, throttling, message accumulation, and dead-letter message generation can go undetected until they disrupt production workloads. ApsaraMQ for RocketMQ integrates with CloudMonitor to provide free, ready-to-use monitoring and alerting. Configure alert rules to detect these risks before they affect your business.
Monitoring categories
Monitoring covers three areas:
| Category | What it detects | Risk if unmonitored |
|---|---|---|
| Instance usage | Actual usage approaching or exceeding the specification limit | ApsaraMQ for RocketMQ throttles the instance, causing messages to fail to send or receive |
| Business logic errors | Errors during message sending and receiving, including dead-letter messages and throttling events | Incomplete message processing and recurring failures go unnoticed |
| Performance metrics | Response time (RT), message accumulation, and consumption delay | Performance degradation propagates to downstream systems |
Recommended alerts
The following table summarizes which alerts to configure, when to set them up, and who should respond. For all available metrics, see Dashboard and Monitoring and alerting.
| Category | Alert | When to configure | Responsible team |
|---|---|---|---|
| Resource usage | API calls on an instance | After instance creation | Resource operators |
| Messaging performance | Message sending TPS in a topic | After business launch | Resource operators, Business developers |
| Messaging performance | Message receiving TPS in a consumer group | After business launch | Resource operators, Business developers |
| Messaging performance | Message accumulation in a consumer group | After business launch | Resource operators, Business developers |
| Messaging performance | Consumption delay time in a consumer group | After business launch | Resource operators, Business developers |
| Messaging errors | Dead-letter message generation | After business launch | Resource operators, Business developers |
| Messaging errors | Throttling occurrences | After instance creation (instance-level); After business launch (topic/group-level) | Resource operators, Business developers |
Create an alert rule
Log on to the ApsaraMQ for RocketMQ console. In the left-side navigation pane, click Instances.
In the top navigation bar, select a region, such as China (Hangzhou). On the Instances page, click the name of the instance that you want to manage.
In the left-side navigation pane, click Monitoring and Alerts. In the upper-left corner of the page, click Create Alert Rule.
Configure and respond to alerts
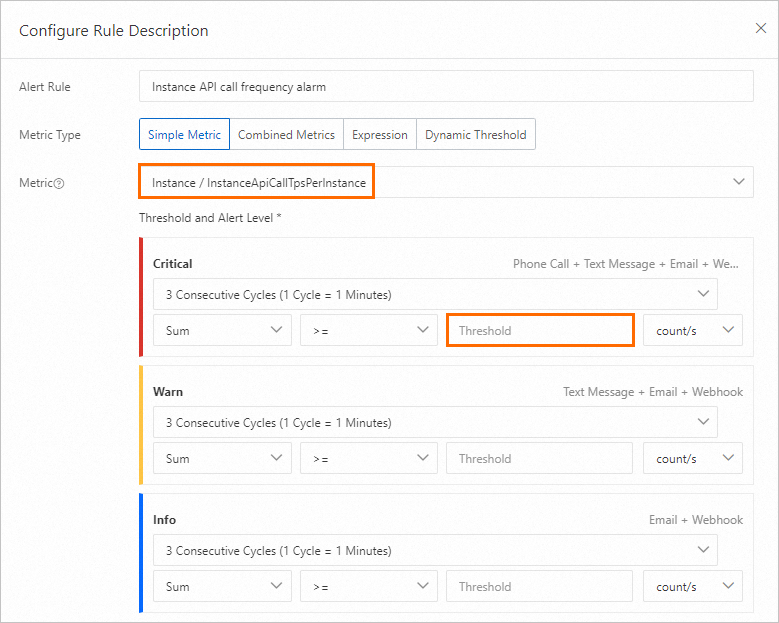
API calls on an instance
The number of API calls for sending and receiving messages is measured by messaging TPS. Each instance has a peak messaging TPS limit -- for example, 5,000 for a Standard Edition instance. When usage exceeds this limit, the instance is throttled and messages fail to send or receive.
When to configure: Immediately after instance creation.
Recommended threshold: 70% of the peak messaging TPS. For example, if the peak TPS is 10,000, set the threshold to 7,000. Find the peak messaging TPS on the Instance Details page in the console.

When this alert fires:
Open the Instance Details page and click the Dashboard tab.
In the Overview of instance message volume section, check the TPS Max value curve under Metrics related to instance request times (production and consumption).
In the Message Business Metrics Overview section, review the curves in Message production rate top20 Topics (bar/minute) and message consumption rate top20 GroupIDs (per minute). Identify which topic or group shows abnormal traffic and assess whether the change aligns with expected business behavior.
If the traffic increase is unexpected, investigate with the application team.
If the traffic increase is expected, upgrade the instance configurations. For more information, see Upgrade or downgrade instance configurations.
Message sending TPS in a topic
This metric tracks the number of messages sent per minute in a specific topic, giving visibility into traffic volume per business component. Without this alert, traffic drops to zero or unexpected spikes go undetected.
When to configure: After your business traffic stabilizes.
Recommended threshold: Base the threshold on observed traffic volume after business stabilization.

When this alert fires:
On the Topics page, click the name of the topic specified in the alert rule.
On the Topic Details page, click the Dashboard tab.
Check the Production curve in Message volume (pieces/minute). Determine whether the traffic change aligns with expected business behavior.
Message receiving TPS in a consumer group
This metric tracks the number of messages consumed per minute in a specific consumer group. Without this alert, consumption slowdowns or stalls go unnoticed.
When to configure: After your business traffic stabilizes.
Recommended threshold: Base the threshold on observed traffic volume after business stabilization.

When this alert fires:
On the Groups page, click the ID of the group specified in the alert rule.
On the Group Details page, click the Dashboard tab.
Check the Consumption curve in Trend of message production and consumption rate (bar/minute). Determine whether the traffic change aligns with expected business behavior.
Message accumulation and consumption delay
Message accumulation in a consumer group
When real-time message processing is required, unchecked accumulation degrades downstream systems.
When to configure: After your business traffic stabilizes.
Recommended threshold: Base the threshold on the actual performance requirements of your business.

When this alert fires:
On the Groups page, click the ID of the group specified in the alert rule.
On the Group Details page, click the Dashboard tab.
Check the Accumulation curve in Stacking related indicators (bars). Identify when accumulation started and analyze its trend.
Correlate the start time with business changes and application logs. For more information, see How can I handle accumulated messages?
Based on the root cause, either scale out consumer applications or fix the consumption logic.
Consumption delay time in a consumer group
Consumption delay time provides a time-based view of message accumulation. This is particularly useful for workloads with strict latency requirements.
When to configure: After your business traffic stabilizes.
Recommended threshold: Base the threshold on the actual performance requirements of your business.

When this alert fires:
On the Groups page, click the ID of the group specified in the alert rule.
On the Group Details page, click the Dashboard tab.
Check the Accumulation curve in Stacking related indicators (bars). Identify when accumulation started and analyze its trend.
Correlate the start time with business changes and application logs. For more information, see How can I handle accumulated messages?
Based on the root cause, either scale out consumer applications or fix the consumption logic.
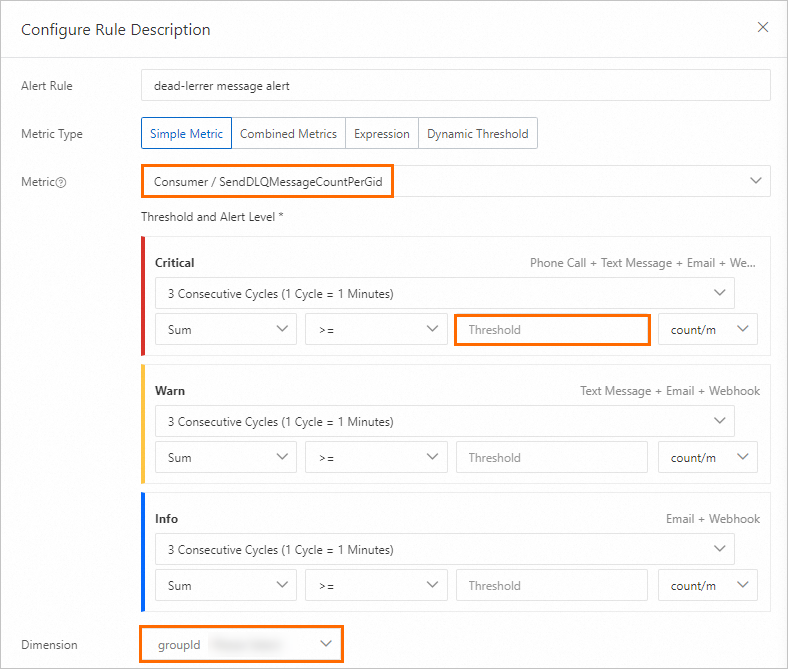
Dead-letter messages
Messages that fail after the maximum number of consumption retries are moved to dead-letter queues. These messages are messages that cannot be correctly processed by consumers. Consumption applications must handle dead-letter messages. Without alerts, such failures go unnoticed.
When to configure: After your business traffic stabilizes.
Recommended threshold: Base the threshold on observed traffic volume after business stabilization.

When this alert fires:
Query the dead-letter messages and analyze the original message content. For more information, see Dead-letter queues.
Query the consumption traces by topic and message ID to identify the failure cause. For more information, see Query a message trace.
Fix the consumption logic or handle the problematic messages based on the root cause.
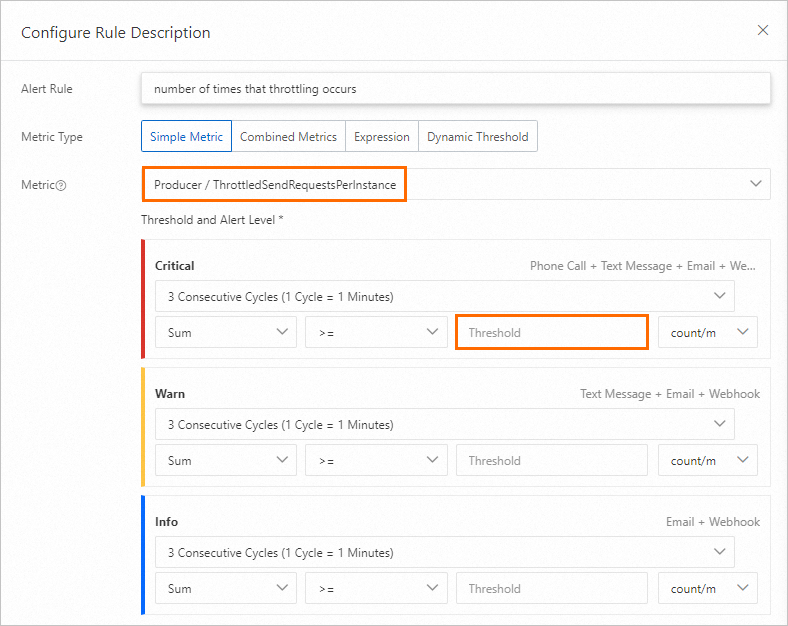
Throttling occurrences
Throttling events mean traffic has exceeded the specification limit. Frequent throttling indicates the current instance configuration is undersized for the workload.
When to configure: Configure instance-level throttling alerts after instance creation. Configure topic-level and group-level throttling alerts after your business traffic stabilizes.
Recommended threshold: Base the threshold on the actual performance requirements of your business.

When this alert fires:
Open the Instance Details page and click the Dashboard tab.
In the Overview of instance message volume section, check the Number of throttling requests curve. Note when throttling occurred and its pattern.
In the Message Business Metrics Overview section, review the Message production rate top20 Topics (bar/minute) curve. Identify which topic triggered throttling and whether the traffic increase is expected.
If the traffic increase is expected, upgrade the instance configurations. Otherwise, investigate and resolve the abnormal traffic source.
Related topics
Dashboard -- View real-time metrics for your instance.
Monitoring and alerting -- Configure additional fine-grained alert rules.
Upgrade or downgrade instance configurations -- Scale your instance when usage approaches the specification limit.
How can I handle accumulated messages? -- Troubleshoot message accumulation issues.