Overview
This topic describes how to view the performance metrics of a tenant.
View tenant performance monitoring
Log on to the ApsaraDB for OceanBase console.
In the left-side navigation pane, click Instances.
In the instance list, click the name of the target cluster instance to go to the Cluster Instance Workspace page.
In the left-side navigation pane, click Tenant Management. In the tenant list, click the target tenant to go to the Tenant Workspace page.
On the Tenant Workspace, you can view partial monitoring chart information displayed by default.

Click Performance Monitoring in the left-side navigation pane or click on More in the top right corner of the Performance Monitoring section, to access the cluster monitoring page.
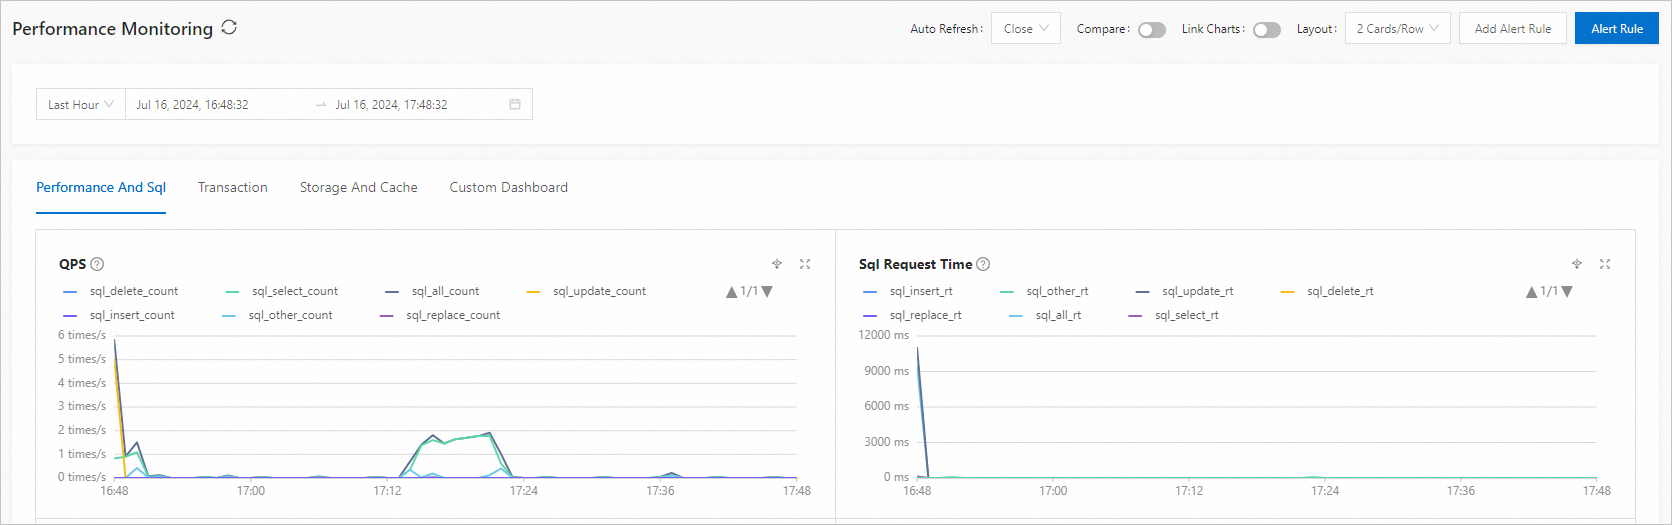
On the Performance Monitoring page, you can switch between Performance and SQL, Transaction, and Storage and Cache tabs to view the sub-metrics of all metrics in each monitoring group.
Monitoring Common Functions
OceanBase provides multiple viewing methods for monitoring data, including filtering, comparison, and more, allowing you to present charts in various styles to accommodate a wide range of application scenarios. You can leverage the following functionalities to customize chart displays.
Filter monitoring indicators
In a monitoring chart, you can click the name of a tenant or a node to show or hide its monitoring data.

Auto Refresh
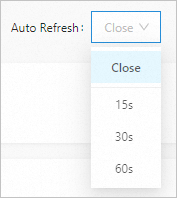
At the top of page,Click on the dropdown box on the right to Auto Refresh. You can select 15s, 30s, or 60s to configure the automatic refresh frequency of cluster monitoring. When selected to Close, monitoring data will not be automatically refreshed.
Comparison of time periods
You can turn on the Compare switch in the upper-right corner and specify a period to compare the monitoring data. The solid line represents the data during the baseline period, and the dotted line represents the data during the specified period.
After setting the reference period, you can quickly locate the time for comparison by clicking on the buttons for Previous period, Same period of the previous day, and The same period of the previous week. You can also edit the time period that needs to be compared by yourself.

Link charts
You can turn on the Link Charts switch in the upper-right corner. This way, when you move the pointer on a monitoring chart, the corresponding data at the specific point in time of other charts is displayed.

Chart layout
At the top of page,Click on the dropdown box on the right to layout. You can then choose the desired format to change the layout of the current monitoring panel.
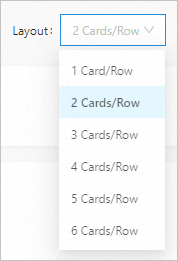
For example, when selecting 4 cards/Row, the interface will display as follows:

Drill-Down monitoring
On each monitoring metric icon, you can click the drill-down icon ![]() to view the detailed sub-metrics of the selected monitoring indicator. For more information, see Drill-down tenant performance monitoring.
to view the detailed sub-metrics of the selected monitoring indicator. For more information, see Drill-down tenant performance monitoring.

Alert management
You can also create and view alert rules by clicking the corresponding buttons in the upper-right corner. For more information, see Add an alert rule and Manage alert rules.
Custom Dashboard
Click on the Custom Reports tab and then select a tenant and configure metrics for the custom monitoring panel. For more information, see Customize a monitoring report for a tenant.
Diagnose Tenant
Within the monitoring chart, by left-clicking and dragging to select a specific time range, you can click on Diagnose Tenant to perform issue diagnostics on the current tenant.

On the Tenant Diagnostics page, you can view the diagnostic results for the specified object. Tenant diagnostics include Real-time Diagnostics, Optimization Center, Capacity Center, and Security Center. By clicking on View More, you can navigate to the autonomous services for more detailed information. For more information, see Overview of Autonomy Service.
