View storage and cache monitoring details
On the storage and cache monitoring details page of a tenant, you can view monitoring data such as the storage usage, read/write speed, and cache usage of the tenant.
View storage and cache monitoring data
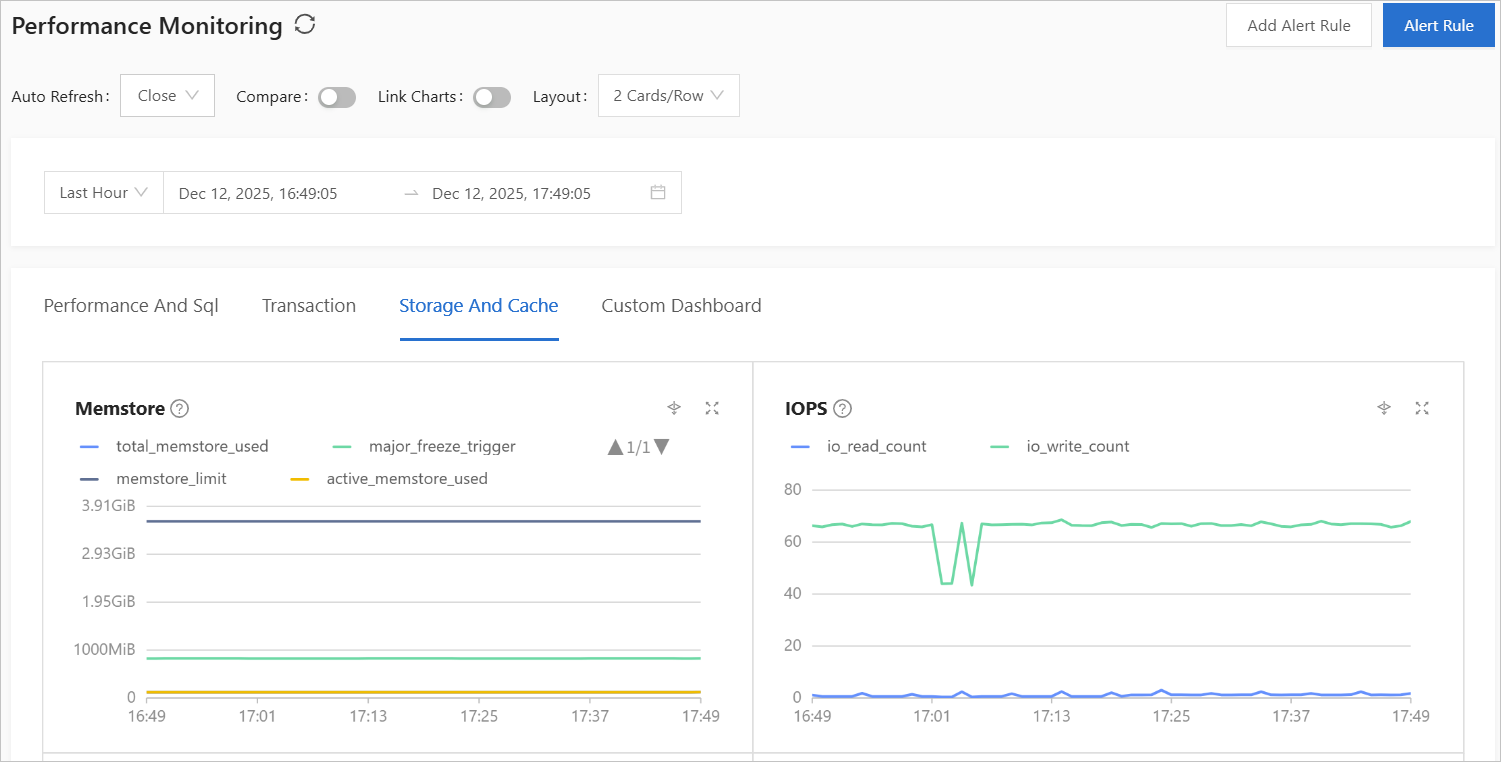
By default, the Storage and Cache tab displays the MemStore usage, storage read/write speed, and cache usage in the last hour. You can specify a time period or click fields in a chart to filter the data to view.
The following table describes the performance metrics.
You can click the question mark (?) next to a monitoring metric to view its details.
Monitoring item | Metric | Unit | Description |
MemStore | MiB | The MemStore usage of the tenant. | |
IOPS | Times/s | The average number of I/O operations per second in the tenant. | |
IO RT | μs | The average time consumed in each read or write operation in the tenant. | |
IO Throughput | MiB | The average amount of data read or written per second in the tenant. | |
Cache Size | MiB | The size of a specific type of cache in the tenant. | |
Cache Hit Ratio | % | The hit rate of a specific type of cache in the tenant. | |
Cache Request Count | Times/s | The number of a specific type of cache requests per second in the tenant. | |
Vector Index Data Size |
| MiB |
|
Vector Index Data Usage (%) | ob_tenant_vector_mem_used_percent | % | The memory usage of vector index data. |
Binlog Disk Usage | ob_tenant_binlog_disk_used | GiB | The size of disk space occupied by binlogs. |
Memory Usage of OceanBase Tenant | ob_tenant_memory_percent | % | The memory usage of the tenant. |
Total Log Disk Size | ob_tenant_log_disk_total_bytes | GiB | The total size of the log disk. |
Log Disk Usage | ob_tenant_log_disk_used_bytes | GiB | The used space of the log disk. |
Data Usage | ob_tenant_server_required_size | GiB | The disk space used by data. |
Data Amount | ob_tenant_server_data_size | GiB | The volume of data. |