Customize a monitoring report for a tenant
On the performance monitoring page of a tenant, you can configure general monitoring metrics for the custom monitoring panel.
Manage tenant custom reports
Log on to the ApsaraDB for OceanBase console.
In the left-side navigation pane, click Instances.
In the instance list, click the name of the target cluster instance to go to the Cluster Instance Workspace page.
In the left-side navigation pane, click Tenant Management. In the tenant list, click the target tenant to go to the Tenant Workspace page.
Click Performance Monitoring in the left-side navigation pane.
On the performance monitoring page of a tenant, click Custom Dashboard.
Manage reports within the Custom Reports tab.
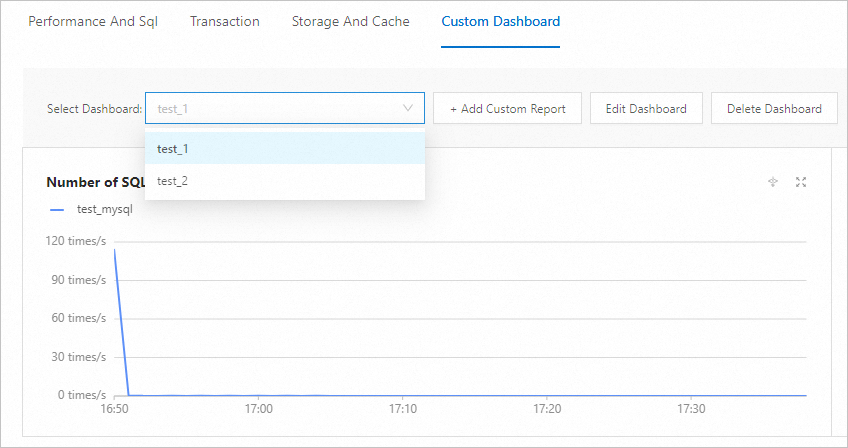
View Custom Reports
Within the Custom Dashboard tab, you can manage your custom reports. Then you can select the desired custom report by using the 'Choose Report' function to specify which report you wish to view.
Add a Custom Report
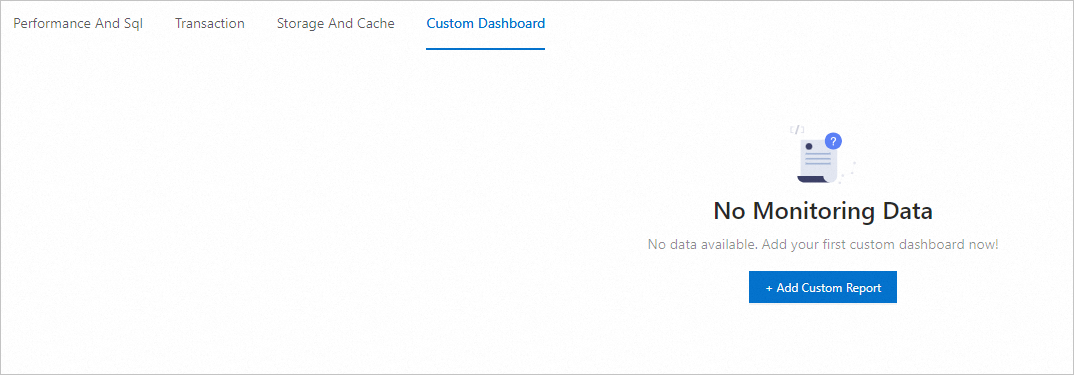
Within the Custom Dashboard tab, click Add Custom Report.
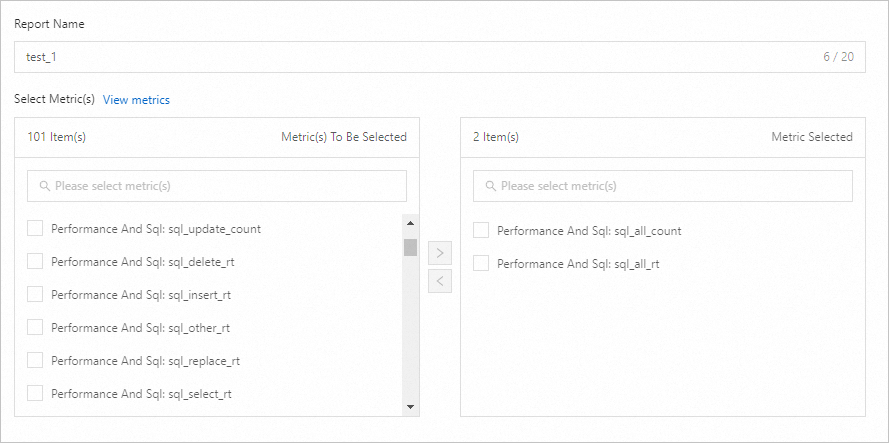
When creating a custom report for the first time, the interface appears as follows:
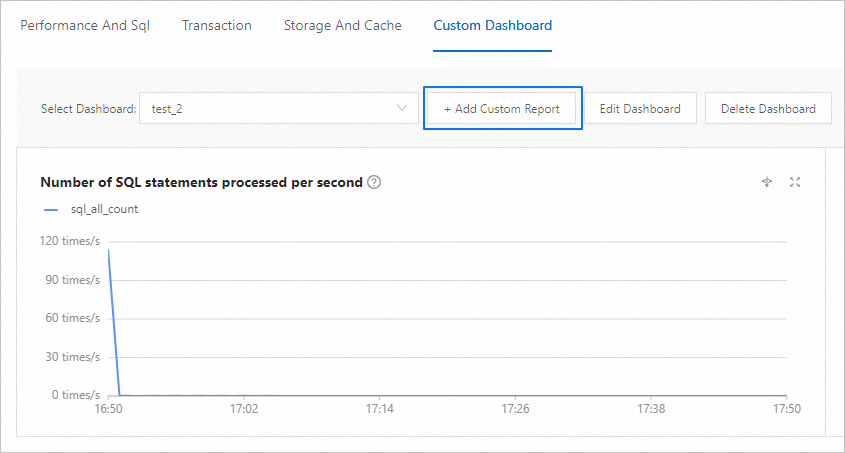
If custom reports already exist, the interface will appear as follows:
Enter the name of the monitoring report, select the tenant for which you want to create the report, and select metrics for the report.
NoteThe name of the report cannot exceed 20 characters in length.
At present, you can create at most seven custom monitoring reports.

click OK.
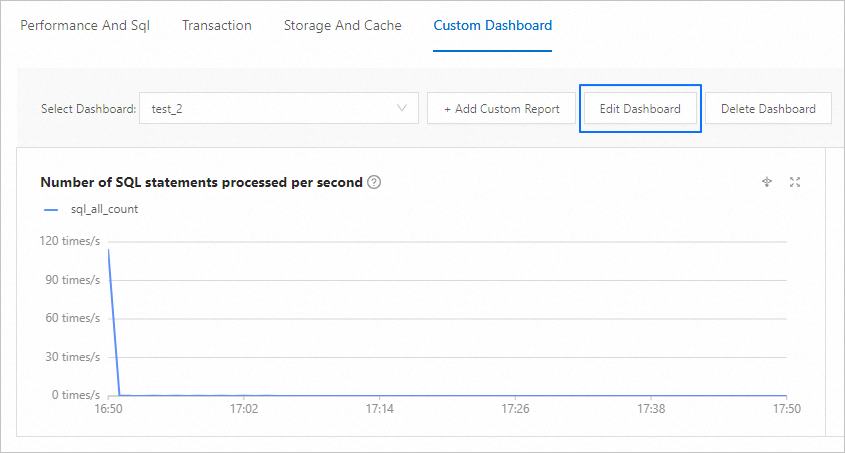
Edit a custom report
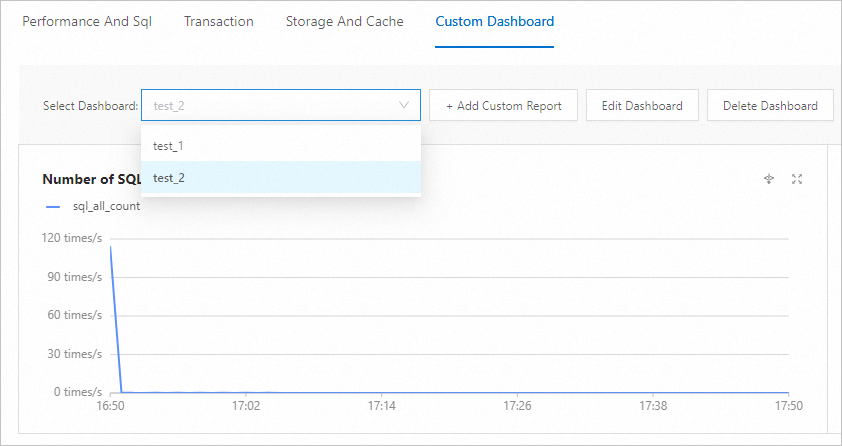
Within the Custom Dashboard tab, choose the target custom report.
click Edit Dashboard.

On the Edit Custom Report page, modify the report name, tenant, and metrics. For more information about the metrics, see Metrics.
Click OK.
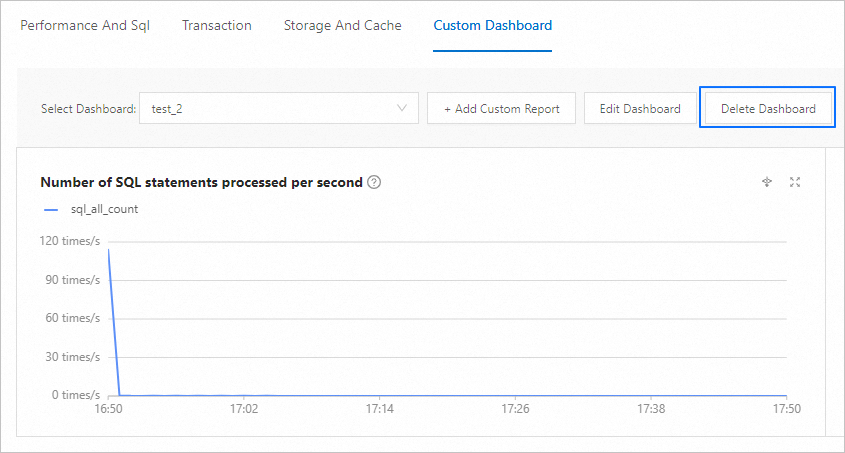
Delete a custom report
Within the Custom Dashboard tab, choose the target custom report.
click Delete Dashboard.
In the pop-up window that appears, click OK.


Monitoring Indicator List
Monitoring item | Metric | Description |
Performance and SQL | sql_all_count | The number of SQL statements processed per second. |
sql_delete_count | The number of DELETE statements processed per second. | |
sql_insert_count | The number of INSERT statements processed per second. | |
sql_other_count | The number of other statements, such as data definition language (DDL), data control language (DCL), and data transaction language (DTL) statements, processed per second. | |
sql_replace_count | The number of REPLACE statements processed per second. | |
sql_select_count | The number of SELECT statements processed per second. | |
sql_update_count | The number of UPDATE statements processed per second. | |
sql_all_rt | The average time consumed in processing an SQL statement. | |
sql_delete_rt | The average time consumed in processing a DELETE statement. | |
sql_insert_rt | The average time consumed in processing an INSERT statement. | |
sql_other_rt | The average time consumed in processing a DDL, DCL, or DTL statement. | |
sql_replace_rt | The average time consumed in processing a REPLACE statement. | |
sql_select_rt | The average time consumed in processing a SELECT statement. | |
sql_update_rt | The average time consumed in processing an UPDATE statement. | |
active_session | The number of active sessions. | |
all_session | The total number of sessions. | |
sql_distributed_count | The number of distributed execution plans processed per second. | |
sql_local_count | The number of local execution plans processed per second. | |
sql_remote_count | The number of remote execution plans processed per second. | |
system_event_internal_total_waits | The number of internal wait events that occur per second. | |
system_event_io_total_waits | The number of I/O wait events that occur per second. | |
system_event_latch_total_waits | The number of latch wait events that occur per second. | |
system_event_other_total_waits | The number of other types of wait events that occur per second. | |
system_event_row_lock_wait_total_waits | The average wait time for each lock. | |
system_event_sync_rpc_total_waits | The average wait time of a synchronous RPC wait event. | |
wait_event_count | The number of wait events that occur per second. | |
system_event_internal_time_waited | The average wait time of an internal wait event. | |
wait_event_rt | The average wait time of a wait event. | |
request_dequeue_count | The number of requests exiting the queue. | |
request_enqueue_count | The number of requests entering the queue. | |
request_queue_time | The time consumed by an SQL statement waiting in a queue. | |
ob_cpu_percent | The CPU utilization. | |
memstore_percent | The MemStore usage. | |
rpc_packet_in_rt | The average time spent in receiving an RPC packet. | |
rpc_packet_out_rt | The average time spent in sending an RPC packet. | |
rpc_packet_in | The RPC packet receiving throughput. | |
rpc_packet_out | The RPC packet sending throughput. | |
Transaction | transaction_commit_count | The number of transactions committed per second. |
transaction_count | The number of transactions processed per second. | |
transaction_rollback_count | The number of transactions rolled back per second. | |
transaction_timeout_count | The number of transactions timed out per second. | |
transaction_commit_rt | The average time consumed in committing a transaction. | |
transaction_rollback_rt | The average time consumed in rolling back a transaction. | |
transaction_rt | The average time consumed in processing a transaction. | |
trans_commit_log_count | The number of transaction logs committed per second. | |
clog_trans_log_total_size | The total size of transaction logs committed per second. | |
clog_write_disk_rt | The average time consumed in writing transaction logs to the disk. | |
trans_commit_log_sync_rt | The average time consumed by each transaction log synchronization operation over the network. | |
memstore_write_lock_fail_count | The number of failed write lock waits. | |
memstore_write_lock_succ_count | The number of successful write lock waits. | |
memstore_write_lock_wait_time | The average wait time of each write lock. | |
transaction_multi_partition_count | The number of distributed transactions per second. | |
transaction_single_partition_count | The number of regular transactions per second. | |
Storage and cache | active_memstore_used | The total size of active MemStores. |
major_freeze_trigger | The threshold for triggering a major compaction. | |
memstore_limit | The maximum total size of all MemStores. | |
total_memstore_used | The total size of MemStores. | |
io_read_count | The number of SSStore reads per second. | |
io_write_count | The number of SSStore writes per second. | |
io_read_rt | The average time spent on each SSStore read. | |
io_write_rt | The average time spent on each SSStore write. | |
io_read_size | The amount of data read from the SSStore per second. | |
io_write_size | The amount of data written to the SSStore per second. | |
block_cache_size | The size of the block cache. | |
bloom_filter_cache_size | The size of the Bloom filter cache. | |
clog_cache_size | The size of the clog cache. | |
location_cache_size | The size of the location cache. | |
plan_cache_size | The size of the plan cache. | |
row_cache_size | The size of the row cache. | |
block_cache_hit_ratio | The hit rate of the block cache. | |
bloom_filter_cache_hit_ratio | The hit rate of the Bloom filter cache. | |
clog_cache_hit_ratio | The hit rate of the clog cache. | |
location_cache_hit_ratio | The hit rate of the location cache. | |
plan_cache_hit_ratio | The hit rate of the plan cache. | |
row_cache_hit_ratio | The hit rate of the row cache. |