Event alerts notify you of DDoS attacks on your services, helping you to quickly identify and resolve issues, minimize troubleshooting, and restore services faster. This topic describes how to set up alert notifications for DDoS Basic and Anti-DDoS Native attack events.
Alerting methods
Anti-DDoS Native offers alerting through Message Center, Cloud Monitor, and Simple Log Service (SLS). Compare these methods to choose the best solution for your needs.
|
Comparison item |
Message Center alerts |
Cloud Monitor alerts |
Simple Log Service (SLS) alerts |
|
|
Supported product types |
DDoS Basic |
Anti-DDoS Native |
Anti-DDoS Native |
Anti-DDoS Native |
|
Use cases |
General alerts. Ideal for when you only need to be aware of an attack. |
General alerts. Ideal for when you only need to be aware of an attack. |
General alerts. Allows simple filtering to notify you only about key events. |
Enterprise-grade alerting. Supports custom condition combinations, alert channels, custom notification content, and statistical reports based on filters. |
|
Configuration complexity |
Simple |
Simple |
Moderate |
Complex |
|
Flexibility |
Low Supports alerts when an event starts and ends. |
Low Supports alerts when an event starts and ends. |
Medium Supports alerts for specific filtered key events when an event starts and ends. |
High Supports alerts when an event starts and ends, alerts based on a traffic threshold, and alerts based on various combined conditions. |
|
Notification methods |
|
|
|
|
|
Reliability and timeliness |
Reliability and timeliness are not guaranteed. High system concurrency can cause message throttling. Important
Consider building your own traffic monitoring system. For example, monitor traffic for IP addresses for sudden increases or decreases, or use external probes to check availability. |
High reliability. Alert latency is typically within 5 minutes. |
High reliability. Alert latency is typically 5 to 10 minutes. |
High reliability. Alert latency is typically 5 to 10 minutes. |
Configure Message Center alerts
Message Center is a notification service for your Alibaba Cloud account. It lets you configure various types of notifications for Alibaba Cloud services.
-
Log on to the Message Center console.
-
Configure alert notifications.
Notification method
Description
Internal message, and email
-
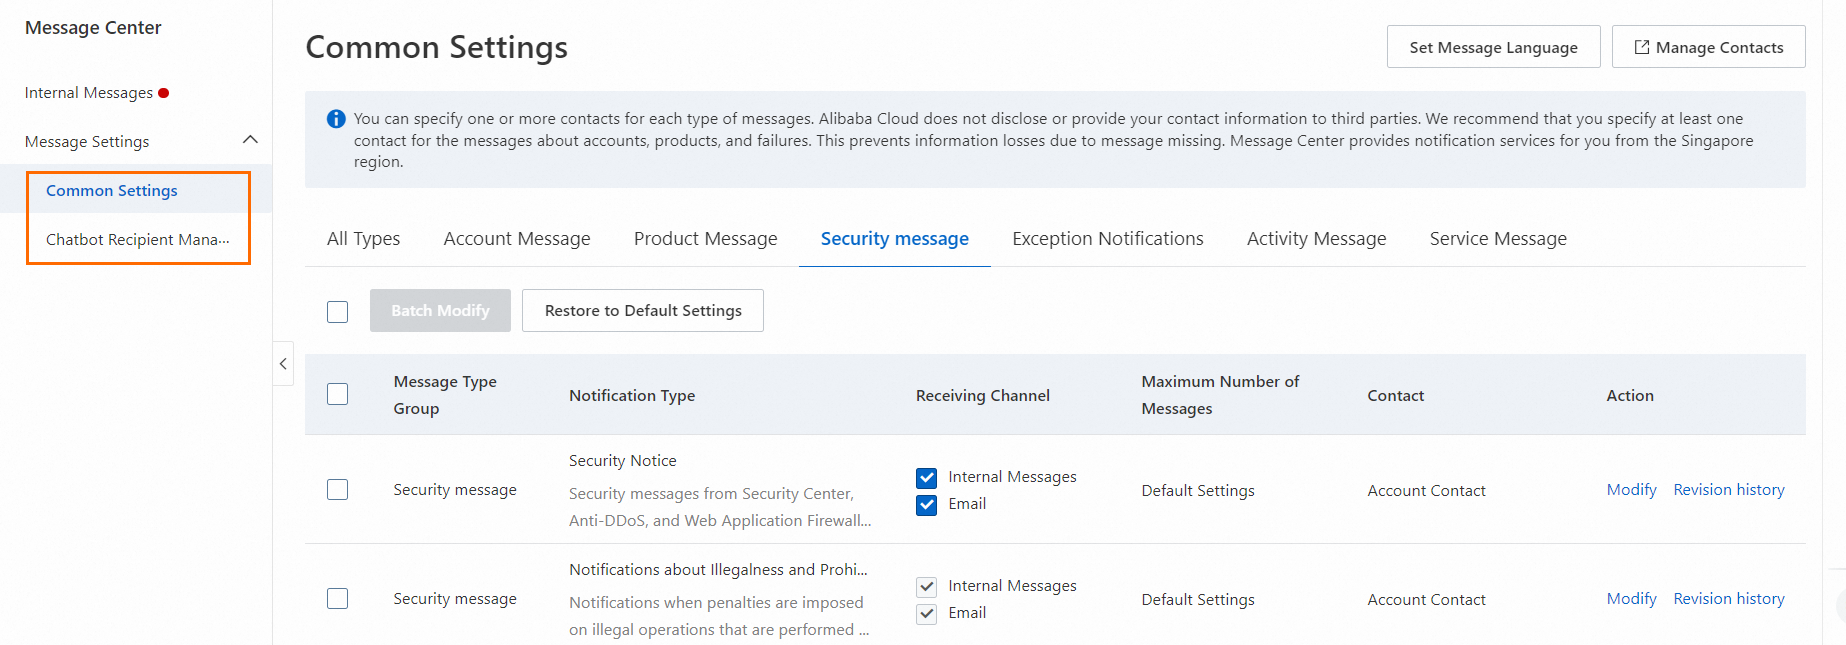
In the left-side navigation pane, click .
-
Under Security Messages, find Security Notice and select the checkboxes for Internal Messages, or Email as required.
-
Click Modify to change the message recipients.
webhook
-
In the left-side navigation pane, click .
-
Under Security Messages, find Security Notice and click Modify to add or remove a chatbot.
-
Configure Cloud Monitor alerts
Cloud Monitor is a service that monitors your Alibaba Cloud resources and internet applications. You can use Cloud Monitor to monitor blackhole and traffic scrubbing events for your Anti-DDoS Native instances. When an event occurs, Alibaba Cloud sends an alert notification to the contacts in the specified alert contact group.
- Log on to the CloudMonitor console.
-
Create an alert contact group to receive notifications.
-
Create an alert contact. If you already have a contact, skip this step.
-
In the left-side navigation pane, choose .
-
On the Alerts > Alert Contacts tab, click Create Alert Contact. Then, in the Set Alert Contact panel, fill in the contact information, complete the slider verification, and click Confirm.
-
-
Create an alert contact group. If you already have a contact group, skip this step.
NoteAlert notifications must be sent to an alert contact group. You can add one or more contacts to a group.
-
In the left-side navigation pane, choose .
-
On the Alert Contact Group tab, click Add Contact Group. In the Create Alert Contact Group panel, enter the required information, select contacts, and then click Confirm.
-
-
-
In the left-side navigation pane, choose , click Create Subscription Policy, and then click Submit to complete the alert configuration.
Section
Parameter
Description
Basic Infomation
Name
The name of the subscription policy.
Description
The description of the subscription policy.
Alert Subscription
Subscription Type
Select System Events.
Products
Select Anti-DDoS Origin.
Event Type
Select DDoS Attack.
Event name
Select the events for which you want to receive notifications. Options: blackhole, traffic scrubbing.
Event Level
Select the level of events for which to receive notifications. All DDoS alert events are of the Critical level. This parameter supports only Critical.
Application grouping
Notifications are sent only when a relevant event occurs for a resource in the specified application group.
Event Content
An alert is reported only if the reported event contains this content.
Event Resources
An alert is reported only if the reported event contains this resource.
Combined Noise Reduction
Merge Content
Select a merge dimension from the Subscription Scope of the Subscription Type.
Noise Reduction
Reduces the frequency of alert notifications. Configure this setting as needed.
Notification
Notification Configuration
When a system event or threshold-triggered event meets the alert conditions, notifications are sent directly to alert contacts or to different contacts based on the alert level.
You can select an existing notification configuration or click Create Notification Configuration to create a new one.
For details on configuring these parameters, see Manage Notification Configurations.
Custom Notification Method
Customize the alert notification method.
Click Modify next to a notification method to change its Notification Template and Alert Level.
Push and Integration
Push Channel
The channel to which alert notifications are pushed. To create a push channel:
-
Click + Add Channel.
-
Select an existing push channel, or click + Add Channel to create a new one.
For more information about how to set parameters for a push channel, see Manage Push Channels.
-
SLS alerting
After you enable the mitigation logs feature for Anti-DDoS Native, the service collects service traffic and mitigation logs from your protected assets for querying and analysis. This log data allows you to create custom alert rules with combined conditions for key business metrics. Anti-DDoS Native then sends you timely alerts when these metrics become abnormal.
Log on to the Traffic Security console,In the left-side navigation pane, choose DDoS.
In the left-side navigation pane, choose .
In the top navigation bar, select the resource group to which the instances belong and the region in which the instances reside.
Anti-DDoS Origin 1.0 (Subscription) instances: Select the region in which the instance resides.
Anti-DDoS Origin 2.0 (Subscription) and Anti-DDoS Origin 2.0 (Pay-as-you-go) instances: Select All Regions.
-
Follow the on-screen instructions to activate Simple Log Service (SLS) and grant RAM authorization. If you have already completed these steps, skip this step.
-
Enable the mitigation logs feature for the instance. If it is already enabled, skip this step.
-
On the Mitigation Logs page, find the target instance and click Upgrade Now.
-
On the Upgrade/Downgrade page, set Mitigation Logs to Enabled, then read and select the Terms of Service checkbox.
-
Click Buy Now and then click Subscribe to enable the mitigation logs feature for the instance.
-
-
Create log alert monitoring for the instance.
-
On the Mitigation Logs page, find the target instance and click the Go to SLS icon in the upper-right corner.
-
On the DDoS Logstore details page, click the
 icon in the upper-right corner, and configure the settings on the Alert Monitoring Rule tab.
Parameter
Description
Rule Name
A custom name for the alert monitoring rule.
Check Frequency
The frequency at which to check the query and analysis results.
-
Fixed Interval: Checks the query and analysis results at a fixed interval.
-
Cron: Uses a cron expression to specify the interval for checking query and analysis results. The minimum precision for a cron expression is one minute. Cron expressions use a 24-hour format. For example,
0 0/1 * * *means the check runs every hour, starting at 00:00.
Query Statistics
Click the input box. In the Query Statistics dialog box, set the query and analysis statement.
-
Associated Report: Select Anti-DDoS Native Events Report or Anti-DDoS Native Mitigation Report.
-
Advanced Settings: No change is needed. Logstore is selected by default.
Group Evaluation
Simple Log Service (SLS) supports grouping query and analysis results. For more information, see Set Group Evaluation.
-
No Grouping: Within each check cycle, only one alert is generated when the trigger condition is met.
-
Custom Label: Simple Log Service (SLS) groups the query and analysis results based on the fields you configure. After grouping, the trigger condition is evaluated for each group separately. Within each check cycle, each group that meets the trigger condition generates its own alert.
Trigger Condition
The trigger condition and severity of the alert.
-
Trigger Condition:
-
Data is returned: An alert is triggered if the query and analysis results contain data.
-
the query result contains: An alert is triggered if the query and analysis results contain N rows of data.
-
data matches the expression: An alert is triggered if the query and analysis results contain data that matches the alert expression.
-
the query result contains and matches: An alert is triggered if the query and analysis results contain N rows of data that match the alert expression.
-
-
Severity: You can set a single severity for all alerts generated by a rule, or click Create to set different severities for different conditions within the same rule.
Add Label
Simple Log Service (SLS) allows you to add identifying attributes to alerts in a key-value format. These are mainly used for alert noise reduction and notification control, meaning you can add conditions related to tags when creating an alert policy or action policy. For more information, see Add Tags and Annotations.
Add Annotation
Simple Log Service (SLS) allows you to add non-identifying attributes to alerts in a key-value format. These are mainly used for alert noise reduction and notification control, meaning you can add conditions related to annotations when creating an alert policy or action policy. For more information, see Add Tags and Annotations.
You can also enable the Auto-Add Annotations switch to automatically add information like __count__ to the alert. For more information, see Automatic Annotations.
Recovery Notifications
If you enable the Recovery Notifications switch, a recovery alert is triggered when the original alert is resolved. Its severity is the same as the triggered alert.
Advanced Settings
-
Threshold of Continuous Triggers: An alert is generated only after the trigger condition is met for the specified number of consecutive checks.
-
No Data Alert: If this switch is enabled, an alert is generated if the number of times the query and analysis result is empty (or the combined result if there are multiple) exceeds the Threshold of Continuous Triggers value. For more information, see No-data Alert.
Destination
The output target specifies where alert events are sent. You can configure one or more output targets. This topic uses SLS Notification as an example.
-
Eventstore: Writes alert events to an EventStore.
-
CloudMonitor Event Center: Writes alert events to the Cloud Monitor system Event Center, to manage and send notifications through Cloud Monitor.
-
Simple Log Service Notification: Outputs alert events to the SLS notification service, to manage and send alerts by using alert policies, action policies, and more.
Alert Policy
An alert policy is used to merge, silence, and suppress generated alerts.
-
If you select Simple Mode or Standard Mode, you do not need to configure an alert policy. Simple Log Service (SLS) uses the built-in dynamic alert policy (sls.builtin.dynamic) by default.
-
If you select Advanced Mode, you can choose a built-in or custom alert policy for alert management. For information on how to create an alert policy, see Create an Alert Policy.
Action Group
This parameter is required only when Alert Policy is set to Simple Mode.
After you configure an action group, Simple Log Service (SLS) automatically creates an action policy named
Rule Name-Action Policy. All alerts triggered by this alert monitoring rule are sent through this action policy. For configuration details, see Notification Channel Overview.ImportantYou can modify this action policy on the Action Policy management page. For more information, see Action Policy. If you add a condition while modifying the action policy, the Alert Policy here automatically changes to Standard Mode.
Action Policy
An action policy controls alert notification channels, frequency, and more.
When Alert Policy is set to Standard Mode or Advanced Mode, you can select a built-in or custom action policy for alert notifications. For information on how to create an action policy, see Action Policy.
In addition, when Alert Policy is set to Advanced Mode, you can also enable or disable Custom Action Policy. For more information, see Dynamic Action Policy Mechanism.
Repeat Interval
During this period, repeated alerts trigger the action policy only once, sending a single notification.
-
-