Group evaluation lets you use a single alert rule to monitor multiple targets by grouping query and analysis results by a specific field. The alerting system evaluates each group against the trigger condition independently and generates a separate alert, so you can manage alerts and events for each group individually.
-
After you configure group evaluation, a single evaluation can generate up to 100 alert groups. If more than 100 groups are generated, the system randomly selects 100 of them and sends them to the alert policy.
-
Select a field that uniquely identifies the monitored entity and has a limited number of possible values. Avoid fields that cannot distinguish between entities. Such fields create too many groups, each triggering a separate alert, which can cause an alert storm and lead you to miss critical notifications.
For example, for Nginx logs, use fields like host and method. For OSS access logs, use the bucket field. Do not use fields like request_time or body_size from Nginx logs, or the err_cnt field from error logs.
Example 1: Group monitoring for time series data
Suppose you store metric data from multiple servers in a single time series database and want Log Service to send a separate alert for each server when its CPU utilization (cpu_util) exceeds 95%. You can configure group evaluation when you create an alert rule.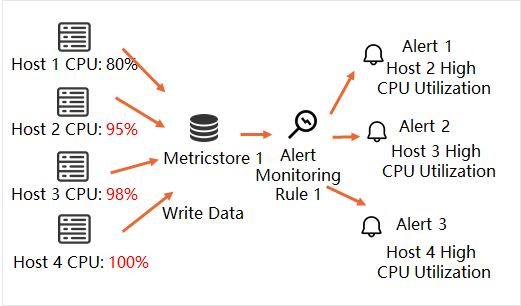
The configuration is as follows:
-
Query and statistics:
* | select promql_query_range('cpu_util') from metrics limit 1000Calculates CPU utilization.
-
Group evaluation: Auto label
Log Service automatically groups query and analysis results for time series data.
-
Trigger Condition: Data Matching, value > 95, Severity: High
Triggers a high-severity alert when the value exceeds 95.
-
Add Annotation: Configure annotations such as the alert title and description. You can reference field variables such as ${host} in annotations. For more information, see Add labels and annotations.
Set the title to CPU utilization for host ${host} has spiked and the desc to CPU utilization for host ${host} has reached ${value}.
Example 2: Group monitoring for logs
Suppose you monitor OSS access logs and want to receive a separate alert for each bucket that experiences more than 1,000 HTTP 500 errors per minute. You can configure group evaluation when you create an alert rule.
The configuration is as follows:
-
Query and statistics:
http_status=500 | select bucket,count(1) as pv group by bucket having pv >1000 order by pv descFinds buckets with more than 1,000 HTTP 500 errors.
-
Group evaluation: Custom label, bucket
Groups the query and analysis results by bucket.
-
Trigger Condition:
-
Condition 1: Data Matching, pv > 3000, Severity: High
Triggers a high-severity alert when the pv value exceeds 3,000.
-
Condition 2: Data Exists, Severity: Medium
Triggers a medium-severity alert when the query and analysis returns any results.
-
-
Add Annotation: Configure annotations such as the alert title and description. You can reference field variables such as ${pv} in annotations. For more information, see Add labels and annotations.
Set the title to ${bucket} bucket is experiencing 500 errors and the desc to Error count: ${pv}.