Use SQL diagnostics in AnalyticDB for MySQL to answer questions like: Which queries are consuming the most time right now? Why is a query slow — is it waiting in queue, generating a plan, or executing? How much data did a query scan or return?
SQL diagnostics provides two complementary views: the Query Monitoring Information chart and the SQL Queries table.
Query monitoring charts
The Query Monitoring Information section visualizes query execution times across a selected time range. Each colored bar represents a single query — the longer the bar, the longer the query ran. Colors are assigned arbitrarily and carry no additional meaning.
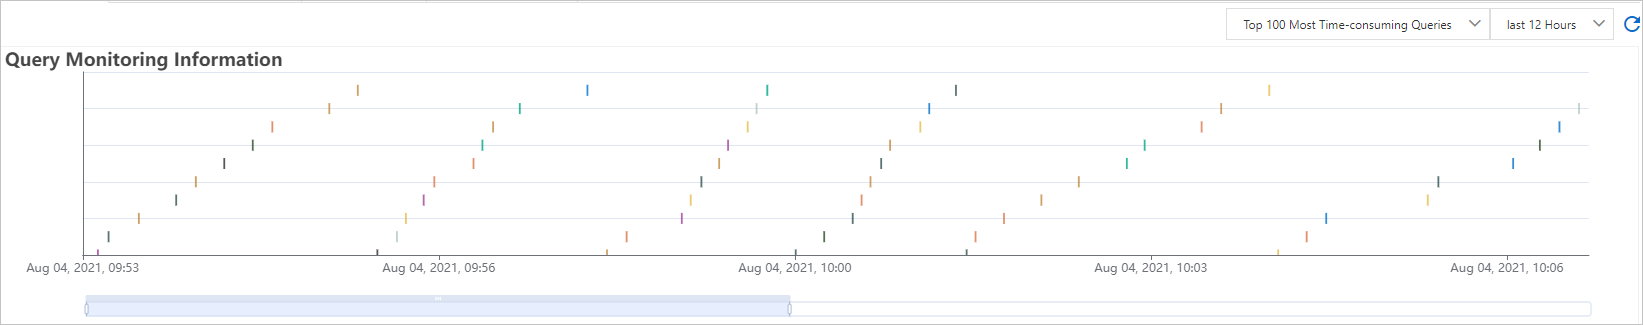
Hover over a bar to see the query's start time, end time, and amount of scanned data. Click Details to open the query details page, where you can inspect the Query Properties, SQL Statement, and Execution Plan. For more information, see Use execution plans to analyze queries.
The chart displays up to 10,000 queries. It reflects only general search results — for example, queries matching Last 5 Minutes and Top 100 Most Time-consuming Queries. Advanced search filters applied in the SQL Queries tab do not affect the chart.
For an explanation of general and advanced search options, see the Search methods section in the SQL diagnostics overview.
SQL queries
The SQL Queries table shows more detail than the chart — including the full SQL statement, source address, and a breakdown of where time was spent. Use Show Advanced Search to narrow results by resource group, source address, database, or other criteria. Advanced search filters apply only to the table; they do not affect the monitoring chart.
Parameters
| Parameter | Description |
|---|---|
| Actions | Click Diagnose to open the query details page. The page shows the Query Properties, SQL Statement, and Execution Plan tabs. For more information, see Use execution plans to analyze queries. |
| SQL | The executed SQL statement. Click the |
| Started At | The time when the query was submitted. |
| Query ID | The unique identifier of the query. |
| Source Address | The IP address of the client that submitted the query. To view the source address, go to Diagnostics and Optimization > Connection Information. |
| Database | The name of the database the query ran against. Use advanced search to filter by database. |
| Status | The execution status of the SQL statement. Valid values: Completed, Running, or Failed. |
| Total Duration | The total time from SQL submission to execution completion. Total Duration = Queuing Time + Execution Plan Duration + Execution Duration. |
| Queuing Time | The time from submission to an access node until execution starts. AnalyticDB for MySQL applies throttling on access nodes when concurrent query volume is high. If submitted queries reach the concurrency limit, new queries wait in queue. To avoid long queuing times: if resource consumption is low, increase the concurrency limit — see Priority queues and concurrency control of interactive resource groups. If resource consumption is already high, identify and address resource-heavy queries first. For more information about access nodes, see Overall architecture. |
| Execution Plan Duration | The time to generate an execution plan after the SQL statement reaches an access node. Long plan generation is usually caused by a complex SQL statement (such as excessive joins) or high resource usage on the access node. To resolve this, simplify the SQL statement or check for large result sets being returned to the client. For more information, see Query-level diagnosis results. |
| Execution Duration | The time to execute the SQL statement. Sort by this column to identify the most resource-intensive queries. |
| Returned Data | The amount of data returned to the client by the SELECT statement. Queries that return large amounts of data consume significant resources and can slow down other concurrent queries. Sort by this column to find queries returning excessive data. |
| Username | The name of the user that submitted the query. To view the username and the number of user connections, go to Diagnostics and Optimization > Connection Information. |
| Resource Group | The resource group that executed the SQL statement. |
| Peak Memory | The peak memory used by the query. AnalyticDB for MySQL executes queries in stages — dependent stages run serially, independent stages run in parallel — so memory usage peaks at the most resource-intensive point during execution. |
| Scanned Data | The amount of data read from the storage layer to the computing layer. More scanned data means higher disk I/O and greater demand on the computing layer, both of which slow queries down. |
| Total Stages | The total number of stages generated for the query. A large stage count indicates a complex SQL statement that requires extensive network coordination. If a query generates many stages, simplify the SQL statement. For background on stages, see Query process and execution plan. |
| ETL Written Rows | The number of rows written by an extract-transform-load (ETL) query. |
Operations
| Operation | Description |
|---|---|
| Download | Save the current query results to an Excel file. Up to 100,000 records can be downloaded at a time. |
| Last 5 Downloads | Open the drop-down list to access the five most recent downloads. |
| Show Advanced Search | Set additional filter conditions — such as Resource Group or Source Address — to narrow the results in the table. Advanced search filters apply only to the SQL Queries table and do not affect the monitoring chart. |
| Diagnose | Click Diagnose in the Actions column to open the query details page and view the Query Properties, SQL Statement, and Execution Plan. For more information, see Use execution plans to analyze queries. |
Advanced search filters apply to existing general search results. Filter values are drawn from the current result set, not from the entire cluster. When Running Queries is selected as the general search filter, only details of SQL queries that took longer than 10 seconds to complete are displayed in the search result, and a Resource Consumption Ranking column is also displayed — a lower rank value means the query is consuming more CPU and memory.