When a query runs slowly or produces unexpected results, understanding how AnalyticDB for MySQL processes and executes SQL helps you interpret execution plans, read SQL diagnostics output, and identify where the query spends its time. AnalyticDB for MySQL breaks every SQL query into a hierarchy of stages, tasks, and operators before executing it across the cluster.
How AnalyticDB for MySQL processes a query
When you submit a SQL query, AnalyticDB for MySQL processes it in five steps:
The client sends the SQL statement to a controller node — the frontend access node of AnalyticDB for MySQL. For details on access nodes, see Technical architecture.
The controller node's parser parses the statement into a syntax tree and produces a preliminary logical execution plan.
The controller node's optimizer evaluates the preliminary plan and rewrites it as needed. The optimizer produces a final logical execution plan that specifies the join type, join order, aggregation method, and data redistribution method. Based on network transmission requirements, the optimizer also determines whether the plan needs to be split.
An executor node receives the final logical execution plan and converts it into a physical execution plan made up of stages and operators that are used to process data based on specific rules.
The executor node returns results to the client, or writes them to AnalyticDB for MySQL tables and external storage systems such as Object Storage Service (OSS).
Execution plan concepts
Stage
A stage is a physical part of the execution plan. At execution time, a query splits into multiple stages. Each stage:
Sources data from the underlying storage system or can be transferred over networks.
Consists of tasks of the same type distributed across different executor nodes.
Runs its tasks in parallel to maximize throughput.
Task
A task is the execution entity of a stage on a single executor node. Each stage distributes its work across multiple tasks of the same type, and all tasks run in parallel within the cluster.
Operator
An operator is the basic data processing unit in AnalyticDB for MySQL. AnalyticDB for MySQL determines whether to run operators in parallel or serial mode based on the semantics of each operator and the dependencies between operators.
Example: group aggregation query
The following figure shows how a group aggregation query executes. The controller node splits the logical execution plan into shards and distributes them to executor nodes.
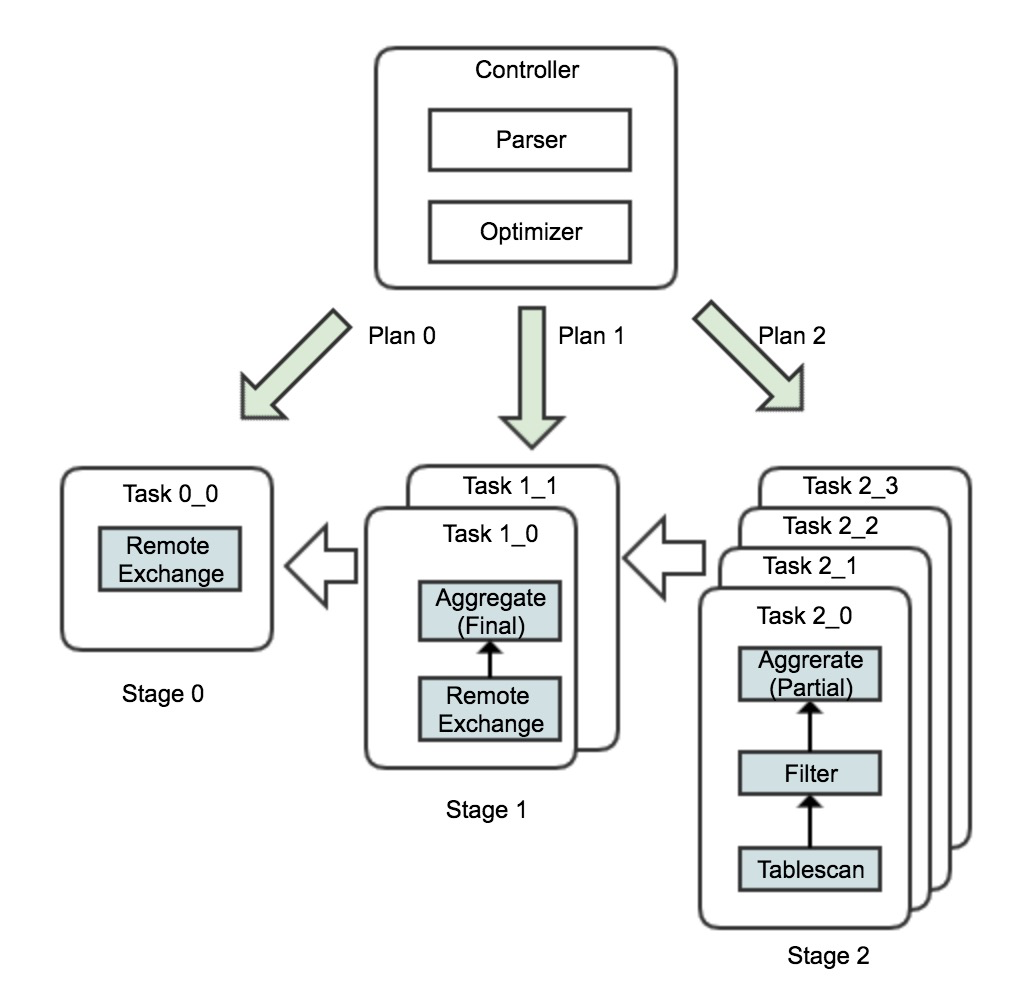
| Stage | Tasks | What it does |
|---|---|---|
| Stage 2 | 4 | Scans, filters, and performs partial aggregation on data in parallel. |
| Stage 1 | 2 | Performs final aggregation in parallel on the results from Stage 2. |
| Stage 0 | 1 | Collects and returns the final aggregation results from Stage 1. |
What's next
Stage-level diagnostic results — Diagnose query performance at the stage level using the SQL diagnostics feature.
Operator-level diagnosis results — Pinpoint the slowest operators within a stage.