HPA supports CPU and memory by default, which may not cover more complex scenarios. This topic explains how to convert Custom Metrics and External Metrics from Managed Service for Prometheus into HPA-compatible metrics and configure autoscaling for more flexible scale-out and scale-in.
How it works
The data flows through three layers:
-
Prometheus Service collects metrics from your workloads and infrastructure.
-
ack-alibaba-cloud-metrics-adapter reads Prometheus metrics, transforms them with configurable rules, and exposes them through the Kubernetes Custom Metrics API (
custom.metrics.k8s.io) or External Metrics API (external.metrics.k8s.io). -
HPA periodically queries the adapter and adjusts the target workload's replica count.
Two metric types are available:
-
Custom Metric: A metric scoped to a Kubernetes object, such as a pod. Use for per-pod scaling (for example, memory working set or request rate).
-
External Metric: A metric not tied to a Kubernetes object. Use for global scaling, such as overall queries per second (QPS) across all pods.
When possible, prefer Custom Metrics over External Metrics. The Custom Metrics API is easier for administrators to lock down; the External Metrics API may expose any Prometheus metric.
Prerequisites
-
A Prometheus monitoring component is deployed. See Connect to and configure Prometheus Service.
-
The ack-alibaba-cloud-metrics-adapter add-on is deployed. See Install ack-alibaba-cloud-metrics-adapter.
-
The ack-arms-prometheus add-on is updated to the latest version. To update, go to Components and Add-ons in the ACK console. See Component updates and release notes.
To deploy ack-alibaba-cloud-metrics-adapter, log on to the ACK console and go to Marketplace > Marketplace.
Step 1: Get Prometheus monitoring data
Option A: Use built-in ACK metrics
Prometheus Service is installed by default in ACK and collects metrics including:
-
cAdvisor container metrics
-
Node Exporter infrastructure metrics
-
GPU Exporter metrics
-
Any additional metrics you have connected to Prometheus Service
To see all connected metrics:
-
Log on to the ACK console. In the left navigation pane, click Clusters.
-
On the Clusters page, click the name of your cluster. In the left navigation pane, choose Operations > Prometheus Monitoring.
-
In the upper-right corner, click Alert Settings . If the link does not appear, update Managed Service for Prometheus to the latest version. See Prerequisites.
-
In the Prometheus Service console, click Settings in the left navigation pane to view all connected metrics.
Option B: Expose custom metrics from a pod
If your application exposes Prometheus-format metrics, scrape them with a ServiceMonitor. This example deploys a sample app that exposes http_requests_total and configures scraping.
Deploy the sample application
-
Log on to the ACK console. In the left navigation pane, click Clusters.
-
On the Clusters page, click the name of your cluster. In the left navigation pane, click Workloads > Deployments.
-
On the Deployments page, click Create from YAML. On the Create from YAML page, set Sample Template to Custom, paste the following YAML, and click Create.
Add a ServiceMonitor
-
Log on to the Application Real-Time Monitoring Service (ARMS) console.
-
In the left navigation pane, click Integration Management. On the Integration Management page, on the Integrated Environments tab, select your Region and click the environment that matches your cluster.
-
On the container environment page, click the Metric Scraping tab. In the left navigation pane, click Service Monitor , then click Create . In the Add ServiceMonitor Configuration panel, click YAML, paste the following YAML, and follow the on-screen instructions to create the ServiceMonitor.
apiVersion: monitoring.coreos.com/v1
kind: ServiceMonitor
metadata:
  annotations:
    arms.prometheus.io/discovery: 'true'
  name: sample-app
  namespace: default
spec:
  endpoints:
  - interval: 30s
    port: http
    path: /metrics
  namespaceSelector:
    any: true
  selector:
    matchLabels:
      app: sample-app
Verify monitoring status
-
Click the Self-Monitoring tab. In the Targets tab, confirm that
default/sample-app/0(1/1 up)is displayed. This confirms Prometheus is scraping the application. -
In the Prometheus dashboard, query
http_requests_totalto confirm data is flowing.
Step 2: Configure ack-alibaba-cloud-metrics-adapter
The adapter converts Prometheus metrics into Kubernetes HPA-readable metrics through four operations per rule: discovery, association, naming, and querying. The following sections build a complete rule incrementally.
Update the adapter configuration
-
Log on to the ACK console. In the left navigation pane, click Clusters.
-
Click the name of your cluster. In the left navigation pane, click Applications > Helm.
-
Find ack-alibaba-cloud-metrics-adapter and click Update in the Actions column.
-
In the Update Release panel, update the YAML with your configuration and click OK.
The following table lists key adapter fields. For the full reference, see Adapter configuration reference.
|
Field |
Description |
|
|
Metric conversion rules. Modify to match the examples above. |
|
|
The Prometheus request URL. See Get the Prometheus data request URL. |
|
|
Authentication header. Prometheus V1 (if token authentication is enabled): use |
|
|
Set to |
Verify the adapter is working
Run these commands to confirm the adapter exposes metrics through the Kubernetes aggregation API.
Check Custom Metrics:
# List all available Custom Metrics
kubectl get --raw "/apis/custom.metrics.k8s.io/v1beta1/" | jq .

# Query container_memory_working_set_bytes_per_second for pods in kube-system
kubectl get --raw "/apis/custom.metrics.k8s.io/v1beta1/namespaces/kube-system/pods/*/container_memory_working_set_bytes_per_second" | jq .

# Query container_cpu_usage_core_per_second for pods in kube-system
kubectl get --raw "/apis/custom.metrics.k8s.io/v1beta1/namespaces/kube-system/pods/*/container_cpu_usage_core_per_second" | jq .
A successful response looks similar to:
{
  "kind": "MetricValueList",
  "apiVersion": "custom.metrics.k8s.io/v1beta1",
  "metadata": {
    "selfLink": "/apis/custom.metrics.k8s.io/v1beta1/namespaces/kube-system/pods/%2A/container_cpu_usage_core_per_second"
  },
  "items": [
    {
      "describedObject": {
        "kind": "Pod",
        "namespace": "kube-system",
        "name": "ack-cost-exporter-7f44d55c66-cgtz7",
        "apiVersion": "/v1"
      },
      "metricName": "container_cpu_usage_core_per_second",
      "timestamp": "2025-12-30T03:30:21Z",
      "value": "4m",
      "selector": null
    }
  ]
}
The response confirms the adapter discovered and associated the metric with the correct pod. The items array lists one entry per pod. The value field uses the m suffix (milli-units), so 4m means 0.004 CPU cores per second.
Check External Metrics:
# List all available External Metrics
kubectl get --raw "/apis/external.metrics.k8s.io/v1beta1/" | jq .

# Query http_requests_per_second in the default namespace
kubectl get --raw "/apis/external.metrics.k8s.io/v1beta1/namespaces/default/http_requests_per_second" | jq .
A successful response looks similar to:
{
  "kind": "ExternalMetricValueList",
  "apiVersion": "external.metrics.k8s.io/v1beta1",
  "metadata": {},
  "items": [
    {
      "metricName": "http_requests_per_second",
      "metricLabels": {},
      "timestamp": "2025-12-30T03:29:40Z",
      "value": "328m"
    }
  ]
}
Unlike Custom Metrics, the External Metrics response contains a single aggregated value (not per pod) because the metric is not scoped to a Kubernetes object.
Step 3: Deploy HPA
The adapter exposes both Custom Metrics and External Metrics. Choose the type that matches your scaling strategy.
Custom Metrics
Use Custom Metrics to scale based on per-pod measurements.
-
Create
hpa.yamlwith the following content.Pods-type metrics only supportAverageValuetargets. HPA divides the total metric value across all pods and compares it toaverageValueto decide whether to scale.kind: HorizontalPodAutoscaler apiVersion: autoscaling/v2 metadata: name: sample-app-memory-high spec: scaleTargetRef: # The workload HPA controls. apiVersion: apps/v1 kind: Deployment name: sample-app minReplicas: 1 maxReplicas: 10 metrics: - type: Pods pods: metric: name: container_memory_working_set_bytes_per_second target: type: AverageValue averageValue: 1024000m # Target: 1 KB/s average per pod. # The unit is bytes/s. Kubernetes uses 'm' for milli-units: # 1024000m = 1024 bytes = 1 KB. -
Apply the HPA.
kubectl apply -f hpa.yaml -
Run a stress test to trigger scaling. First, expose the sample-app Service through a Server Load Balancer (SLB) instance.
ab -c 50 -n 2000 http://<EXTERNAL-IP>:8080/ -
Check HPA status.
kubectl get hpa sample-app-memory-highExpected output:
NAME                     REFERENCE               TARGETS         MINPODS   MAXPODS   REPLICAS   AGE
sample-app-memory-high   Deployment/sample-app   40886272/1024   1         10        1          22s
The
TARGETScolumn showscurrent/desired. When the current value exceeds the threshold, HPA adds pods.
External Metrics
Use External Metrics to scale based on a global measurement not tied to individual pods.
-
Create
hpa.yamlwith the following content.External-type metrics support bothValueandAverageValuetargets.apiVersion: autoscaling/v2 kind: HorizontalPodAutoscaler metadata: name: sample-app spec: scaleTargetRef: apiVersion: apps/v1 kind: Deployment name: sample-app minReplicas: 1 maxReplicas: 10 metrics: - type: External external: metric: name: http_requests_per_second selector: matchLabels: job: "sample-app" target: type: AverageValue averageValue: 500m # Target: 0.5 requests/s average per pod. -
Apply the HPA.
kubectl apply -f hpa.yaml -
Run a stress test (same as the Custom Metrics tab, using the
<EXTERNAL-IP>of thesample-appService).ab -c 50 -n 2000 http://<EXTERNAL-IP>:8080/ -
Check HPA status.
kubectl get hpa sample-appExpected output:
NAME         REFERENCE               TARGETS    MINPODS   MAXPODS   REPLICAS   AGE
sample-app   Deployment/sample-app   33m/500m   1         10        1          7m
Adapter configuration reference
The adapter converts a Prometheus metric into an HPA-compatible metric through four fields: seriesQuery, resources, name, and metricsQuery. The sections below build a complete rule that converts http_requests_total into http_requests_per_second.
Template variables in metricsQuery
The metricsQuery field is a Go template, not plain PromQL. The adapter populates it with values from the HPA request before querying Prometheus. The delimiters are << and >> (not {{ and }}) to avoid conflicts with PromQL syntax.
|
Variable |
Populated with |
|
|
The Prometheus metric name from |
|
|
The label selectors from the HPA request, for example |
|
|
The Kubernetes resource label used to group results, for example |
Discovery
seriesQuery specifies which Prometheus metric to convert and accepts any valid PromQL selector, including label filters.
- seriesQuery: 'http_requests_total{namespace!="",pod!=""}'The label filters namespace!="" and pod!="" restrict the metric to pods with both labels set, a requirement for resource association in the next step.
To narrow matching series, add a seriesFilters block:
- seriesQuery: 'http_requests_total{namespace!="",pod!=""}'
  seriesFilters:
    - isNot: "^container_.*_seconds_total"
seriesFilters accepts two operators:
-
is:<regex>: keep only series whose name matches the regex. -
isNot:<regex>: exclude series whose name matches the regex.
Association
resources.overrides maps Prometheus label names to Kubernetes API resources. This tells the adapter which label to match when HPA requests a metric for a specific pod or namespace.
- seriesQuery: 'http_requests_total{namespace!="",pod!=""}'
  resources:
    overrides:
      namespace: {resource: "namespace"}
      pod: {resource: "pod"}
The keys (namespace, pod) are the Prometheus label names. The values ("namespace", "pod") are Kubernetes API resource types, as listed by kubectl api-resources -o wide. Each key must exist as a label in your Prometheus data.
Naming
name converts the Prometheus metric name into the HPA metric name using a regular expression. The original Prometheus metric name is unchanged.
- seriesQuery: 'http_requests_total{namespace!="",pod!=""}'
  resources:
    overrides:
      namespace: {resource: "namespace"}
      pod: {resource: "pod"}
  name:
    matches: "^(.*)_total"
    as: "${1}_per_second"
matches is a regex that captures part of the Prometheus metric name. as defines the HPA metric name, using ${1} to reference the first capture group. Here, http_requests_total becomes http_requests_per_second.
For External Metrics, convert uppercase letters in the Prometheus metric name to lowercase in the HPA metric name.
To list all available HPA metric names:
kubectl get --raw "/apis/custom.metrics.k8s.io/v1beta1"Querying
metricsQuery defines the PromQL expression the adapter sends to Prometheus after substituting template variables.
- seriesQuery: 'http_requests_total{namespace!="",pod!=""}'
  resources:
    overrides:
      namespace: {resource: "namespace"}
      pod: {resource: "pod"}
  name:
    matches: "^(.*)_total"
    as: "${1}_per_second"
  metricsQuery: 'sum(rate(<<.Series>>{<<.LabelMatchers>>}[2m])) by (<<.GroupBy>>)'
The label selectors inmetricsQueryare injected via<<.LabelMatchers>>at query time and do not inherit filters fromseriesQuery.
Get the Prometheus data request URL
Alibaba Cloud Prometheus Service
-
Log on to the ACK console. In the left navigation pane, click Clusters.
-
Click the name of your cluster. In the left navigation pane, choose Operations > Prometheus Monitoring.
-
In the upper-right corner, click Alert Settings . If the link does not appear, update ack-arms-prometheus to the latest version. See Prerequisites.
-
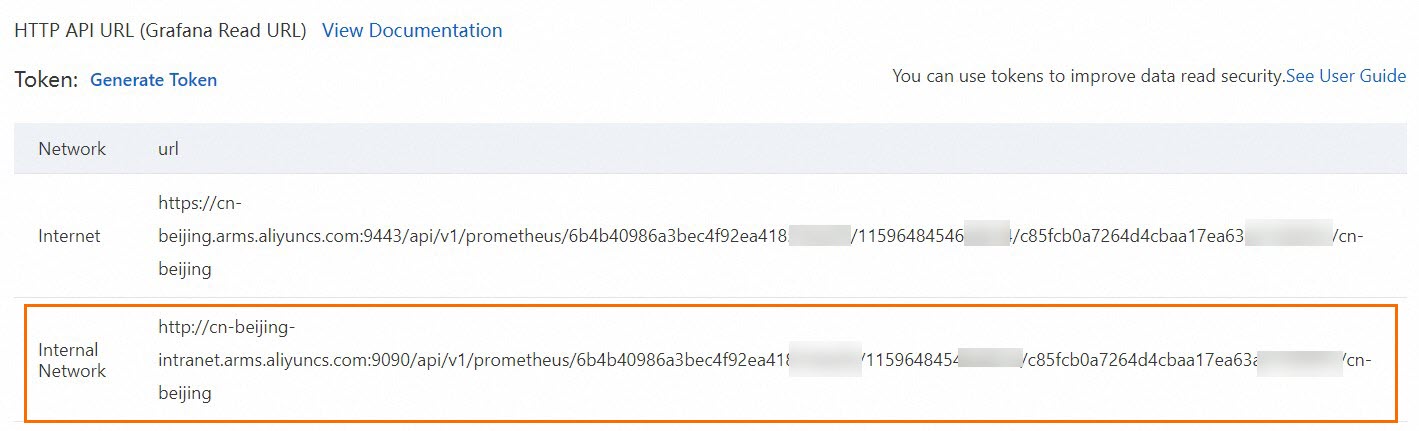
In the Prometheus Service console, click Settings > Settings to find the HTTP API Address (Grafana Read URL) . Use the Internal Network address when available; otherwise use the Internet address.
-
Configure authentication for your Prometheus version.
-
Prometheus V1 (token authentication disabled by default): If enabled, copy the token from the Prometheus console and configure the adapter.

prometheus: prometheusHeader: - Authorization: {Token} -
Prometheus V2 (AccessKey authentication enabled by default): If password-free access is not enabled, Base64-encode your AccessKey ID and AccessKey secret.
-
Generate a Base64-encoded string.
Concatenate your AccessKey ID and AccessKey secret as
AccessKey:AccessSecret, then Base64-encode:echo -n 'accessKey:secretKey' | base64 -
Configure the component.
Enter the generated string in the
Basic <encoded string>format into theAuthorizationfield ofprometheusHeader.... prometheus: prometheusHeader: - Authorization: Basic YWxxxxeQ== ...
-
-
Open source Prometheus
For self-managed Prometheus, expose its API through a Kubernetes Service and set the Service URL in the adapter configuration.
This example uses the ack-prometheus-operator Helm chart from ACK Marketplace. See Open source Prometheus monitoring.
-
Deploy ack-prometheus-operator.
-
Log on to the ACK console. In the left navigation pane, choose Marketplace > Marketplace.
-
Search for ack-prometheus-operator, click its card, then click Deploy.
-
Select the Cluster and Namespace, set the Release Name, and click Next. Adjust Parameters as needed and click OK.
-
-
Verify the deployment.
-
Expose the Prometheus API through a Service. This example uses the
ack-prometheus-operator-prometheusService. -
In a browser, go to
ServiceIP:9090. For public access, expose the Service through an SLB instance. -
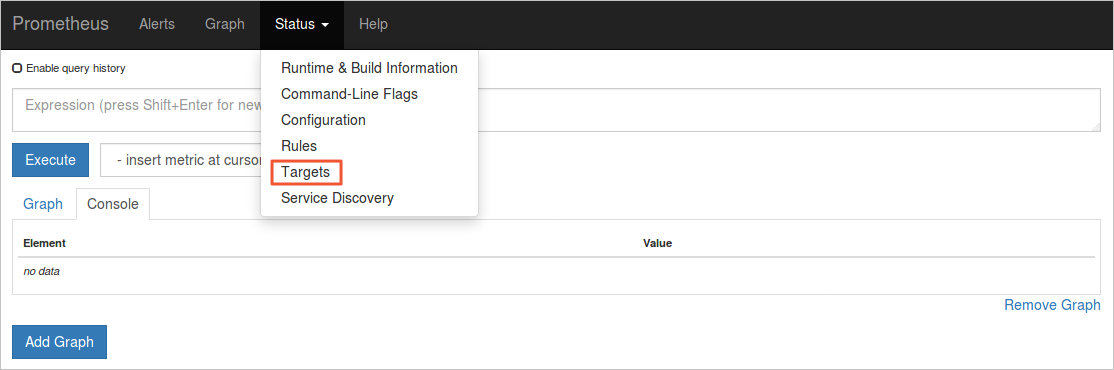
In the Prometheus console, click Status > Targets to view all scrape jobs.
 If all jobs show a State of UP, scraping is working correctly.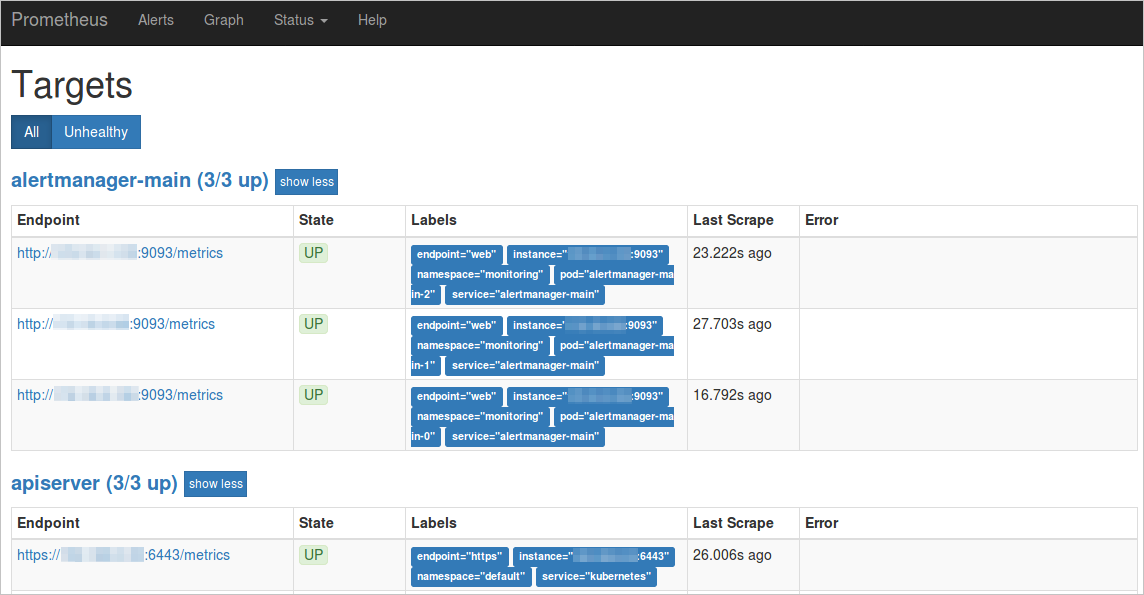
-
Note the Service name and namespace from the Labels column. Here, the Service is
ack-prometheus-operator-prometheusin themonitoringnamespace.
-
-
Set the Prometheus URL in the adapter. For internal access:
AlibabaCloudMetricsAdapter:
  prometheus:
    enabled: true
    url: http://ack-prometheus-operator-prometheus.monitoring.svc.cluster.local:9090
For public access:
AlibabaCloudMetricsAdapter:
  prometheus:
    enabled: true
    url: http://your_domain.com:9090   # Replace with your public IP address or domain.
To add a Prometheus data source, see Add a Prometheus data source in Grafana.
Next steps
-
To scale based on external metrics such as HTTP request rate or Ingress QPS, see Horizontal pod autoscaling based on Alibaba Cloud component metrics.
-
To scale multiple applications using Nginx Ingress traffic metrics, see Horizontally scale multiple applications based on Nginx Ingress traffic metrics.