Alibaba Cloud Managed Service for Prometheus provides HTTP API URLs that allow you to access Prometheus monitoring data from Grafana or retrieve data by using the Prometheus API for custom development.
Prerequisites
You have integrated data sources with Prometheus. For more information, see the following topics:
Step 1: Obtain the HTTP API URL
-
Log on to the Cloud Monitor console. In the left navigation bar, select Prometheus Monitoring > Instance List to go to the Instance List page.
-
In the top navigation bar, select the Prometheus where the Prometheus instance is deployed. Find the target instance and click Settings in the Actions column.
-
On the Settings tab, copy the HTTP API URL for the public or internal network, as needed.
You can also click Generate token to enhance the security of data reads.
-
For V1 Prometheus instances, if you need to improve the security of data reads in Grafana, click Generate token to obtain an authentication token for the Prometheus instance.
Important-
V1 instances: After you generate a token, you must configure it when you add the data source in Grafana. Otherwise, monitoring data cannot be read from the Prometheus instance.
-
V2 instances: By default, you must use your account's AccessKey ID and AccessKey secret to access data. The RAM user that owns the AccessKey ID must have the AliyunPrometheusMetricReadAccess or AliyunCloudMonitorFullAccess system permission.
-
Step 2: Add the data source in Grafana
Self-managed Grafana
This section uses Grafana v10.x as an example. For information about adding a data source in other versions, see the official Grafana documentation.
-
Configure the Grafana data source.
-
Log on to your self-managed Grafana as an administrator.
-
In the upper-left corner of the page, click the
 menu icon and choose Administration > Data sources.
 -
Click + Add new data source and select Prometheus as the data source type.
-
On the Settings tab, enter a custom name in the Name field. In the Prometheus server URL field, paste the HTTP API URL that you obtained in Step 1.
-
Configure authentication.
V1 instances (optional)
Click + Add header. In the Custom HTTP Headers section, click +Add header, set Header to Authorization, and set Value to the authentication token obtained in Step 1.
V2 instances
Enable Basic auth. Set User to your AccessKey ID and Password to your AccessKey secret.
-
-
At the bottom of the page, click Save & Test.
-
Query Prometheus metrics.
-
Log on to your Grafana system.
-
In the upper-left corner of the page, click the
 menu icon and then click Dashboards in the left-side navigation pane.
 -
On the Dashboards page, click New in the upper-right corner and then click New dashboard in the drop-down menu.
-
Click + Add visualization. On the Select data source page, select the data source that you created.
-
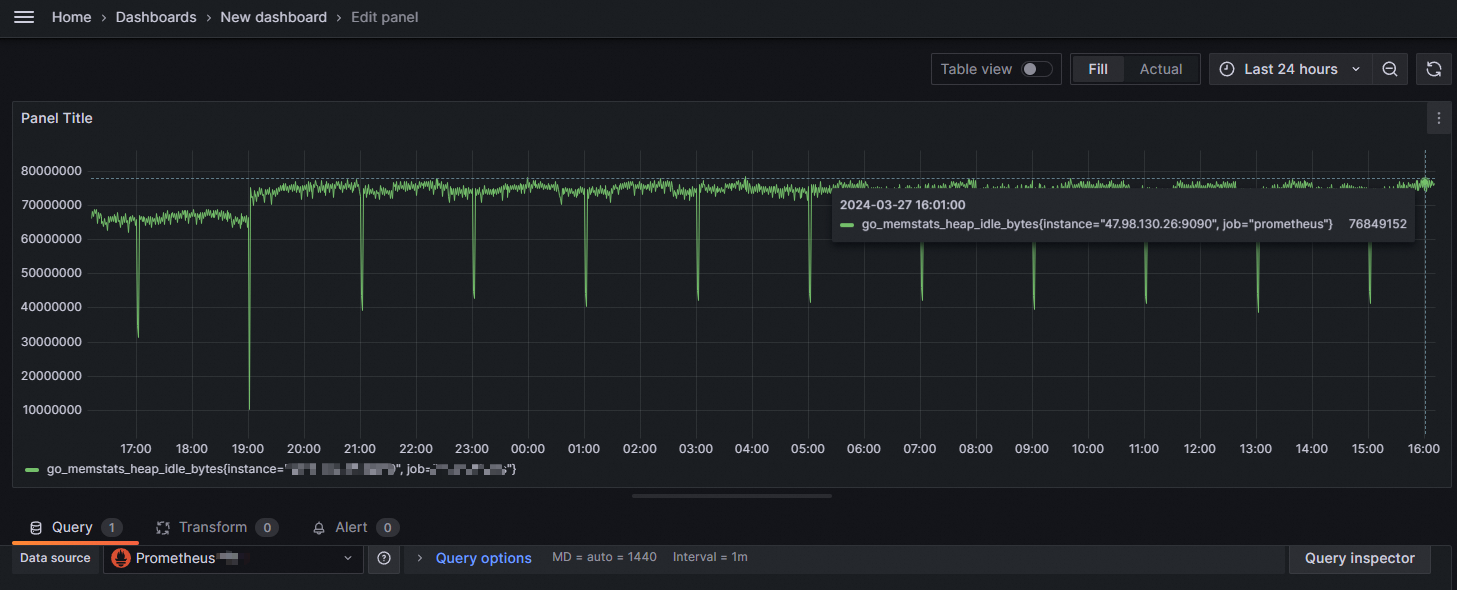
On the Edit Panel page, go to the Query tab. In section A, enter the metric name and value in the Metrics and Label filters fields, and then click Run queries.
If a chart for the metric appears, the setup is successful. Otherwise, verify that the API URL and token are correct and that the data source contains Prometheus monitoring data.
-
Managed Service for Grafana
Managed Service for Grafana provides one-click integration for Prometheus data sources and dashboards.
-
Log on to the ARMS console. In the left-side navigation pane, choose Managed Service for Grafana > Workspace Management, and then click your workspace ID.
-
On the Workspace Information page, find the Cloud Service Integration section and click Prometheus Monitoring Service. Then, find your instance and click Integrate.
-
In the dialog box that appears, click OK.
If you are integrating a V2 Prometheus instance, you must enter the AccessKey ID for the data source.
-
After the synchronization is complete, click the folder icon on the right.
-
In Grafana, on the Dashboards tab, click a dashboard name to view the pre-built default dashboards for application monitoring.
-
In the upper-left corner of the page, click the
menu icon and choose Administration > Data sources to view the added application monitoring data source. -
Query Prometheus metrics.
-
Log on to your Grafana system.
-
In the upper-left corner of the page, click the
menu icon and then click Dashboards in the left-side navigation pane. -
On the Dashboards page, click New in the upper-right corner and then click New dashboard in the drop-down menu.
-
Click + Add visualization. On the Select data source page, select the data source that you created.
-
On the Edit Panel page, go to the Query tab. In section A, enter the metric name and value in the Metrics and Label filters fields, and then click Run queries.
If a chart for the metric appears, the setup is successful. Otherwise, verify that the API URL and token are correct and that the data source contains Prometheus monitoring data.
-
Step 3: Retrieve Prometheus data
The following code shows a sample request to retrieve Prometheus monitoring data. For more information about using the HTTP API, see the open-source Prometheus HTTP API documentation.
V1 instances
GET {HTTP API URL}/api/v1/query
Accept: application/json
Content-Type: application/json
Authorization: {Token}
{
  "query":"arms_prometheus_target_interval_length_seconds_sum",
  "time":"1635302655",
  "timeout":"1000"
}Replace {HTTP API URL} and {Token} with the HTTP API URL and authentication token that you obtained in Step 1.
V2 instances
GET {HTTP API URL}/api/v1/query
Accept: application/json
Content-Type: application/json
Authorization: Basic <base64Encode(<AccessKey ID:AccessKey secret>)>
{
  "query":"arms_prometheus_target_interval_length_seconds_sum",
  "time":"1635302655",
  "timeout":"1000"
}-
Replace
{HTTP API URL}with the HTTP API URL that you obtained in Step 1. -
The API supports STS authentication. If you use this method, the AccessKey secret in
BasicAuthmust be in the following format:{AccessKey secret}${STS Token}. For more information, see What is STS?.
You can also use Python and the requests library to call the API. The following examples show how to query Prometheus monitoring data with V2 Basic Auth and V1 Token authentication.
V2 instances (Basic Auth)
import base64
import requests

access_key_id = "<AccessKey ID>"
access_key_secret = "<AccessKey secret>"
http_api_url = "{http_api_url}"

credentials = f"{access_key_id}:{access_key_secret}"
auth_header = base64.b64encode(credentials.encode()).decode()

headers = {
    "Accept": "application/json",
    "Content-Type": "application/json",
    "Authorization": f"Basic {auth_header}"
}

response = requests.get(
    f"{http_api_url}/api/v1/query",
    params={"query": "up"},
    headers=headers
)

result = response.json()
print(result["status"])
print(result["data"]["result"])
V1 instances (Token)
import requests

http_api_url = "{http_api_url}"
token = "{token}"

headers = {
    "Accept": "application/json",
    "Content-Type": "application/json",
    "Authorization": token
}

response = requests.get(
    f"{http_api_url}/api/v1/query",
    params={"query": "up"},
    headers=headers
)

result = response.json()
print(result["status"])
print(result["data"]["result"])Sample response: