By default, pods are scheduled based on requested resources rather than actual node load. Enable load-aware scheduling in an ACK managed Pro cluster to place pods on nodes with lower actual load, balance utilization, and reduce the risk of node failures caused by a single overloaded node.
How load-aware scheduling works
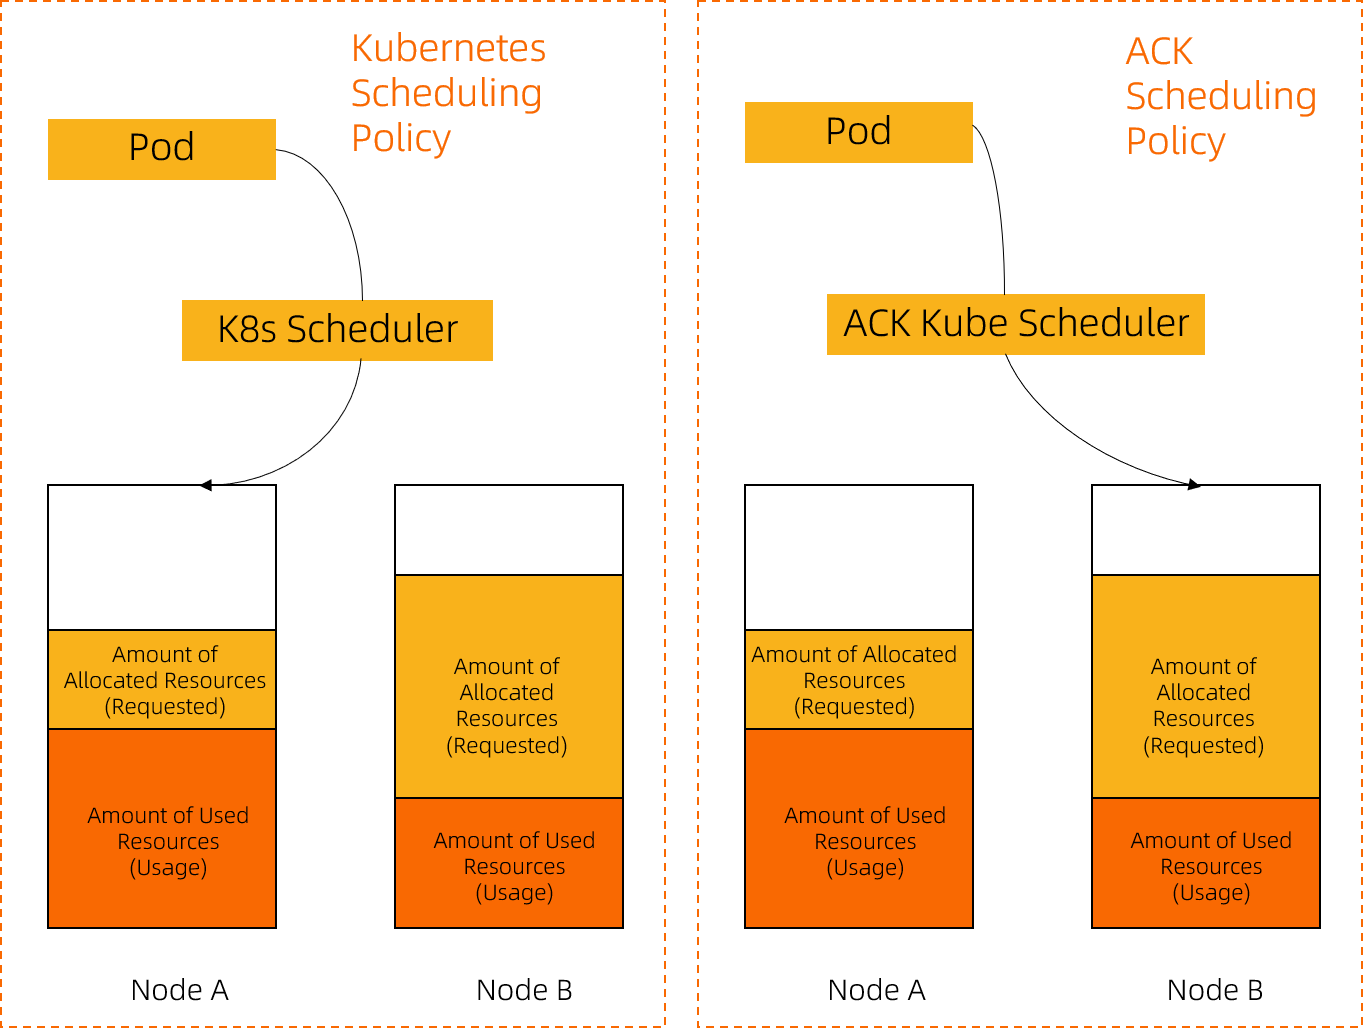
Load-aware scheduling is a plugin that the Container Service for Kubernetes (ACK) scheduler implements based on the Kubernetes Scheduling Framework. The native Kubernetes scheduling policy places pods mainly by resource allocation. The ACK scheduler instead detects the actual resource load of each node: it references historical node load statistics, estimates the load of the pod to be scheduled, and then places the pod on a node with a lower load. This balances loads across nodes and helps prevent application or node failures caused by a single overloaded node.
Load-aware scheduling requires both the kube-scheduler component and the ack-koordinator add-on. The ack-koordinator add-on collects and reports node resource utilization, and the ACK scheduler uses that data to score and rank nodes so that nodes with lower loads are selected first. For details about the add-on design, see ack-koordinator architecture.
In the following figure, Requested is the amount of resources that have been requested and Usage is the amount of resources that are actually used. Only resources that are actually used count as actual load. Given identical node conditions, the ACK scheduler assigns the new pod to Node B, which has the lower load.
Node utilization changes dynamically over time and with the cluster environment, workload traffic, and request volume. To reduce the chance that the cluster becomes imbalanced again after pods are scheduled, the ack-koordinator add-on also provides descheduling. Use load-aware scheduling together with use hotspot-aware descheduling to balance node loads to keep node loads balanced over time.
How node load is measured
The load statistic can be aggregated in multiple ways, including average and percentile values. By default, the ACK scheduler uses the average over the past 5 minutes. To change the aggregation type, set the loadAwareAggregatedUsageAggragationType parameter. For details, see Custom kube-scheduler parameters.
For memory, the usage data excludes page cache, because the operating system can reclaim page cache. The utilization returned by the kubectl top node command includes page cache. To view the actual memory usage of a node, see Configure Managed Service for Prometheus.
Scheduling policies
Load-aware scheduling provides the following policies. Both policies use the aggregated node load statistic described in the preceding section.
Policy | Description |
Node filtering | Filters candidate nodes by actual load. If the actual load of a node exceeds the configured load threshold, the scheduler does not schedule pods to that node. Node filtering is disabled by default. To enable it, set the |
Node scoring | Scores candidate nodes on both the CPU dimension and the memory dimension, and selects the nodes with the higher scores first. The score is calculated as |
Prerequisites
Cluster type — Only an ACK managed Pro cluster is supported. For the procedure, see Create an ACK Pro cluster.
ack-koordinator add-on — Install the ack-koordinator add-on 1.1.1-ack.1 or later. For the installation procedure, see ack-koordinator (FKA ack-slo-manager).
ACK scheduler version — The ACK scheduler must meet the version requirement for the Kubernetes version of your cluster, as listed in the following table.
Kubernetes version | Required ACK scheduler version |
1.26 and later | All versions |
1.24 | v1.24.6-ack-4.0 or later |
1.22 | v1.22.15-ack-4.0 or later |
These versions are required to configure load-aware scheduling through kube-scheduler parameters. Some earlier scheduler versions support only the pod annotation protocol. For the full compatibility matrix, see the FAQ.
Billing
Installing or using the ack-koordinator add-on is free. However, you may incur costs in the following scenarios:
Worker node resources — ack-koordinator is a non-managed add-on that consumes worker node resources after installation. Resource requests can be configured for each module during installation.
Custom metrics — By default, ack-koordinator exposes monitoring metrics for features such as resource profiling and fine-grained scheduling in Prometheus format. If you select Enable Prometheus monitoring metrics for ack-koordinator and use Managed Service for Prometheus, these metrics are billed as custom metrics. The fees vary based on factors such as cluster size and the number of applications. Before you enable this feature, see Billing of Prometheus instances to understand the free tier and pricing for custom metrics. To monitor and manage your resource usage, use usage query.
Step 1: Enable load-aware scheduling
Load-aware scheduling does not take effect unless the ack-koordinator add-on and the ACK scheduler meet the version requirements described in Prerequisites.
Log on to the ACK console. In the left navigation pane, click Clusters.
On the Clusters page, click the name of your cluster. In the left navigation pane, click Components and Add-ons .
Find kube-scheduler and click Configuration.
In the kube-scheduler parameters dialog box, configure the parameters described in the following table and click OK.
The following table describes the main parameters for load-aware scheduling. For the complete parameter settings reference and the add-on versions that each parameter requires, see kube-scheduler and .
Parameter
Type
Description
Valid values
Default value
Example
loadAwareThresholdA list that consists of the resource name
resourceNameand the thresholdthreshold.The threshold of the corresponding resource type, used by the node filtering policy.
resourceName:cpuandmemoryare supported.threshold: [0,100].Empty, which means that node filtering is disabled.
resourceName: cpuandthreshold: 80loadAwareResourceWeightA list that consists of the resource name
resourceNameand the weightresourceWeight.The scoring weight of the corresponding resource type, used by the node scoring policy. You must select Specifies whether to enable load-aware node scoring during pod scheduling.
resourceName: onlycpuandmemoryare supported.resourceWeight: an integer in the range [1,100].cpu: 1andmemory: 1resourceName: cpuandresourceWeight: 1loadAwareAggregatedUsageAggragationTypeenum
The aggregation type of the load statistic.
avg: the average value.p50: the 50th percentile, which is the median.p90,p95, andp99: the 90th, 95th, and 99th percentiles.avg,p50,p90,p95, andp99avgp90ImportantIf node auto scaling is already enabled for the nodes in the cluster, a load-aware filtering threshold can trigger unexpected scale-out or scale-in. This is because node auto scaling scales out based on whether pods are pending and scales in based on the allocation level of the cluster. To use node auto scaling together with load-aware node filtering, adjust the configuration to match the capacity and utilization of your cluster, as described in Enable node auto scaling.
In the left-side navigation pane, click Cluster Information. On the page that appears, click the Basic Information tab and wait until the cluster enters the Running state, which indicates that load-aware scheduling is enabled.
Step 2: Verify load-aware scheduling
The following example uses a cluster that has three nodes, each with 4 cores and 16 GiB of memory. The example first makes the loads across the nodes imbalanced and then checks where new pods are scheduled.
Create a file named stress-demo.yaml with the following content.
apiVersion: apps/v1
kind: Deployment
metadata:
  name: stress-demo
  namespace: default
  labels:
    app: stress-demo
spec:
  replicas: 1
  selector:
    matchLabels:
      app: stress-demo
  template:
    metadata:
      name: stress-demo
      labels:
        app: stress-demo
    spec:
      containers:
        - args:
            - '--vm'
            - '2'
            - '--vm-bytes'
            - '1600M'
            - '-c'
            - '2'
            - '--vm-hang'
            - '2'
          command:
            - stress
          image: polinux/stress
          imagePullPolicy: Always
          name: stress
          resources:
            limits:
              cpu: '2'
              memory: 4Gi
            requests:
              cpu: '2'
              memory: 4Gi
      restartPolicy: Always
Run the following kubectl command to create the pod. The pod increases the load of the node that hosts it.
kubectl create -f stress-demo.yamldeployment.apps/stress-demo createdRun the following kubectl command to check the pod status until the pod is running.
kubectl get pod -o wideNAME READY STATUS RESTARTS AGE IP NODE NOMINATED NODE READINESS GATES stress-demo-7fdd89cc6b-g**** 1/1 Running 0 82s 10.XX.XX.112 cn-beijing.10.XX.XX.112 <none> <none>stress-demo-7fdd89cc6b-g****is scheduled to nodecn-beijing.10.XX.XX.112. Wait about 3 minutes until the pod finishes initialization and the load of the node has increased.Run the following kubectl command to check the load of each node.
kubectl top nodeNAME CPU(cores) CPU% MEMORY(bytes) MEMORY% cn-beijing.10.XX.XX.110 92m 2% 1158Mi 9% cn-beijing.10.XX.XX.111 77m 1% 1162Mi 9% cn-beijing.10.XX.XX.112 2105m 53% 3594Mi 28%cn-beijing.10.XX.XX.111has the lowest load and nodecn-beijing.10.XX.XX.112has the highest load. The loads across nodes in the cluster are now imbalanced.Create a file named nginx-with-loadaware.yaml with the following content.
apiVersion: apps/v1
kind: Deployment
metadata:
  name: nginx-with-loadaware
  namespace: default
  labels:
    app: nginx
spec:
  replicas: 6
  selector:
    matchLabels:
      app: nginx
  template:
    metadata:
      name: nginx
      labels:
        app: nginx
    spec:
      containers:
      - name: nginx
        image: nginx
        resources:
          limits:
            cpu: 500m
          requests:
            cpu: 500m
Run the following kubectl command to create the pods.
kubectl create -f nginx-with-loadaware.yamldeployment/nginx-with-loadawre createdRun the following kubectl command to view the pod scheduling details.
kubectl get pods | grep nginxnginx-with-loadaware-5646666d56-2**** 1/1 Running 0 18s 10.XX.XX.118 cn-beijing.10.XX.XX.110 <none> <none> nginx-with-loadaware-5646666d56-7**** 1/1 Running 0 18s 10.XX.XX.115 cn-beijing.10.XX.XX.110 <none> <none> nginx-with-loadaware-5646666d56-k**** 1/1 Running 0 18s 10.XX.XX.119 cn-beijing.10.XX.XX.110 <none> <none> nginx-with-loadaware-5646666d56-q**** 1/1 Running 0 18s 10.XX.XX.113 cn-beijing.10.XX.XX.111 <none> <none> nginx-with-loadaware-5646666d56-s**** 1/1 Running 0 18s 10.XX.XX.120 cn-beijing.10.XX.XX.111 <none> <none> nginx-with-loadaware-5646666d56-z**** 1/1 Running 0 18s 10.XX.XX.116 cn-beijing.10.XX.XX.111 <none> <none>The expected output shows that after load-aware scheduling is enabled, the scheduler senses node loads and uses the scheduling strategy to preferentially schedule the pods to nodes other than cn-beijing.10.XX.XX.112.
FAQ
Why are the pods in a batch of newly created pods not all scheduled to the node with the lowest load?
New pods increase the load of a node after they start. If the scheduler placed an entire batch of new pods on the node that currently has the lowest load, that node could quickly become a load hotspot.
Therefore, when the load-aware scheduling plugin scores nodes, it adjusts the score of a node that hosts new pods whose utilization has not been reported yet. This prevents over-scheduling from creating a new hotspot.
Besides node load, what else affects the scheduling result?
The Kubernetes scheduler consists of multiple plugins, and many of them contribute to node scoring during scheduling, such as the affinity plugin and the topology spread plugin. The final node ranking reflects all of these plugins, and you can adjust the scoring weight of each plugin as needed.
After the scheduler is upgraded to a new version, does load-aware scheduling still work through the earlier protocol?
The answer depends on the Kubernetes version of the cluster. In version 1.22, the ACK scheduler remains compatible with the earlier protocol. For version 1.24, the compatibility period ended on August 30, 2023. For version 1.26 and later, the pod annotation protocol is not supported.
On a version that still supports the earlier protocol, add the annotation alibabacloud.com/loadAwareScheduleEnabled: "true" to the pod. Because the ACK scheduler is compatible with the earlier protocol, you can upgrade the scheduler to the new version seamlessly. After the upgrade, use Custom kube-scheduler parameters to enable a cluster-wide load balancing scheduling policy, which reduces the changes needed in pod configurations.
Upgrade a cluster to a later version and use the new configuration method for load-aware scheduling. For more information, see manually upgrade a cluster.
The following tables describe protocol support and the add-on version requirements for each version:
1.26 and later
ACK scheduler version | Required ack-koordinator (ack-slo-manager) version | Pod annotation protocol | Console parameter switch |
All ACK scheduler versions | ≥1.1.1-ack.1 | Not supported | Supported |
1.24
ACK scheduler version | Required ack-koordinator (ack-slo-manager) version | Pod annotation protocol | Console parameter switch |
≥v1.24.6-ack-4.0 | ≥1.1.1-ack.1 | Supported | Supported |
≥v1.24.6-ack-3.1 and <v1.24.6-ack-4.0 | ≥0.8.0 | Supported | Not supported |
ACK scheduler version | Required ack-koordinator (ack-slo-manager) version | Pod annotation protocol | Console parameter switch |
≥1.22.15-ack-4.0 | ≥1.1.1-ack.1 | Supported | Supported |
≥1.22.15-ack-2.0 and <1.22.15-ack-4.0 | ≥0.8.0 | Supported | Not supported |
≥v1.20.4-ack-4.0 and ≤v1.20.4-ack-8.0, or v1.18-ack-4.0 | ≥0.3.0 and <0.8.0 | Supported | Not supported |