CoreDNS serves as the default DNS provider for Container Service for Kubernetes (ACK) clusters. By analyzing CoreDNS logs, you can troubleshoot DNS resolution latency, detect requests to high-risk domains, and monitor overall cluster health. This topic explains how to enable, query, and set up alerts for CoreDNS logs.
Prerequisites
You have installed the log collection add-on.
For Logtail: Ensure the
alibaba-log-controllerversion is0.2.0.0-76648ee-aliyunor later.If the
alibaba-log-controllerversion is outdated, upgrade the Logtail add-on directly.For LoongCollector: All versions are supported.
Your CoreDNS is the latest version. For upgrade procedures, see Manage add-ons.
Step 1 (optional): Enable the CoreDNS log plugin
In the latest CoreDNS version, the log plugin is enabled by default for the default domain. You only need to follow these instructions if you are configuring logging for custom domains.
Impact
Enabling logs increases CoreDNS CPU consumption by approximately 10%, depending on the request volume. If CoreDNS CPU utilization is already high, consider scaling out the CoreDNS replicas before proceeding.
Procedure
Log on to the ACK console. In the left navigation pane, click Clusters.
On the Clusters page, click the name of the one you want to change. In the left-side navigation pane, choose .
In the kube-system namespace, find the
corednsConfigMap and click Edit.Check the Corefile for the log plugin (typically the default block
.:53). If the plugin is not found, add it as shown in the following example to enable logging for CoreDNS domain name resolution. For more information, see Modify a parameter.
The following code shows the coredns configuration using the default log format.
Corefile: |
    .:53 {
        errors
        log # Add the log plugin here to enable DNS resolution logging.
        health {
           lameduck 5s
        }
        ready
        kubernetes cluster.local in-addr.arpa ip6.arpa {
          pods insecure
          upstream
          fallthrough in-addr.arpa ip6.arpa
          ttl 30
        }
        prometheus :9153
        forward . /etc/resolv.conf
        cache 30
        loop
        reload
        loadbalance
    }
    # If you have other domains, , add the log plugin to their blocks as well.
    demo.com:53 {
        ...
        log # Add the log plugin here.
    }
Step 2: Enable the CoreDNS log collection
Method 1: Enable the service in the console
Log on to the ACK console. In the left navigation pane, click Clusters.
On the Clusters page, find the cluster you want and click its name. In the left navigation pane, choose .
On the tab, click Install (if prompted), then Enable Log Collection.
Method 2: Enable the service using kubectl
Deploy an AliyunLogConfig Custom Resource Definition (CRD) to automate the creation of logstores and dashboards. For details on creating the AliyunLogConfig custom resource, see Manage custom resources.
The following configuration applies only to the default log format in CoreDNS. If you use a custom log format for CoreDNS, modify the
Regexfield in the CRD definition.For more custom log formats in CoreDNS, see log.
For more log collection flow and configurations, see Use CRDs to collect container logs in DaemonSet mode.
For how to configure the AliyunLogConfig CRD for resources such as storage, networking, and auto scaling, see Step 1: Create configuration files for collecting log files of system components.
Step 3: Query and analyze logs in Logstore
Log on to the ACK console. In the left navigation pane, click Clusters.
On the Clusters page, find the cluster you want and click its name. In the left navigation pane, choose .
On the tab, click Logstores to query and analyze DNS logs.
In the input box, enter a query statement and select Last 1 Week for the time range.
Click Search & Analyze to view the results.
Simple Log Service (SLS) provides histogram, raw logs, and statistical charts to display query analysis results. For more information about how to query and analyze logs, see Get started with log query and analysis.
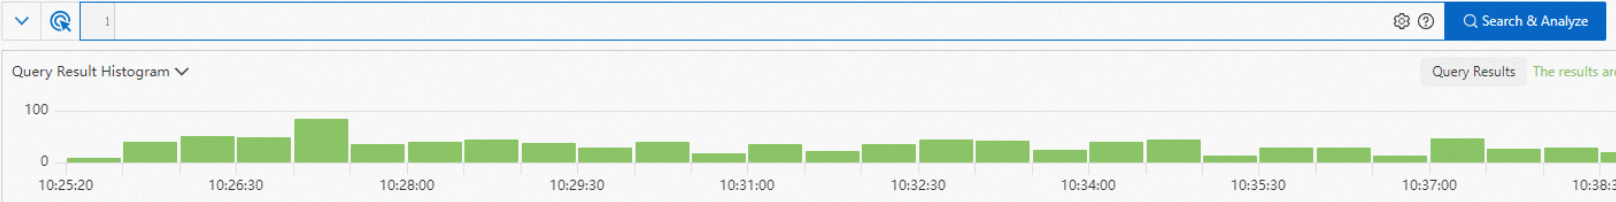
Log histogram
The log distribution histogram shows the distribution of logs over time.
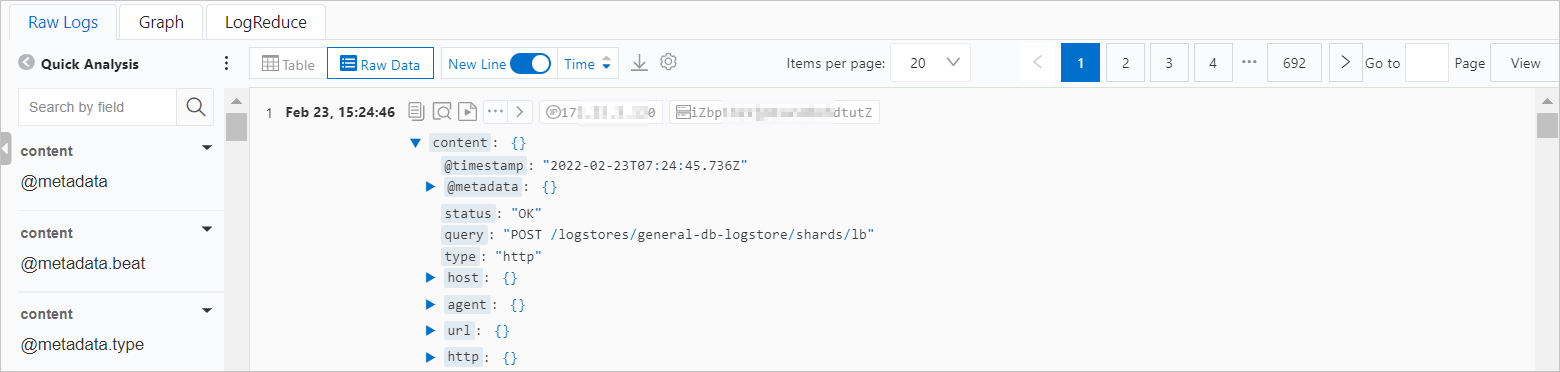
Raw logs
The query results are displayed on the Raw Logs tab. Click Table or Raw Data to view the logs and analyze them to confirm whether there are any anomalies in the current domain name resolution. Pay attention to the value of the return code (RCODE). For the interpretation of RCODE, see Troubleshoot DNS resolution errors.
CoreDNS log field reference
Field
Description
Example
{level}
The log level.
INFO
{remote}
The client IP address.
172.16.0.10
{port}
The client port.
58008
{id}
The query ID.
34518
{type}
The request type.
A
{class}
The request class.
IN
{name}
The requested domain name.
kube-dns.kube-system.svc.cluster.local.
{proto}
The protocol used.
tcp
{size}
The request size (bytes).
56
{do}
Whether the EDNS0 DO (DNSSEC OK) bit is set in the query.
false
{bufsize}
The EDNS0 buffer size (bytes) that is defined in the query.
65535
{rcode}
The response code.
NOERROR
{rflags}
The response flags. Each flag set will be displayed.
qr,aa,rd
{rsize}
The uncompressed response size (bytes).
110
{duration}
Resolution latency (seconds).
0.00011
Graph
After executing query analysis statements, you can view the visualized results on the Graph tab.
LogReduce
On the LogReduce tab, click Enable LogReduce to aggregate similar logs during log collection. For more information, see LogReduce.
Step 4: Visualize with dashboards
Log on to the ACK console. In the left navigation pane, click Clusters.
On the Clusters page, find the cluster you want and click its name. In the left navigation pane, choose .
On the tab, click Dashboards to view the Kubernetes CoreDNS Logs Analysis dashboard. This provides:
Total Requests, Success Ratio, and Latency: Monitor DNS health at a glance.
Top Requested Domains: Identify the most active services.
Top Error Domains: Quickly find domains causing NXDOMAIN or SERVFAIL errors.
Timeout Domains, Insesure Domains, and Slow Logs: View these data to identify performance bottlenecks.
Step 5: Configure alerts
On the Kubernetes CoreDNS Logs Analysis dashboard, you can set alerts based on individual charts. This operation is supported only in the SLS console.
Log on to the ACK console. In the left navigation pane, click Clusters.
On the Clusters page, find the target cluster and click its name. In the navigation pane on the left, click Cluster Information.
On the Basic Information tab, click the link next to Log Service Project to go to the SLS console.
In the left navigation pane of the Logstores page, click
 > Dashboard. In the dashboard list, find and click Kubernetes CoreDNS Logs Analysis.
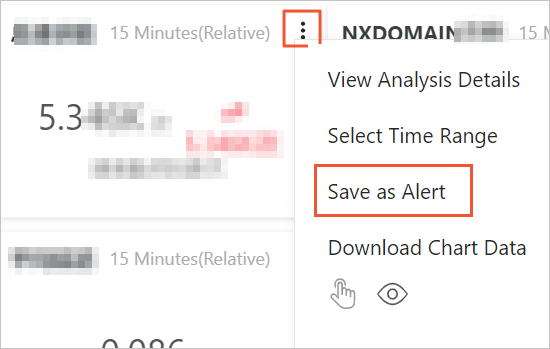
On the Kubernetes CoreDNS Logs Analysis page, hover over the upper-right corner of the target chart and select
 > Save as Alert.
For alert configuration details, see Create an alert rule.
After creating an alert rule, you can view, modify, and disable it. For more information, see Manage alert monitoring rules.
Related operations
Disable log collection
If you no longer need to collect CoreDNS logs, run the following command to remove the configuration:
kubectl -n kube-system delete AliyunLogConfig k8s-coredns-logAfter deletion, CoreDNS output logs will no longer be reported to SLS.
\