You can view information about traffic from the Internet to your assets on the Internet Exposure page. The information includes the trace information about unusual inbound traffic, and the numbers of open public IP addresses, open ports, open applications, and public IP addresses of cloud services. This helps identify suspicious assets and ensure business security.
Prerequisites
The Internet firewall is enabled. For more information, see Internet firewall.
Visualized analysis
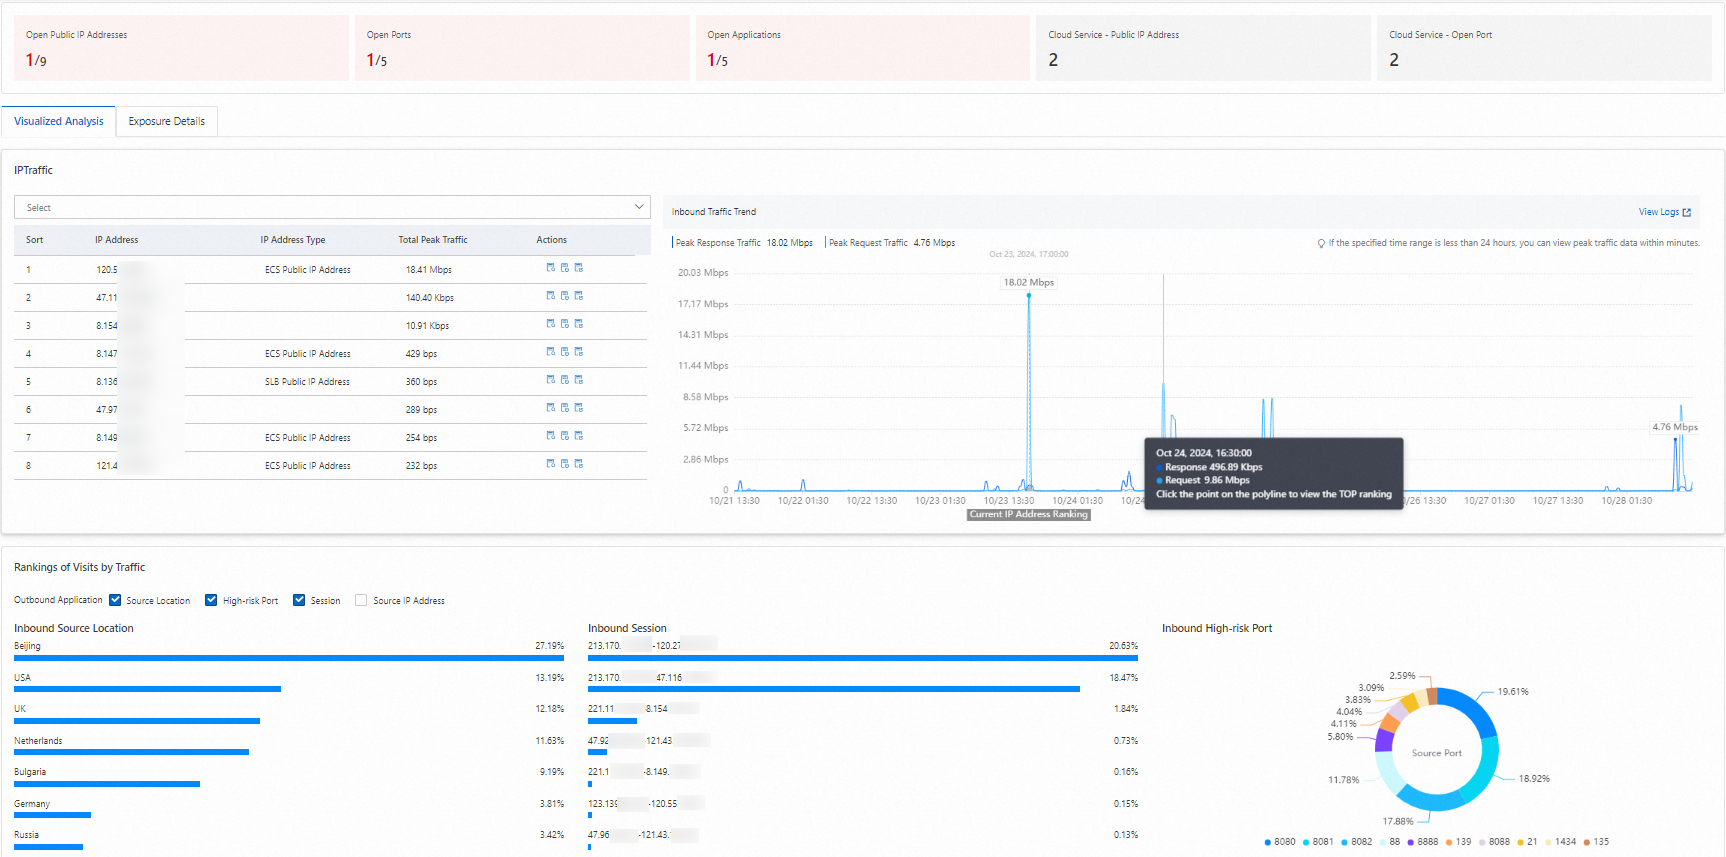
The Visualized Analysis tab displays the traffic of all public IP addresses, the traffic trend charts of all IP addresses, and the statistics of inbound traffic. This helps you monitor inbound traffic of your assets in real time.
Log on to the Cloud Firewall console. In the left-side navigation pane, choose .
In the upper-right corner of the Internet Exposure page, select a time range from the drop-down list and click the Visualized Analysis tab.
On the Visualized Analysis tab, view the following information.
You can select a time range from the drop-down list. You can also specify a custom time range within the previous 30 days.
Section
Description
Supported operation
IP Traffic
This section displays the total peak traffic from the Internet to your assets.
Specify an IP address in the search box and view the IP address type and peak of total traffic for the IP address.
Click the
 icon next to an IP address. The chart on the right side shows the trend of inbound traffic for the IP address.
 Click the
 icon next to an IP address to go to the Log Audit page. On the page, you can view the traffic logs of the IP address. For more information, see Log audit.
 Click the
 icon next to an IP address to go to the Outbound Connection page. On the page, you can view the statistics on outbound connections of the IP address. For more information, see Outbound Connection.
Inbound Traffic Trend
This section displays the peak request and response traffic of all your assets in real time.
Move the pointer over a position in the trend chart to view the peak request and response traffic at the point in time that corresponds to the position. In the Trends of Traffic section, you can click a point in time on the x-axis to refresh the rankings in the IP Traffic section.
Rankings of Visits by Traffic
This section displays the top 10 source locations, top 10 IP address ranges based on session percentages, top 10 source IP addresses, and statistics of at-risk ports.
None.
View the statistics of Internet exposure
The statistics section in the upper-part of the Internet Exposure page displays the statistics of usual and unusual inbound traffic of your assets. You can troubleshoot unusual traffic on the Exposure Details tab based on the statistics to ensure the security of inbound traffic for your assets.
Log on to the Cloud Firewall console. In the left-side navigation pane, choose .
In the upper-right corner of the Internet Exposure page, specify a time range for the query. Then, you can view the information in the Data Statistics section and on the Exposure Details tab. The following table describes the information.
You can select a time period from the drop-down list. You can also specify a custom time range within the previous 7 days.
Parameter
Description
Supported operation
Open Public IP Addresses
The total number of open public IP addresses and the number of at-risk open public IP addresses.
View the traffic statistics of a public IP address that is accessed to identify unusual traffic: On the Open Public IP Addresses tab, find the IP address and click View Details in the Actions column. In the Open Public IP Addresses panel, view the access information about the IP address.
Configure an outbound access control policy to block outbound traffic of assets
Click Configure Access Control Policy to go to the Access Control > Internet Border page. For more information, see Create access control policies for the Internet firewall.
Add an IP address to an address book for centralized management
Find an IP address and click Add to Address Book. You are redirected to the Address Books page. For more information, see Manage address books.
View the details of traffic logs to determine whether the traffic is required for your workloads
Find an IP address, click the
 icon in the Actions column, and then click View Logs. You are redirected to the Traffic Logs tab of the Log Audit page. For more information, see Log audit.
Open Ports
The total number of open ports and the number of at-risk open ports.
View the traffic statistics of an open port to identify unusual traffic: On the Open Ports tab, find the open port and click View Details in the Actions column. In the Open Ports panel, view the access information about the open port.
Open Applications
The total number of open applications and the number of at-risk open applications.
View the traffic statistics of an open application to identify unusual traffic: On the Open Applications tab, find the open application and click View Details in the Actions column. In the Open Applications panel, view the access information about the application.
Details
The traffic statistics of all assets.
View the traffic statistics of an asset to identify unusual traffic: On the Details tab, find the asset and click View Details in the Actions column. In the Details panel, view the access information about the asset.
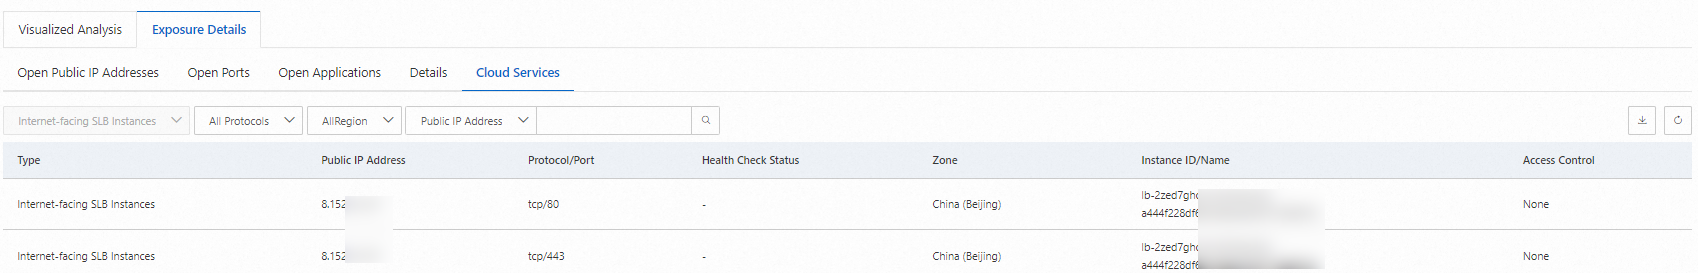
Cloud Services
The number of public IP addresses to which inbound traffic flows to access cloud services.
None.
Export the statistics of Internet exposure
You can click the ![]() icon in the upper-right corner of the Exposure Details tab to export the statistics of open public IP addresses, open ports, open applications, assets, and cloud services to your computer in the CSV format. This allows you to view and analyze the statistics.
icon in the upper-right corner of the Exposure Details tab to export the statistics of open public IP addresses, open ports, open applications, assets, and cloud services to your computer in the CSV format. This allows you to view and analyze the statistics.
References
For more information about the protected Internet traffic bandwidth of Cloud Firewall, see Subscription and Pay-as-you-go.
For more information about outbound traffic, see Outbound Connection.
What do I do if the volume of my business traffic exceeds the purchased bandwidth of Cloud Firewall?