Learn how to quickly pinpoint specific business assets when the total traffic at your internet border exceeds your purchased protected bandwidth, or when you observe sudden spikes, drops, or other anomalies. This allows you to manage your business assets with greater granularity.
How Cloud Firewall calculates internet border traffic
Cloud Firewall measures traffic at the internet border as the greater of the peak bandwidths for total inbound and outbound traffic. The total bandwidth for the inbound and outbound directions is calculated as follows:
-
Inbound bandwidth = Bandwidth of Internet Exposure requests + Bandwidth of Internet Exposure responses
-
Outbound bandwidth = Bandwidth of Outbound Connection requests + Bandwidth of Outbound Connection responses
The peak bandwidth in Cloud Firewall is calculated from data aggregated over time. This means the total bandwidth at any given moment is the sum of request and response bandwidth at that time. However, the reported peak bandwidths for requests and responses are the highest values recorded at any point within the aggregation period. These peaks may not occur at the same time. Therefore, the total peak bandwidth at a specific moment is always less than or equal to the sum of the peak request bandwidth and the peak response bandwidth.
When to troubleshoot unusual traffic
Troubleshoot your traffic when you observe unusual peaks or dips to locate the specific asset IPs involved and understand the details of the traffic patterns. For example, find the specific asset IP that is causing your total traffic to exceed your purchased protected bandwidth.
Procedure
Step 1: Identify the abnormal traffic direction
-
Log on to the Cloud Firewall console. In the left-side navigation pane, click Overview.
-
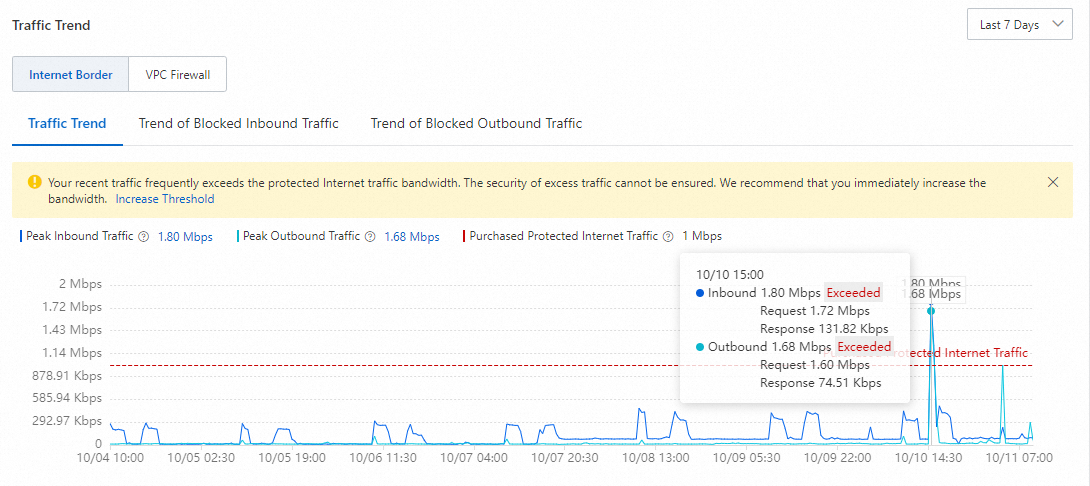
On the Overview page, examine the Traffic Trend chart to find the time when an unusual peak occurred in either the inbound or outbound direction.
The following figure shows an example where both inbound and outbound traffic exceeded the purchased bandwidth at 15:00 on October 10.
NoteWhen traffic exceeds your purchased protected bandwidth, the trend chart displays a line representing your purchased protected bandwidth. This allows you to see by how much the traffic exceeds the limit.
Step 2: Pinpoint the abnormal asset IP
The following steps use inbound traffic as an example. The procedure for troubleshooting outbound traffic is similar. The only difference is the location of the traffic trend chart. For inbound traffic, go to the tab. For outbound traffic, go to the tab.
-
On the Overview page, in the Traffic Trend section, click the inbound peak value to navigate to the tab. Here, you can view the inbound peak bandwidth at 15:00 on October 10.
-
Click the 15:00 timestamp on the timeline. The public IP address list displays a ranked view of total traffic for all your business assets at that time. Use this ranking to identify the asset with unusual traffic.
In this example, asset IP 182.92.XX.XX is the source of the unusual traffic because its total traffic is significantly higher than other assets.
-
To drill down into the traffic data for the asset IP, click the IP address. The trend chart on the right displays the request and response (inbound and outbound) traffic data for that specific asset.
After you click the asset IP, a filter tag such as ECS Public IP address: xxx appears in the filter area at the top of the page. Use the list on the left, which shows the inbound traffic ranking for each public IP address, to pinpoint the IP with unusual traffic.
Step 3: Analyze traffic logs
-
In the list of public IP addresses, find the IP address that you are investigating and choose . This action redirects you to the tab. Because you are troubleshooting inbound traffic, query the traffic logs for the destination IP 182.92.XX.XX at 15:00 on October 10.
-
Review the query results. Check the Source IP Address, Source Port, and Destination Port to determine if the traffic is legitimate.
On the Internet Border tab, set filter conditions such as destination IP and time range, and then click Search. The results table also displays information such as Application (for example, SMTP or SMTPS), protocol, Direction, and Action.
-
Take further action based on your business needs.
-
Upgrade Cloud Firewall bandwidth
For more information, see Renewal.
-
Optimize service deployment
For example, if your services need to access Alibaba Cloud OSS or SLS, use an internal endpoint. This helps save on public bandwidth costs.
-
Disable Cloud Firewall for selected IPs
For more information, see Disable the internet border firewall.
-
Query abnormal traffic with SQL
To quickly query all traffic related to an asset with unusual activity, run SQL queries on the page.
-
Query all destination IP addresses and ports for outbound connections from an unusual asset IP, and sort the results by traffic volume in descending order.
log_type:internet_log and src_ip:182.92.XX.XX | select dst_ip,dst_port,app_name,sum(in_packet_bytes) as in_B,sum(out_packet_bytes) as out_B,sum(total_packet_bytes) as total_B,array_agg(distinct if(url='', domain, url)) as url group by dst_ip,dst_port,app_name order by total_B descIn this query, 182.92.XX.XX is the asset IP.
-
Query all source IP addresses and ports that access the asset IP through Internet Exposure, and sort the results by traffic volume in descending order.
log_type:internet_log and dst_ip:182.92.XX.XX | select src_ip,dst_port,app_name,sum(in_packet_bytes) as in_B,sum(out_packet_bytes) as out_B,sum(total_packet_bytes) as total_B,array_agg(distinct url) as url group by src_ip,dst_port,app_name order by total_B descIn this query, 182.92.XX.XX is the asset IP.
References
-
To view the overall traffic trend for your business assets and check if it exceeds your purchased protection scope, see Overview.
-
To view how your business assets access the Internet, including tracing unusual outbound traffic, Internet destinations accessed by assets, outbound connections from Internet-facing assets, and outbound connections from internal assets, see Outbound Connection.
-
To view how the Internet accesses your business assets, including tracing unusual inbound traffic, public IP addresses exposed by business assets, exposed ports, exposed applications, and the number of public IP addresses for cloud services, see Internet Exposure.
-
To view information about internet border traffic, such as source IP, destination port, protocol, action, flow bytes, and flow packets, see Log Audit.
-
To use SQL queries to analyze raw traffic logs from the internet border, see Query and analyze logs.