This topic answers frequently asked questions (FAQs) about alert monitoring rules in Simple Log Service.
Can I dynamically configure alert severities?
Yes, you can. You can specify conditions to dynamically configure alert severities when you configure an alert rule. For more information, see Configure alert severity.
Can I receive no-data alert notifications?
Yes, you can. You can enable the no-data alert feature and specify the alert severity when you configure an alert rule. For more information, see No-data alert.
Is automatic alert recovery supported?
Yes, it does. You can enable the alert recovery feature when you configure an alert rule. For more information, see Configure recovery notifications.
Can a single alert monitoring rule send notifications to different destinations?
Yes, you can enable the evaluation by group feature when you configure alert monitoring rules. For more information, see Set evaluation by group.
Can I temporarily disable an alert monitoring rule?
Yes, you can. On the Alert Rules page, click Disable in the Actions column.
How do I grant permissions to a RAM user to manage alerts?
You must grant the required permissions to a Resource Access Management (RAM) user before the user can manage alerts. For more information, see Grant a RAM user permissions to manage alerts.
What do I do if the "Alert count exceeds the maximum limit" error occurs when I create an alert monitoring rule?
If the Alert count exceeds the maximum limit error occurs when you create an alert monitoring rule, it indicates that the number of alert monitoring rules in the project has exceeded the limit of 100. To increase the quota, see Manage resource quotas.
The maximum number of alert monitoring rules in a project can be increased to 200. To create more alert monitoring rules, consider the following optimization methods.
Delete the alert monitoring rules that you no longer need from the project.
Collect logs in different projects to reduce the number of alert monitoring rules in a single project.
For example, you can collect logs from Service A into Project1 and logs from Service B into Project2. Then, you can create alert monitoring rules in different projects.
Merge similar alert monitoring rules.
For example, when you monitor data in the same Logstore, you can create only one alert monitoring rule. Use the evaluation by group feature to monitor multiple targets with a single rule. For more information, see Configure evaluation by group.
Use data transformation or scheduled query (Scheduled SQL) to consolidate data into a single Logstore before you create alert monitoring rules.
For example, if you want to monitor error logs from multiple Logstores, you can consolidate all error logs into a single Logstore and then create one alert monitoring rule for that Logstore.
How do I configure alerts based on keywords?
After you collect logs in Simple Log Service, you can use its alerting and monitoring system to configure alerts based on log keywords. For more information, see Configure alerts based on log keywords.
How do I monitor different objects?
If you want to monitor a field for an alert condition but do not know all of its possible values, use the evaluation by group feature. Group the data using the field as a tag. Each group is then evaluated separately against the alert trigger condition. For more information, see Configure evaluation by group.
For example, you store metric data from multiple servers in a Metricstore. You want Simple Log Service to send a separate alert for each server whose CPU utilization (cpu_util) exceeds 95%. To do this, use evaluation by group.
Why does only one of my multiple trigger conditions take effect?
Query and analysis results are matched against trigger conditions in the order that they are listed. After a result matches a condition, subsequent conditions are not checked. Therefore, when you set severities for trigger conditions, configure them from the highest severity to the lowest. For more information, see Configure alert severity.
Why do missing alerts or false positives occur?
Missing alerts: An alert is configured to trigger if the number of error logs is greater than 10. However, no alert is triggered even though a query on the query and analysis page of a Logstore shows that the number of error logs is greater than 10 within the specified time period.
False positives: An alert is configured to trigger if the queries per second (QPS) is less than 100. However, an alert is triggered even though a query on the query and analysis page of a Logstore shows that the QPS is greater than 100 within the specified time period.
Missing alerts or false positives usually occur because of the latency between when data is written to a Logstore and when it becomes queryable. If the query time range in an alert monitoring rule is set to a relative time, the query results for the alert may be inaccurate. To avoid these issues, expand the query time range in the alert monitoring rule or set the query time range to a time frame. For more information, see Monitoring timeliness.
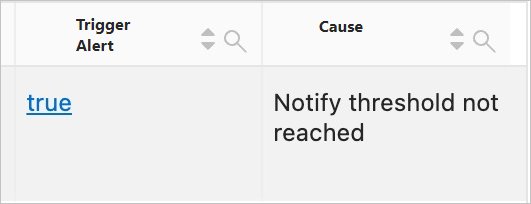
What do I do if Trigger Alert is true and the reason is "Notify threshold not reached" in the Alert History chart?
On the Alert History Statistics dashboard, if the Trigger Alert column in the Alert History chart is true and the Cause column is "Notify threshold not reached", it means that you set a continuous trigger threshold in the alert rule, and the current trigger has not yet met this threshold. For example, if you set the Continuous Trigger Threshold to 3, an alert is sent only after the trigger condition is met three consecutive times.