After you collect logs in Simple Log Service, you can create keyword-based alerts.
Background information
Logs record system operations and exceptions, such as warning logs, error logs, panic errors in Go, java.lang.StackOverflowError errors in Java, and system status logs for events like payment failures. Searching for keywords, monitoring them, and creating alerts are common requirements for system maintenance. You can search for keywords in logs and set up alerts to quickly detect and locate issues. Simple Log Service provides a flexible, high-performance, and maintenance-free alerting solution to help you create keyword-based alerts.
Use case 1: Alert on keyword appearance
If you want to trigger an alert whenever a specific keyword appears in your logs, you can follow this use case to configure the query statement and alert monitoring rule.
-
Query statement
Set the query time range to 15 Minutes (Relative) and run the following statement to query for logs that contain the ERROR keyword. For more information, see Query and analyze logs.
ERROR -
Query result
The query result indicates that the ERROR keyword appeared twice in the last 15 minutes.
The query result shows two matching logs. The log details reveal Python Traceback errors generated during an ETL task, where the levelname field has a value of
ERROR. -
Alert monitoring rule configuration
Create an alert monitoring rule based on the query result. For more information, see Create an alert monitoring rule. The key configuration parameters are as follows:
-
Set Trigger Condition to data is returned. This triggers an alert when the ERROR keyword appears in a log.
-
In the Annotations section, set Description to ${logging} and Alert Template to SLS Built-in Content Template. The alert notification will then include the content of the logging field from the raw log.
Set Rule Name to
Error-level event detected, Check Frequency to a fixed interval of 15 minutes, and Severity to Medium. For Alert Policy, select Simple Mode. In the Action Policy, add DingTalk as the notification channel, select thesampleWebhook, and set Send Period to Any. -
-
Alert notification
After you create the alert monitoring rule, you will receive an alert notification in your DingTalk group whenever the ERROR keyword appears in the logs. You can also click Details to view the log that triggered the alert and trace the issue.
Use case 2: Alert on keyword count
If you want to trigger an alert only when the number of keyword occurrences reaches a specific threshold within a specified time period, you can follow this use case to configure the analytical query and alert monitoring rule.
-
Analytical query
Set the query time range to 1 Hour (Relative) and run the following statement to count the occurrences of the ERROR keyword within one hour. For more information, see Query and analyze logs.
ERROR | SELECT count(*) AS cnt -
Analytical query result
The analytical query result indicates that the ERROR keyword appeared 11 times in the last hour.
The analytical query is
ERROR | SELECT count(*) AS cnt, and the result shows a value of 11 in the cnt column. -
Alert monitoring rule configuration
Create an alert monitoring rule based on the analytical query result. For more information, see Create an alert monitoring rule. The key configuration parameters are as follows:
-
Set Trigger Condition to data is returned, and cnt > 5. This triggers an alert if the ERROR keyword appears more than 5 times within one hour.
-
In the Annotations section, set Description to ERROR occurred ${cnt} times in the last hour and Alert Template to SLS Built-in Content Template. The alert notification will display the number of times the ERROR keyword appeared during the last hour.
Set Rule Name to
High volume of ERROR messages, Check Frequency to a fixed interval of 1 hour, Group Evaluation to Disabled, and Severity to Medium. For Alert Policy, select Simple Mode. Select DingTalk as the notification channel, select the sample Webhook, set Reminders to Disabled, and set Send Period to Any. -
-
Alert notification
After you create the alert monitoring rule, you will receive an alert notification in your DingTalk group if the ERROR keyword appears more than 5 times within the last hour. You can also click Details to view the logs that triggered the alert and trace the issue.
Use case 3: Alert on day-over-day comparison
If a log keyword's frequency follows a daily cycle, where it is more frequent during the day and less frequent at night, using an absolute count may not be suitable for detecting anomalies. You can use interval-valued comparison and periodicity-valued comparison functions to calculate the ratio of keyword occurrences between the same time periods on different days and configure an alert based on this ratio.
-
Analytical query
Set the query time range to 1 Hour (Relative) and run the following statement to calculate the ratio of ERROR keyword occurrences between the current hour and the same hour yesterday. For more information, see Query and analyze logs. For more information about the compare function, see Interval-valued comparison and periodicity-valued comparison functions.
ERROR | SELECT diff [1] AS today, diff [2] AS yesterday, round((diff [3]-1) * 100, 2) AS ratio FROM ( SELECT compare(cnt, 86400) AS diff FROM ( SELECT COUNT(*) AS cnt FROM log ) ) -
Analytical query result
The analytical query result indicates that the ERROR keyword appeared 11 times in the last hour and 6 times during the same period yesterday, representing a growth rate of 83.33%.
-
Alert monitoring rule configuration
Create an alert monitoring rule based on the analytical query result. For more information, see Create an alert monitoring rule. The key configuration parameters are as follows:
-
Set Trigger Condition to data is returned, and ratio > 10. This triggers an alert if the ratio of ERROR keyword occurrences between the current hour and the same hour yesterday exceeds 10%.
-
In the Annotations section, set Description to Error count in the last hour: ${today}. Same period yesterday: ${yesterday}. Day-over-day growth: ${ratio}%. and Alert Template to SLS Built-in Content Template. The alert notification will display the number of ERROR keyword occurrences for the current hour and the same hour yesterday, along with the rate of change.
Set the Rule Name to Spike in ERROR messages, Check Frequency to a fixed interval of 15 minutes, Group Evaluation to Disabled, and Severity to Medium. For Alert Policy, select Simple Mode. Select DingTalk as the notification channel, select the sample Webhook, set Reminders to Disabled, set Send Period to Any, and set Repeat Interval to 1 minute.
-
-
Alert notification
After you create the alert monitoring rule, you will receive an alert notification in your DingTalk group if the ratio of ERROR keyword occurrences between the current hour and the same hour yesterday exceeds 10%. You can also click Details to view the logs that triggered the alert and trace the issue.
Use case 4: Machine learning-based anomaly alerts
The previous use cases cover basic scenarios. For more complex situations, you can use the machine learning algorithms of Simple Log Service. For example, the frequency of a target keyword might be stable throughout the day but could suddenly spike or dip, and you want to be notified of this change immediately. For this scenario, you can use the machine learning algorithms in Simple Log Service to perform time series forecasting and anomaly detection. For more information about machine learning algorithms, see Machine learning functions.
-
Analytical query
Set the query time range to 4 Hours (Relative) and run the following statement to count the number of anomalies in the ERROR count over the last 4 hours. For more information, see Query and analyze logs. For more information about the ts_predicate_simple function, see ts_predicate_simple.
ERROR | SELECT ts_predicate_simple(stamp, value, 6) FROM ( select __time__-__time__ % 30 AS stamp, count(1) AS value FROM log GROUP BY stamp ORDER BY stamp ) -
Analytical query result
The query returns columns such as src, predict, upper, lower, and anomaly_prob. A value greater than 0 in the anomaly_prob column indicates an anomaly. The total number of anomalies is the count of rows where
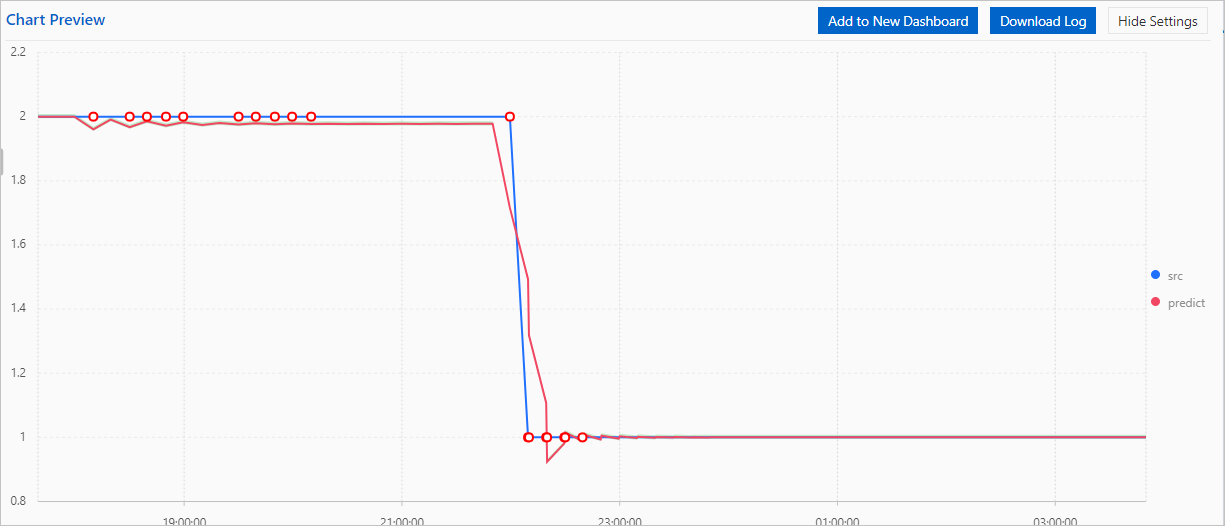
anomaly_probis greater than 0. You can use this count to configure an alert. The results table contains six fields:unixtime(Unix timestamp),src(original value),predict(predicted value),upper(predicted upper bound),lower(predicted lower bound), andanomaly_prob(anomaly probability, where 0.0 is normal and 1.0 indicates an anomaly).You can also display the analytical query result as a time series chart to visualize sudden drops in data. The small red circles on the chart represent anomaly points. In this example, the chart shows that 15 anomaly points occurred during this time period.
-
Alert monitoring rule configuration
Create an alert monitoring rule based on the analytical query result. For more information, see Create an alert monitoring rule. The key configuration parameters are as follows:
-
Set Trigger Condition to Number of matching rows > 5, where the condition is
anomaly_prob> 0. This triggers an alert if more than 5 anomalies are detected in the last 4 hours. -
In the Annotations section, set Description to More than 5 anomalies detected in ERROR count in the last 4 hours and Alert Template to SLS Built-in Content Template. The alert notification will display the number of anomaly points that occurred in the last 4 hours.
Set Rule Name to
Anomaly in ERROR message countand Check Frequency to a fixed interval of 15 minutes. In the Query Statistics section, enter the query statementERROR. Set Group Evaluation to Disabled and Severity to Medium. For Alert Policy, select Simple Mode, and for Action Policy, select Error-level event detected-Action Policy. Select DingTalk as the notification channel, select the sampleWebhook, set Reminders to Disabled, set Send Period to Any, and set Repeat Interval to 1 minute. -
-
Alert notification
After you create the alert monitoring rule, you will receive an alert notification in your DingTalk group if more than 5 anomalies are detected within the last 4 hours. You can also click Details to view the logs that triggered the alert and trace the issue.