You can correlate monitoring results across multiple query result sets using set operations and configure no-data alerting to detect data collection interruptions.
Monitoring timeliness
-
How monitoring works
The alerting system periodically executes the configured query statement based on the Check Frequency, runs it against data in a specified time range, and evaluates the results against the alert condition. An alert is triggered if the condition evaluates to true.
-
Analysis of timeliness issues
-
Data indexing latency: A delay exists between when data is written to Simple Log Service and when it becomes available for querying. Even a short delay can cause data to be missed.
For example, an alert check runs at 12:03:30. The query is configured for a relative time range of the last minute, and the Check Frequency is set to a fixed interval of 1 minute. This sets the query's time range to [12:02:30, 12:03:30). A log entry written at 12:03:29 might not be indexed and available for querying by 12:03:30 and could therefore be missed by the query.
-
Query accuracy: When logs with different timestamps within the same minute are written in a batch, Simple Log Service may index the entire batch by using the timestamp of the earliest log.
For example, an alert check runs at 12:03:30 with a relative time range of one minute, which is [12:02:30, 12:03:30). Suppose multiple log entries are written as a batch at 12:02:50, but their individual timestamps are 12:02:20, 12:02:50, and so on. The entire batch might be indexed under the timestamp 12:02:20. As a result, a query that uses the time range [12:02:30, 12:03:30) would fail to find these logs.
-
-
Recommendations for optimizing timeliness
-
Prioritizing accuracy: Follow these recommendations if you require high alert accuracy with no duplicate or missed alerts.
-
To address data indexing latency: In the Query Statistics dialog box, set a relative Query Time Range that ends slightly in the past. For example, set the relative Start At to 70 seconds ago and the End Time to 10 seconds ago. This 10-second buffer helps prevent missed data caused by indexing delays.
-
To address query inaccuracy: In the Query Time Range dialog box, align your Query Time Range to fixed time windows, such as 1 Minute (Time Frame), 5 Minute (Time Frame), or 1 Hour (Time Frame). Set the Check Frequency to match the selected time window, such as 1 minute, 5 minutes, or 1 hour.
-
-
Prioritizing timeliness: Follow these recommendations if you require immediate alerts and can tolerate the possibility of duplicate alerts.
-
To address data indexing latency: In the Query Statistics dialog box, under Query Time Range, shift the relative Start At time further into the past, for example, to 70 seconds ago (relative).
-
To address query inaccuracy: In the Query Statistics dialog box, ensure that the Query Time Range is wide enough to cover the previous interval, for example, by setting it to a relative 90 seconds and setting the Check Frequency to 1 minute.
-
-
Associating query and analysis results
The Simple Log Service alerting system treats query results as sets and supports correlated monitoring across multiple sets.
On the configuration page, each query is identified by a number (0, 1, or 2) and includes a query editor and time range settings. Adjacent queries are linked by the set operations drop-down list. You can use the sorting buttons to reorder or delete queries. The Grouped Evaluation option is at the bottom.
-
Simple Log Service supports correlated monitoring across up to three sets.
-
By default, the first 1,000 rows from the query results are used for set operations. If you use three queries and set the set operation to a value other than No Merge, only the first 100 rows from each query are used.
-
If you use three sets, the system first performs a set operation on the first two sets, then performs a second operation on that result and the third set. For example:
-
Set A LEFT JOIN Set B LEFT JOIN Set C: The system first performs a LEFT JOIN on Set A and Set B, and then joins that result with Set C using another LEFT JOIN.
-
Set A JOIN Set B INNER JOIN Set C: The system first performs a JOIN on Set A and Set B, and then joins that result with Set C using an INNER JOIN.
-
Set A LEFT EXCLUDE JOIN Set B No Merge Set C: The system performs a LEFT EXCLUDE JOIN on Set A and Set B, and ignores Set C.
-
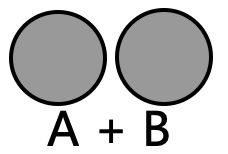
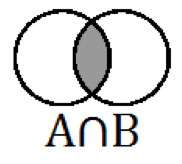
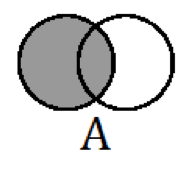
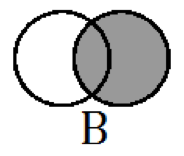
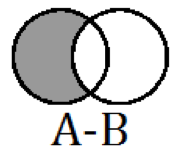
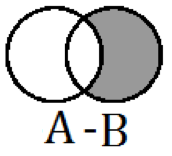
The set operations drop-down list provides the following nine options.
|
Set operations |
Illustration |
Description |
|
|
The two sets are not associated. Set A provides the query results, while Set B serves only as a source of variables for the alert notification template. |
|
|
None |
Combines each row from Set A with each row from Set B. This operation is typically used to filter data for evaluation. |
|
|
|
Merges data from Set B into matching rows of Set A, aligning the rows by field name. |
|
|
|
Returns only rows from Set A that have a matching row in Set B. This effectively uses Set B as a whitelist for Set A. |
|
|
|
Enriches Set A with matching data from Set B. In this case, Set B acts as a dimension table for Set A. |
|
|
|
Enriches Set B with matching data from Set A. In this case, Set A acts as a dimension table for Set B. |
|
|
|
Merges all rows from both Set A and Set B, enriching matching rows with data from the other set. |
|
|
|
Returns only rows from Set A that do not have a match in Set B. This effectively uses Set B as a blacklist for Set A. |
|
|
|
Returns only rows from Set B that do not have a match in Set A. This effectively uses Set A as a blacklist for Set B. |


No merge
-
Requirement
Monitor NGINX access logs. Trigger an alert if the number of 5xx errors exceeds 500 in a 15-minute period. The alert must list the specific hosts that returned errors.
-
The configuration is as follows: the query for Query and Statistics 0 is
status > 500 | select count(1) as cnt, and set operation is set to No merge. The query for Query and Statistics 1 isstatus > 500 | select host, count(1) as pv group by host order by pv desc limit 5. group evaluation is set to No Grouping, and the trigger condition is set to has data, with the conditioncnt > 500. -
Result
-
Results of Query and Statistics 0
Counts the number of 5xx errors within a 15-minute period.
cnt
1234
-
Results of Query and Statistics 1
Identifies the top 5 hosts with the highest number of 5xx errors within a 15-minute period and their corresponding error counts.
host
pv
host1
60
host2
55
host3
47
host4
45
host5
30
-
Result of the set operation
When set operation is set to No merge, the set operation returns the result of Query and Statistics 0.
-
CROSS JOIN
-
Example 1
-
Requirement
Monitor access logs from Object Storage Service (OSS) and Server Load Balancer (SLB). Trigger an alert if the combined count of 4xx errors from OSS and 5xx errors from SLB exceeds 1,000 in a 15-minute period.
-
Configuration: The query for Query Statement 0 is
status >= 400 and status < 500 | select count(1) as pv, and Set Operations is set to CROSS JOIN. The query for Query Statement 1 isstatus >= 500 | select count(1) as pv. For the alert rule, Group Evaluation is set to Ungrouped, and the Trigger Condition is set to Data exists with the condition($0.pv + $1.pv) > 1000. -
Results
-
Results of query statement 0
The number of 4xx errors from OSS in a 15-minute period.
pv
890
-
Results of query statement 1
The number of 5xx errors from SLB in a 15-minute period.
pv
567
-
Results of the set operation
When Set Operations is set to CROSS JOIN, the results are as follows:
$0.pv
$1.pv
890
567
-
-
-
Additional examples
-
Results of query statement 0
a
b
a1
b1
a2
b2
a5
b5
-
Results of query statement 1
a
c
a1
c1
a3
c3
-
Results of the set operation
When Set Operations is set to CROSS JOIN, the results are as follows:
$0.a
b
$1.a
c
a1
b1
a1
c1
a1
b1
a3
c3
a2
b2
a1
c1
a2
b2
a3
c3
a5
b5
a1
c1
a5
b5
a3
c3
-
Join
-
Example 1
-
Requirement
Monitor Nginx access logs from two LogStores, one in the China (Beijing) region and the other in the China (Shanghai) region. Trigger an alert if the total number of hosts with more than 30 5xx errors across both LogStores exceeds 10 in a 15-minute interval.
-
The configuration is as follows: For Query Statistics 0, the query statement is
status > 500 | select host, count(*) as pv group by host having pv > 30, and the Set Operation is JOIN. For Query Statistics 1, the query statement isstatus > 500 | select host, count(*) as pv group by host having pv > 30, Group Evaluation is No Grouping, and the Trigger Condition is has specific number of results greater than 10. -
Result
-
Results of Query Statement 0
This query identifies hosts with more than 30 5xx errors in a 15-minute period and lists their corresponding error counts.
Host
Pv
host1
60
host2
55
host3
47
host4
45
host5
31
-
Results of Query Statement 1
This query identifies hosts with more than 30 5xx errors in a 15-minute period and lists their corresponding error counts.
Host
Pv
hosta
70
hostb
45
hostc
44
hostd
42
-
Result of the set operation
When Set Operations is set to JOIN, the combined result is:
Host
Pv
host1
60
host2
55
host3
47
host4
45
host5
31
hosta
70
hostb
45
hostc
44
hostd
42
-
-
-
Other examples
-
If the result fields from two Query Statements do not match, the JOIN operation fills non-matching fields with None.
-
Results of Query Statement 0
A
B
a1
b1
a2
b2
-
Results of Query Statement 1
B
C
b1
c1
b2
c2
-
Result of the set operation
A
B
C
a1
b1
None
a2
b2
None
None
b1
c1
None
b2
c2
-
-
When using three Query Statements, the system first performs a set operation on Query Statement 0 and Query Statement 1, and then joins that result with the results from Query Statement 2.
-
Results of Query Statement 0
A
B
a1
b1
a2
b2
-
Results of Query Statement 1
A
B
a1
b11
a2
b22
a3
b33
-
Result of joining Query Statement 0 and Query Statement 1
The result of the INNER JOIN operation with the condition $0.a == $1.a is:
A
$0.b
$1.b
a1
b1
b11
a2
b2
b22
-
Results of Query Statement 2
A
B
a3
b333
a4
b444
-
Result of the final set operation
The final result of the JOIN operation is:
NoteThe values from the b field in the results of Query Statement 2 populate the $0.b column in the final result.
A
$0.b
$1.b
a1
b1
b11
a2
b2
b22
a3
b333
None
a4
b444
None
-
-
Inner join
-
Example 1
-
Requirement
Monitor the number of 5xx errors in a specified bucket. Trigger an alert if the count exceeds 1,000 within a 15-minute period. To meet this requirement, you must add resource data to maintain a bucket whitelist.
-
The configuration is as follows: The query statement for Query Statement 0 is
status >=500 | select bucket, count(*) as pv group by bucket having pv > 1000 limit 1000. Set Operations is set to INNER JOIN with the join condition$0.bucket = $1.bucket. For Query Statement 1, the OSS data source (user.test) is selected, which specifies the buckets bucket_03, bucket_04, bucket_05, and bucket_06. Group Evaluation is set to Ungrouped, and the Trigger Condition is set to Data exists. -
Results
-
Results of Query Statement 0
Identifies buckets that have more than 1,000 5xx errors within a 15-minute period.
Bucket
Pv
bucket_01
1600
bucket_02
1550
bucket_03
1470
bucket_04
1450
-
Results of Query Statement 1
The resource data for the buckets.
Bucket
Description
bucket_03
for dev team
bucket_04
for test team
bucket_05
for service team
bucket_06
for support team
-
Results of the set operation
When Set Operation is set to INNER JOIN with the condition $0.bucket == $1.bucket, the result of the set operation is as follows:
Bucket
Pv
Description
bucket_03
1470
for dev team
bucket_04
1450
for test team
-
-
-
Example 2
-
Requirement
Two logstores, one in the China (Beijing) region and one in the China (Shanghai) region, store Nginx access logs. Every 15 minutes, the system queries for clients with more than 30 5xx errors. An alert is triggered if 5xx errors occur in both regions and the error count in the China (Beijing) region exceeds that in the China (Shanghai) region.
-
The configuration is as follows: The query statement for Query Statement 0 is
status >= 500 | select client_ip, count(1) as pv group by client_ip having pv > 30. Set Operations is set to INNER JOIN with the join conditions$0.client_ip = $1.client_ipand$0.pv > $1.pv. The query statement for Query Statement 1 isstatus >= 500 | select client_ip, count(1) as pv group by client_ip having pv > 30. Group Evaluation is set to Ungrouped, and the Trigger Condition is set to Data exists. -
Results
-
Results of Query Statement 0
Identifies clients in the China (Beijing) region that have more than 30 5xx errors within a 15-minute period and their error counts.
Client ip
Pv
192.0.2.4
60
192.0.2.5
55
192.0.2.6
47
192.0.2.7
45
192.0.2.8
31
-
Results of Query Statement 1
Identifies clients in the China (Shanghai) region that have more than 30 5xx errors within a 15-minute period and their error counts.
Client ip
Pv
192.0.2.5
70
192.0.2.6
45
192.0.2.7
44
192.0.2.8
42
192.0.2.9
42
-
Results of the set operation
When Set Operations is set to INNER JOIN, $0.client_ip == $1.client_ip, and $0.pv > $1.pv, the result of the set operation is as follows:
Client ip
Pv
192.0.2.6
47
192.0.2.7
45
-
-
-
Other examples
If the result sets of two query statements contain identically named fields that are not join keys, the system automatically prefixes these field names with $0. and $1. in the final result set.
-
Results of Query Statement 0
A
B
C
D
a1
b1
c1
d1
a2
b2
c2
d2
a3
b3
c3
d3
-
Results of Query Statement 1
A
B
C
a1
b11
c11
a2
b22
c22
-
Results of the set operation
When the Set Operation is INNER JOIN and $0.a == $1.a, the result of the set operation is as follows:
A
$0.b
$0.c
D
$1.b
$1.c
a1
b1
c1
d1
b11
c11
a2
b2
c2
d2
b22
c22
-
LEFT JOIN
-
Results of query statement 0
A
B
a1
b1
a2
b2
a3
b3
-
Results of query statement 1
A
B
C
a1
b11
c1
a2
b22
c2
-
Set operation results
When Set Operations is set to LEFT JOIN with the join condition $0.a == $1.a, the result is as follows:
A
$0.b
$1.b
C
a1
b1
b11
c1
a2
b2
b22
c2
a3
b3
None
None
Right join
-
Results for Query 0
a
b
c
a1
b11
c1
a2
b22
c2
-
Results for Query 1
a
b
a1
b1
a2
b2
a3
b3
-
Set operation result
When Set Operations is set to RIGHT JOIN with the condition $0.a == $1.a, the result is:
a
$0.b
c
$1.b
a1
b11
c1
b1
a2
b22
c2
b2
a3
NULL
NULL
b3
Full join
-
Source data 0
a
b
c
a1
b1
c1
a2
b2
c2
a5
b5
c3
-
Source data 1
a
b
d
a1
b11
d1
a2
b22
d2
a3
b33
d3
-
Set operation results
When you set the Set Operations parameter to FULL JOIN with the join condition $0.a == $1.a, the result is as follows:
a
$0.b
c
$1.b
d
a1
b1
c1
b11
d1
a2
b2
c2
b22
d2
a5
b5
c3
None
None
a3
None
None
b33
d3
LEFT EXCLUDE JOIN
-
Requirement
Monitor 5xx errors for all buckets except those on the blacklist. Trigger an alert if the error count exceeds 1,000 in a 15-minute period. To do this, use resource data to maintain the bucket blacklist.
-
The configuration is as follows: The query for Query Statement 0 is
status >=500 | select bucket, count(*) as pv group by bucket having pv > 1000 limit 1000. The set operation is set to LEFT EXCLUDE JOIN with the join condition$0.bucket = $1.bucket. For Query Statement 1, the OSS data source is (user.test) and the buckets are bucket_03 and bucket_04. Group Evaluation is set to Ungrouped, and the trigger condition is set to data exists. -
Result
-
Results of Query Statement 0
Identifies buckets that have more than 1,000 5xx errors within a 15-minute period.
Bucket
Pv
bucket_01
1060
bucket_02
1055
bucket_03
1047
bucket_04
1045
-
Results of Query Statement 1
The resource data for the buckets.
Bucket
Description
bucket_03
for dev team
bucket_04
for test team
-
Result of the set operation
When the set operation is set to LEFT EXCLUDE JOIN with the condition $0.bucket = $1.bucket, the result is as follows:
Bucket
Pv
bucket_01
1060
bucket_02
1055
-
Right exclude join
-
Requirement
Monitor 5xx errors for all buckets not on the blacklist. Trigger an alert if the error count exceeds 1,000 within a 15-minute period. To do this, add resource data to maintain the bucket blacklist.
-
Configure the settings as follows: for Query Statement 0, select the OSS data source (user.test) and specify bucket_03 and bucket_04. Set Set Operations to RIGHT EXCLUDE JOIN, with the join condition as
$0.bucket = $1.bucket. For Query Statement 1, set the query statement tostatus > 500 | select bucket, count(*) as pv group by bucket having pv > 1000 limit 1000. Set Group Evaluation to No Grouping, and set the Trigger Condition to Data exists. -
Result
-
Results of Query Statement 0
Returns the resource data for the buckets on the blacklist.
Bucket
Description
bucket_03
for dev team
bucket_04
for test team
-
Results of Query Statement 1
Returns buckets with more than 1,000 5xx errors in a 15-minute period.
Bucket
Pv
bucket_01
60
bucket_02
55
bucket_03
47
bucket_04
45
-
Result of the set operation
When Set Operations is set to RIGHT EXCLUDE JOIN with the join condition $0.bucket = $1.bucket, the result is as follows:
Bucket
Pv
bucket_01
60
bucket_02
55
-
No-data alert
No-data alerts detect unnoticed data loss during data collection. For example, you can create an alert rule to monitor the CPU utilization of each host and receive an alert notification if either of the following conditions is met:
-
CPU utilization exceeds 95%.
-
No data is returned from the query and analysis.
Configure the alert rule as follows:
-
Query statistics: Specify a query to calculate CPU utilization.
* | select promql_query_range('cpu_util') from metrics limit 1000 -
Trigger Condition: Data matches the expression, value>95, Severity: Medium
If the value field in the query and analysis results exceeds 95, a medium-severity alert is triggered.
-
Threshold of Continuous Triggers: The number of consecutive times the trigger condition must be met before an alert is generated.
-
No-data alert: Turn on the no-data alert switch, and set the severity and annotation.
When enabled, an alert is triggered if the number of consecutive queries that return no data exceeds the continuous trigger threshold.
You can set a separate severity and annotation for no-data alerts.
The page is configured as follows:
For grouping evaluation, select Automatic by label. In the Add annotation section, set the title to ${alert_name} alert triggered and the description to ${alert_name} alert triggered. Disable automatic annotation and recovery notification. In advanced settings, set the continuous trigger threshold to 1. Enable no-data alert, and set its severity to Medium, its annotation title to ${alert_name}: No data, and its description to No data was returned when this alert rule was evaluated.