
By Qianfeng (Alibaba Cloud Function Compute R&D Engineer)
If the execution result does not meet expectations in the application development process (or after the development), you need to perform certain debugging work. However, under the Serverless architecture, debugging work is limited by some environmental factors. For example, the developed application is healthy locally and runs in line with expectations, but there are some problems with the Functions as a Service (FaaS) platform. There is no local way to simulate the online environment in some special environments, so it is difficult to develop and debug the project.
This article will use the Serverless Devs tool to guide the breakpoint debugging steps of Function Compute (FC) applications in detail. It will help you realize Serverless breakpoint debugging and clarify the debugging sequence steps from the following four aspects.
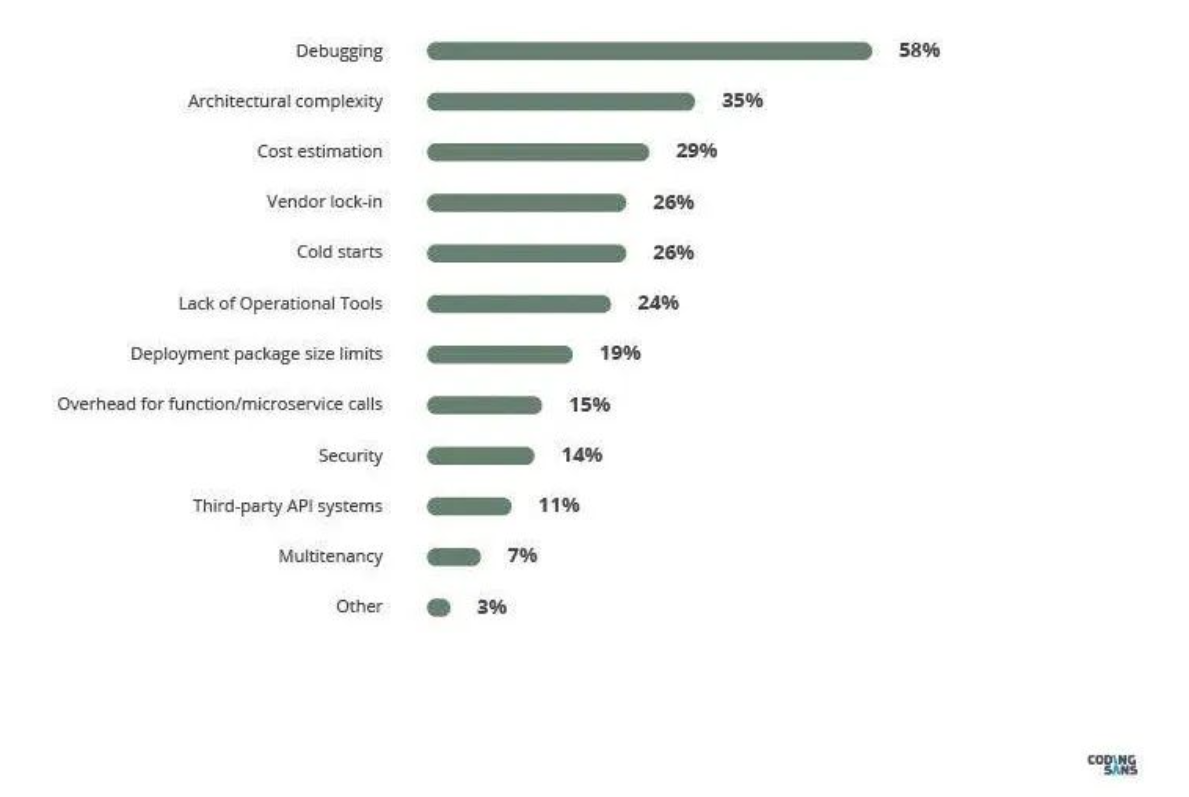
Under the Serverless application architecture, debugging capability is a concern of application developers, which determines the efficiency of program development. In the industry research report on Serverless (without servers), Hackermoon pointed out that, Debugging is still the biggest pain point and challenge of Serverless landing so far.
Report: Top 5 Serverless Trends
Debugging capabilities include two types. The first type is the ability to run programs, and the second type is the breakpoint debugging capability. The former is the basic ability to debug, which can help developers judge whether the program can run normally and verify the correctness of the program running results. The latter is an advanced capability of debugging, which can help users locate the location that causes the program to run incorrectly or does not meet expectations.
Currently, the existing Serverless application debugging methods in the industry aim to perform debugging in a local simulation cloud execution environment or deploy the application to the cloud and run it based on logs for debugging. However, local debugging cannot simulate the cloud network environment, while cloud debugging lacks local flexibility.
The Alibaba Cloud Function Compute Team has developed a set of innovative debugging tools in the industry after some exploration to overcome these defects and use Serverless debug applications easily. The tools provide all-around local debugging and end-cloud debugging capabilities.
Please click Innovative Launch Serverless Debugging Device: End-Cloud Debugging for more information.
Local Debugging: Based on the local environment and network, Serverless applications rely on containerization technology to achieve debugging. More details are available at the link below:
https://github.com/devsapp/fc/blob/main/docs/en/command/local.md
End-Cloud Debugging: Based on the local environment, it breaks through network restrictions and relies on containerization technology to run Serverless applications. It breaks through the barriers between local and cloud networks and ensures interaction with cloud resources. More details are available at the link below:
https://github.com/devsapp/fc/blob/main/docs/en/command/proxied.md
The local debugging tools mentioned in this article provide breakpoint debugging capabilities and are fully compatible with Serverless application development specifications. The following shows the specific operation steps for breakpoint debugging.
The following are the breakpoint debugging steps. A breakpoint debugging journey around these four steps will start.
Before debugging, you need to perform some pre-operations. In this article, the pre-operations are divided into general pre-operations and the pre-operations of end-cloud joint debugging.
Please refer to this GitHub link for information about the use of the new generation Function Compute tool chain
After preparing for the preceding precondition, let's understand the specific parameters related to breakpoint debugging in the debugging instruction first:
-c, --config [vscode/pycharm/intellij]   [Required] Select which IDE to use when
                                       debugging and output related debug
                                       config tips for the IDE. value:
                                       vscode/pycharm/intellij

-d, --debug-port number              [Required] Specify the local function
                                       container starting in debug mode, and
                                       exposing this port on localhost

--debug-args string                  [Optional] Additional parameters that
                                       will be passed to the debugger

--debugger-path string               [Optional] The path of the debugger on
                                       the host

--tmp-dir string                     [Optional] The temp directory mounted to
                                       '/tmp' , default:
                                       './.s/tmp/invoke/serviceName/functionName/'
When using breakpoints debugging, --config parameters and --debug-port parameters are necessary:
--config specifies the IDE environment for breakpoint debugging. Currently, VSCode, PyCharm, and Intellij are supported.--debug-port specifies the listening port for debugging.In addition, the remaining three parameters are optional:
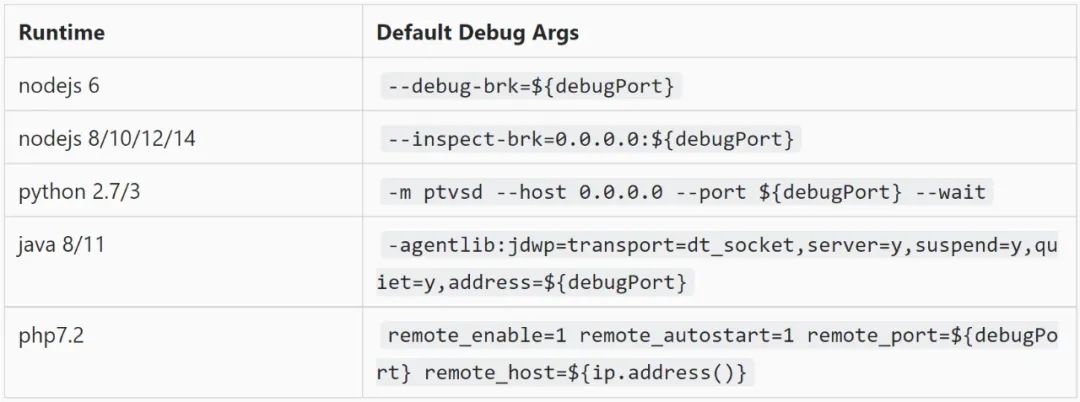
--debug-args will customize the debugging parameters when the program starts. If the default debugging parameters are not specified, please refer to the appendix at the end of the article.
--debugger-path will mount the locally specified path to the /tmp/debugger_file of the program running environment.--tmp-dir will mount the locally specified path to the /tmp directory in the program running environment. During debugging, the /tmp result file written by the program will be mapped to the local directory to verify whether the results are as expected.When using VSCode for breakpoint debugging, the process is simple. Next, the breakpoint debugging scenario is divided into Event function debugging and Http function debugging, which are introduced respectively.
Step 1: Start the Serverless application, open the terminal, enter the target project, and enter the start command:
# Local Debugging
$ s local invoke --config vscode --debug-port 3000

# End-Cloud Debugging
$ s proxied setup --config vscode --debug-port 3000
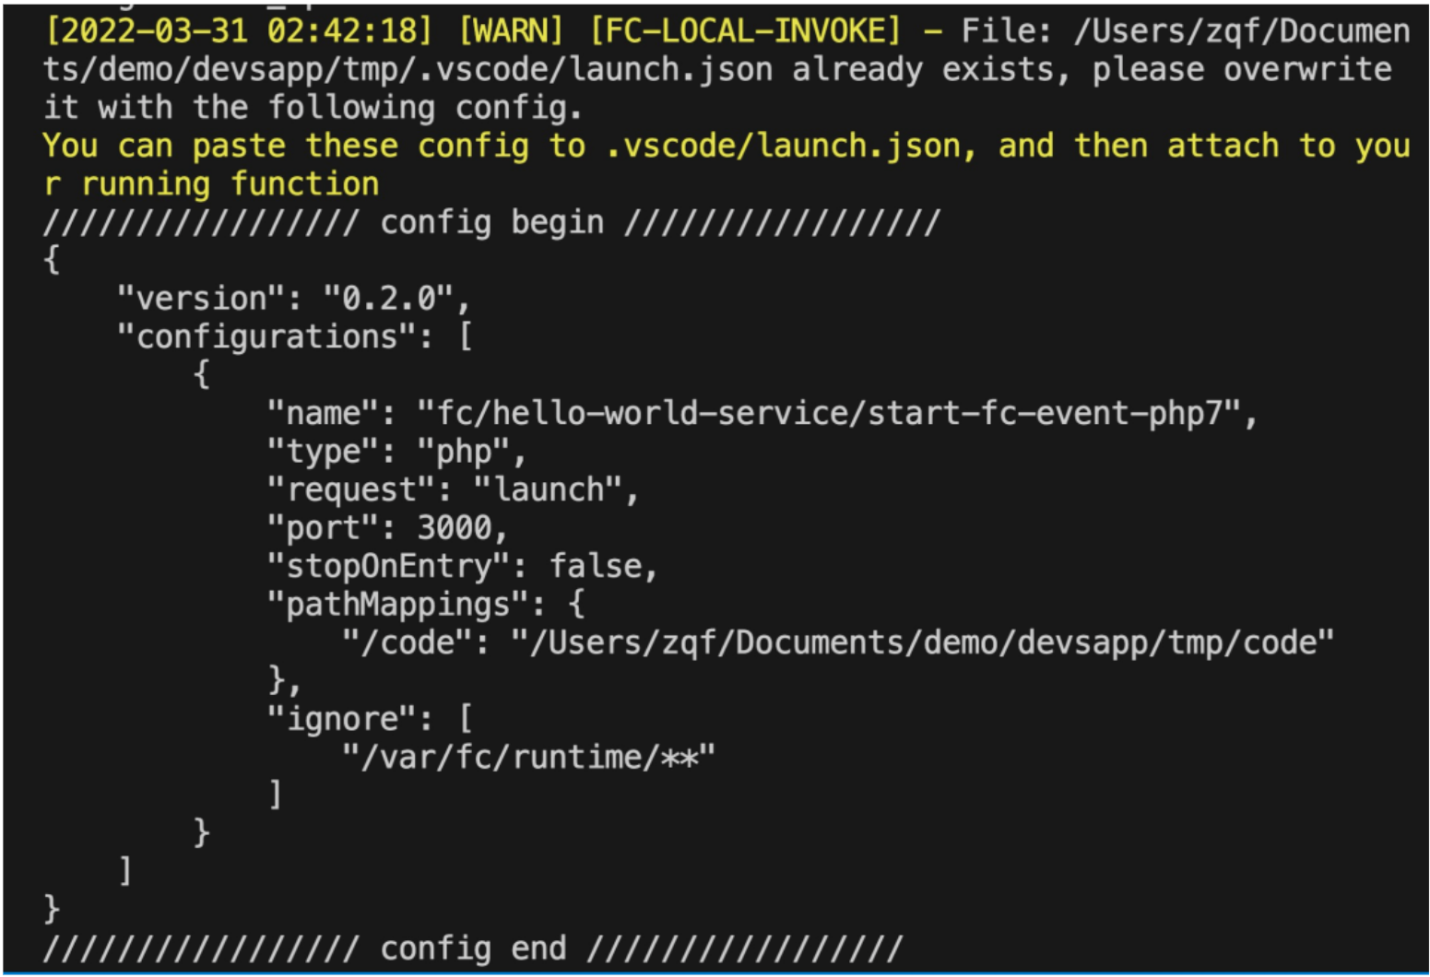
After the startup instruction is executed, the local Function Compute execution environment will be blocked, and we need to wait for the call. At the same time, the current project will generate a .vscode/launch.json file, which is a configuration file for debugging based on VSCode. If the file already exists, the startup instruction will print the corresponding configuration text, as shown in the following figure. This part of the content needs to be used to overwrite the content in the existing vscode/launch.json.
. vscode/launch.json update content example
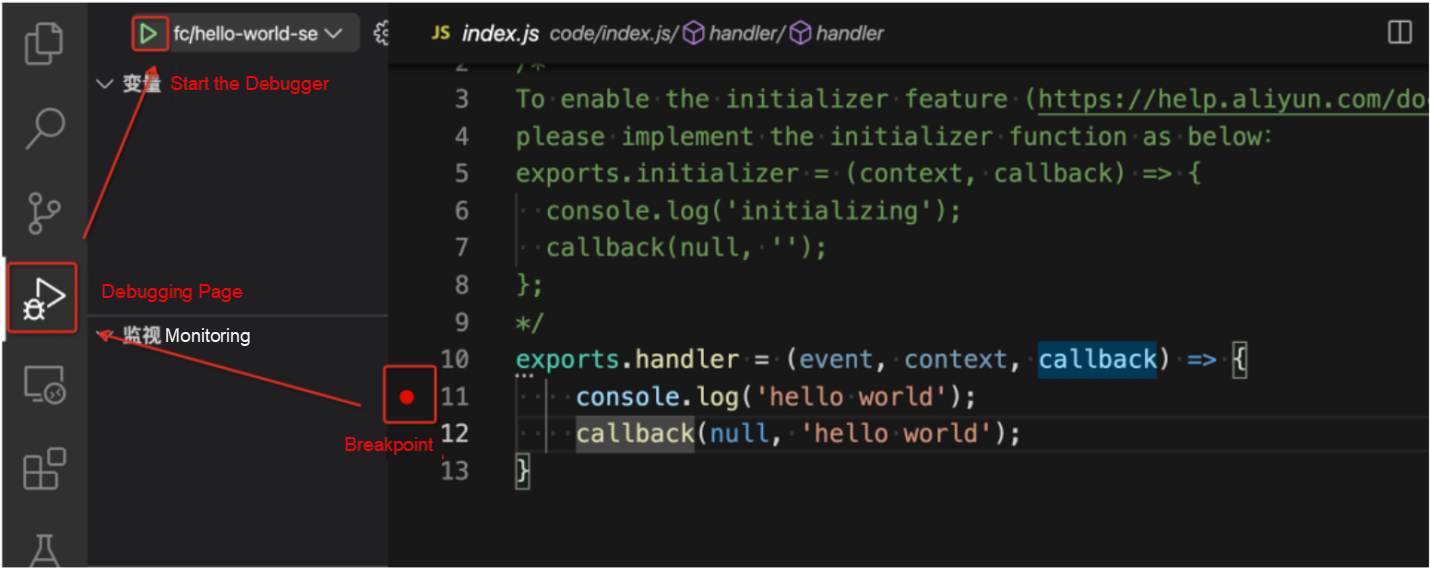
Step 2: Start the breakpoint debugger, open the VSCode interface, open the source code stored in the codeUri in s.yml, set a breakpoint for it, and click the Start Debugging button, as shown in the following figure:
VSCode Startup Debugger Schematic
For local debugging, after the debugger starts, the program has started. At this time, breakpoint debugging can start. In the case of end-cloud debugging, after the debugger is started, the Debugger attached field appears on the Start Command Terminal page. This indicates that the debugger has been started and is waiting to be called. Then, proceed with the following steps.
Step 3: Start breakpoint debugging, open a new terminal page, enter the s proxied invoke --event "hello" call instruction, the program starts, and the breakpoint debugging starts
Step 4: End breakpoint debugging: After the debugging completes, close the breakpoint debugger actively. In the end-cloud debugging scenario, a series of auxiliary function resources are created. Therefore, after debugging is complete, you need to release the auxiliary resources to prevent additional fees. You only need to execute the s proxied cleanup to release the auxiliary resources.
The local debugging IDE of the php7.2 runtime recommends VSCode. The breakpoint debugging steps are different from other languages, so they are introduced separately. Currently, the php7.2 runtime does not support end-cloud debugging.
Step 1: Start the Serverless application, open the terminal, enter the target project, and enter the start command to s local invoke --config vscode --debug-port 3000.
Unlike before, after the event function startup instruction is executed, it will not block but will directly execute. At the same time, the current project will generate a .vscode/launch.json file, as described earlier.
Step 2: Start the breakpoint debugger, open the VSCode interface, and open the source code codeUr i in s.yml. Mark the breakpoint and click the Start Debugging button, as shown in the following figure:
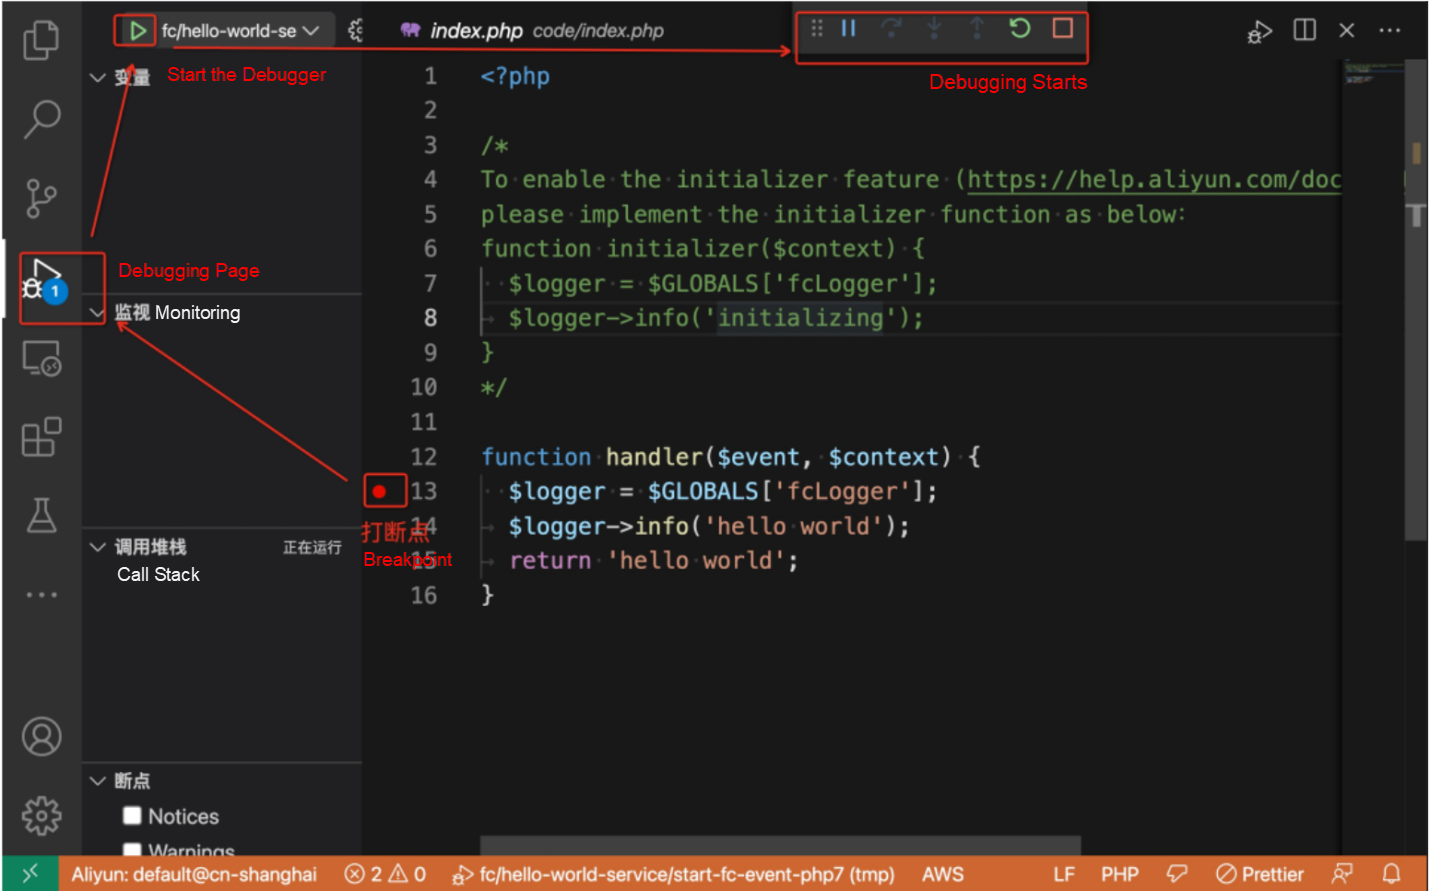
Step 3: Start breakpoint debugging, open a new terminal page, enter the s local invoke --config vscode --debug-port 3000 startup command again, the program starts, and breakpoint debugging starts
Step 4: End breakpoint debugging: After the debugging completes, close the breakpoint debugger actively.
The debugging method of the http function in the end-cloud debugging is the same as the Event function, so we will not repeat it. In this section, we mainly introduce how to debug the http function locally.
Step 1: Start the Serverless application, open the terminal, enter the target project, and enter the start command s local start --config vscode --debug-port 3000. After the start command is executed, the local Function Compute execution environment will block waiting for the call and print the url to access the http function field.
Step 2: Start the breakpoint debugger, open the VSCode interface, open the source code codeUri stored in s.yml, set a breakpoint for it, and click the start debugging button, as shown in the figure. As such, the Debugger attached field appears on the Start command terminal page, which indicates that the debugger has started and is waiting to be called.
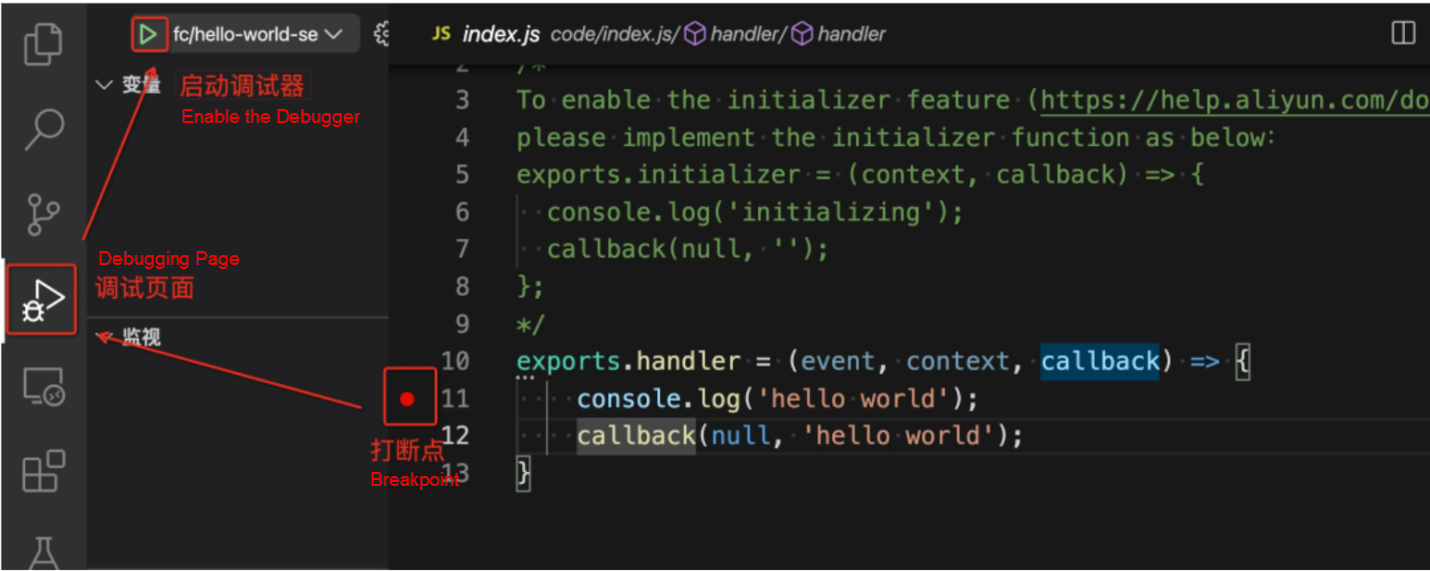
VSCode Startup Debugger Schematic
Step 3: Start breakpoint debugging. You can access the URL of the http function through the curl instruction and browser. The program starts and breakpoint debugging starts.
Step 4: End breakpoint debugging. After debugging completes, actively close the breakpoint debugger, and execute the Ctrl+C on the startup command terminal page to exit the debugging process.
The local debugging IDE of the php7.2 runtime recommends VSCode. The breakpoint debugging steps are somewhat different from other languages, so they are introduced separately. Currently, the php7.2 runtime does not support end-cloud breakpoint debugging.
Step 1: Start the Serverless application, open the terminal, enter the target project, and enter the start command s local start --config vscode --debug-port 3000. After the start command is executed, the current project will generate the .vscode/launch.json file, as mentioned before, and the project will be blocked. Then, you need to execute the Ctrl+C exit.
Step 2: Start the breakpoint debugger, open the VSCode interface, open the source code codeUr i in s.yml, mark the breakpoint, and click the Start Debugging button, as shown in the following figure:
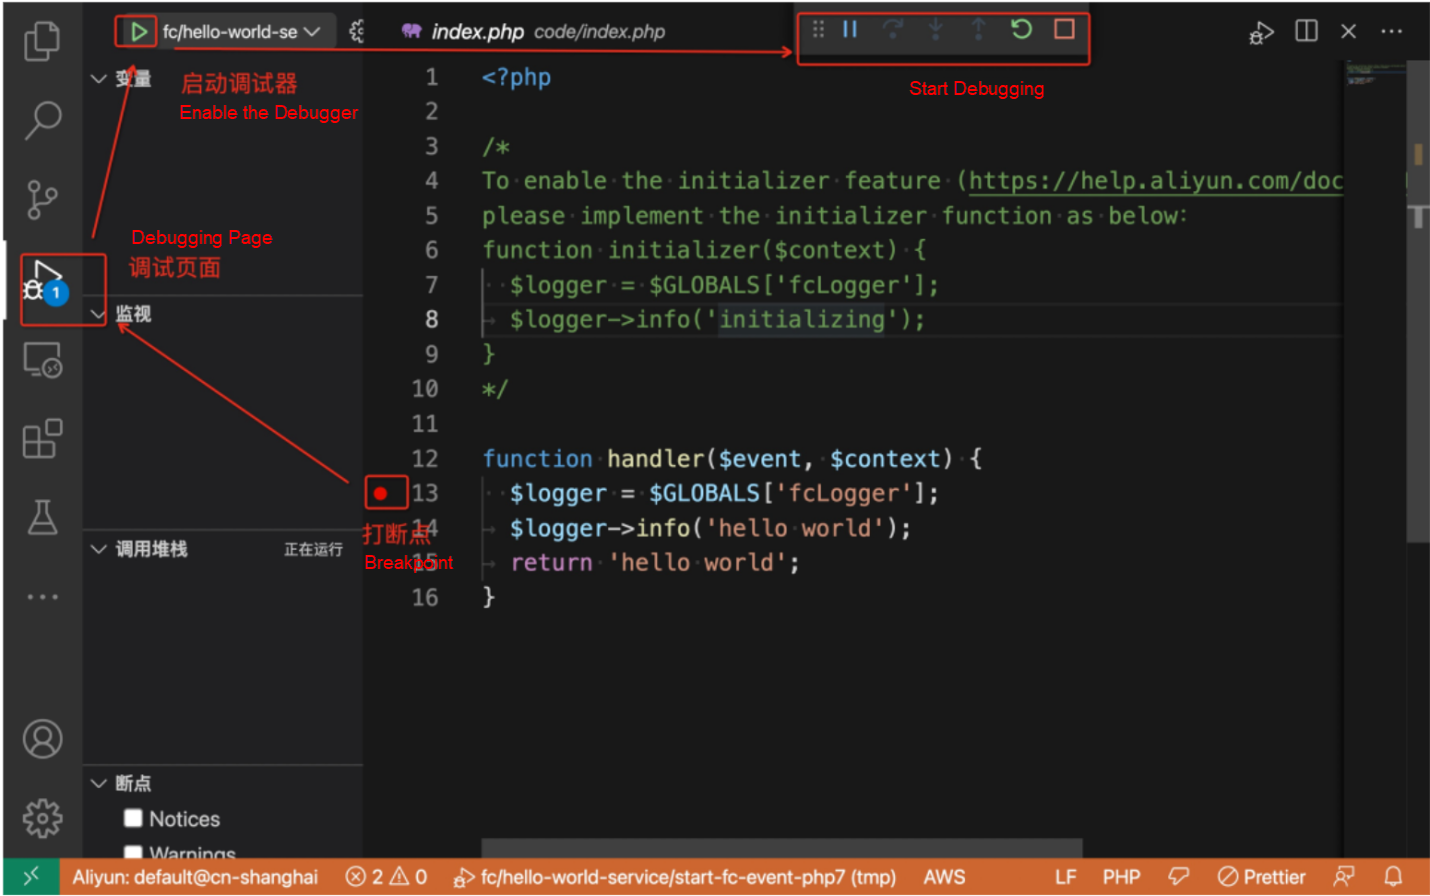
Step 3: Start breakpoint debugging. Open a new terminal page and enter the start instruction s local start --config vscode --debug-port 3000 again. The local Function Compute execution environment will block waiting for the call and print the url fields to access the http function. You can access the URL of the http function through curl instruction and browser. At this time, the program starts and breakpoint debugging starts.
Step 4: End breakpoint debugging. After debugging completes, close the breakpoint debugger actively. Then, execute the Ctrl+C on the Start Command Terminal page to exit the debugging process.
When performing breakpoint debugging based on Intellij, you need to manually configure the corresponding breakpoint debugger in the IDE for different languages. Since the most developed language using Intellij is Java, the only different step after changing the IDE is start the breakpoint debugger. Therefore, we will use the local debugging Java event function as an example to describe the start the breakpoint debugger step in detail.
Step 1: Start Serverless Application. As Java is a compiled language, you need to package the program before you start. In this example, an mvn package will be used to package the function and execute the startup instruction s local invoke --config intellij --debug-port 3000.
Step 2: Start the breakpoint debugger, open the Intellij interface, and choose Run → Edit Configurations in sequence on the menu bar. Then, create a new Remote JVM Debug, as shown in the following figure:
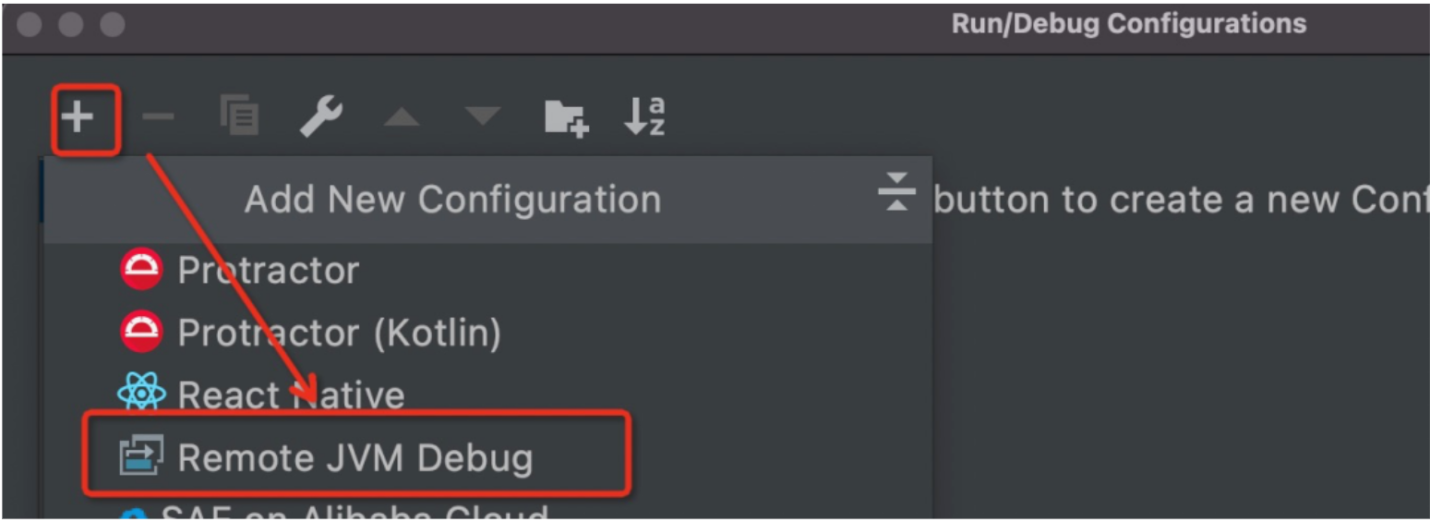
Create Remote JVM Debug
Next, customize the debugger name and set the port to 3000, as shown in the following figure:
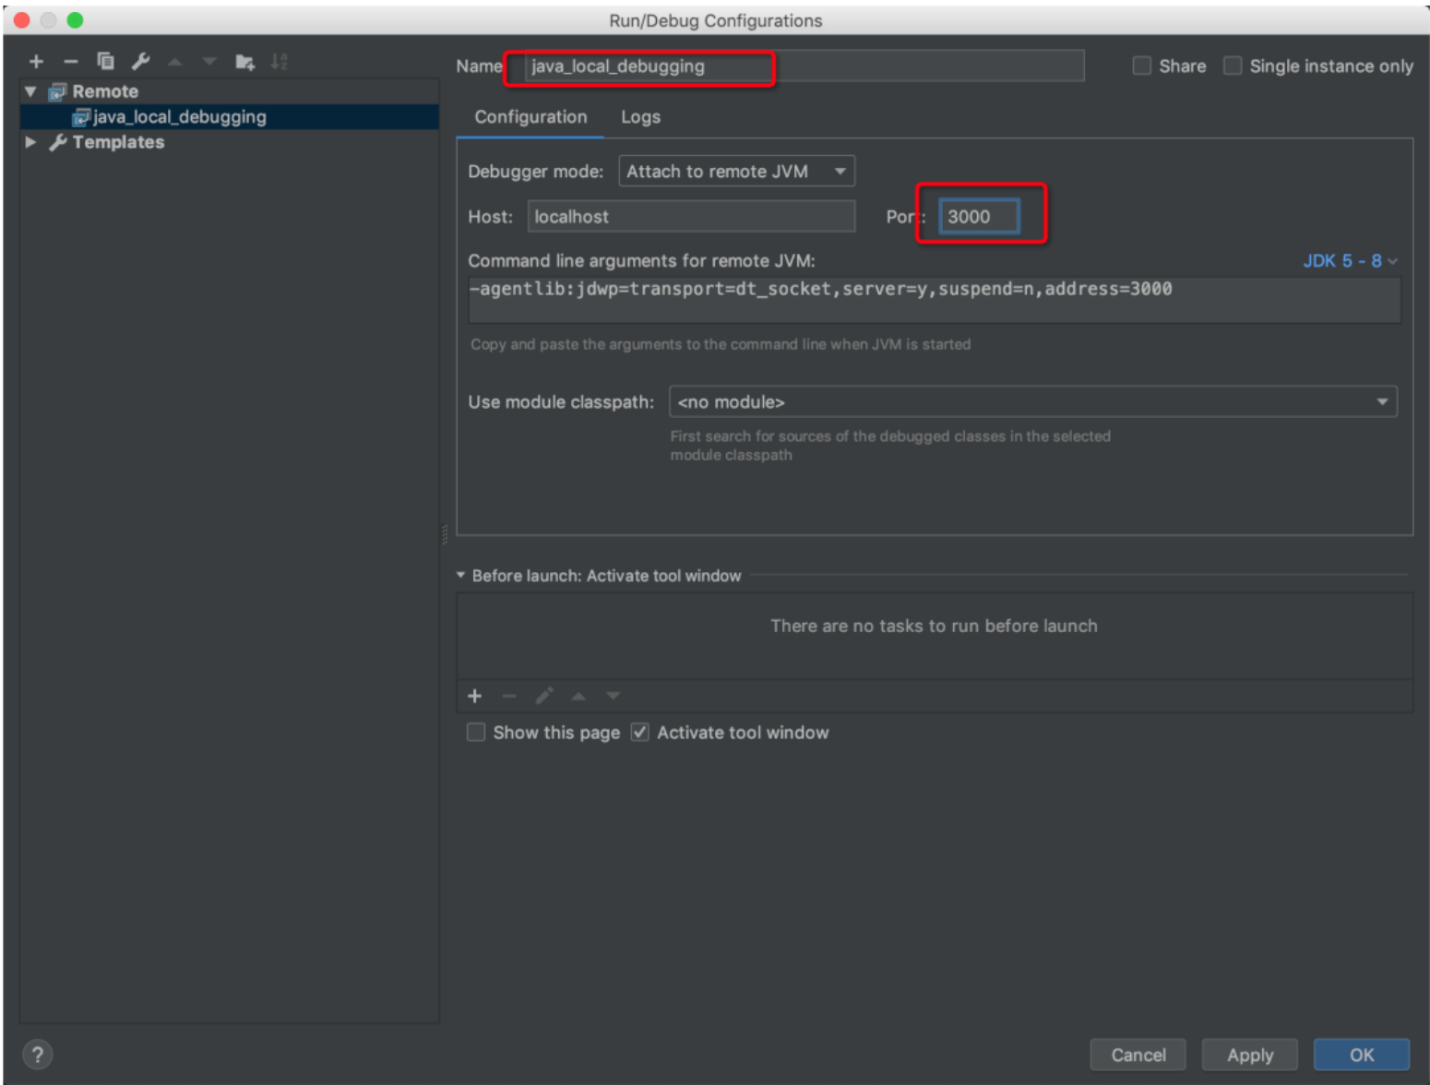
Intellij Debugger Configuration
Finally, open the source code codeUri stored in s.yml, set a breakpoint for it, and click the start debugging button, as shown in the figure:
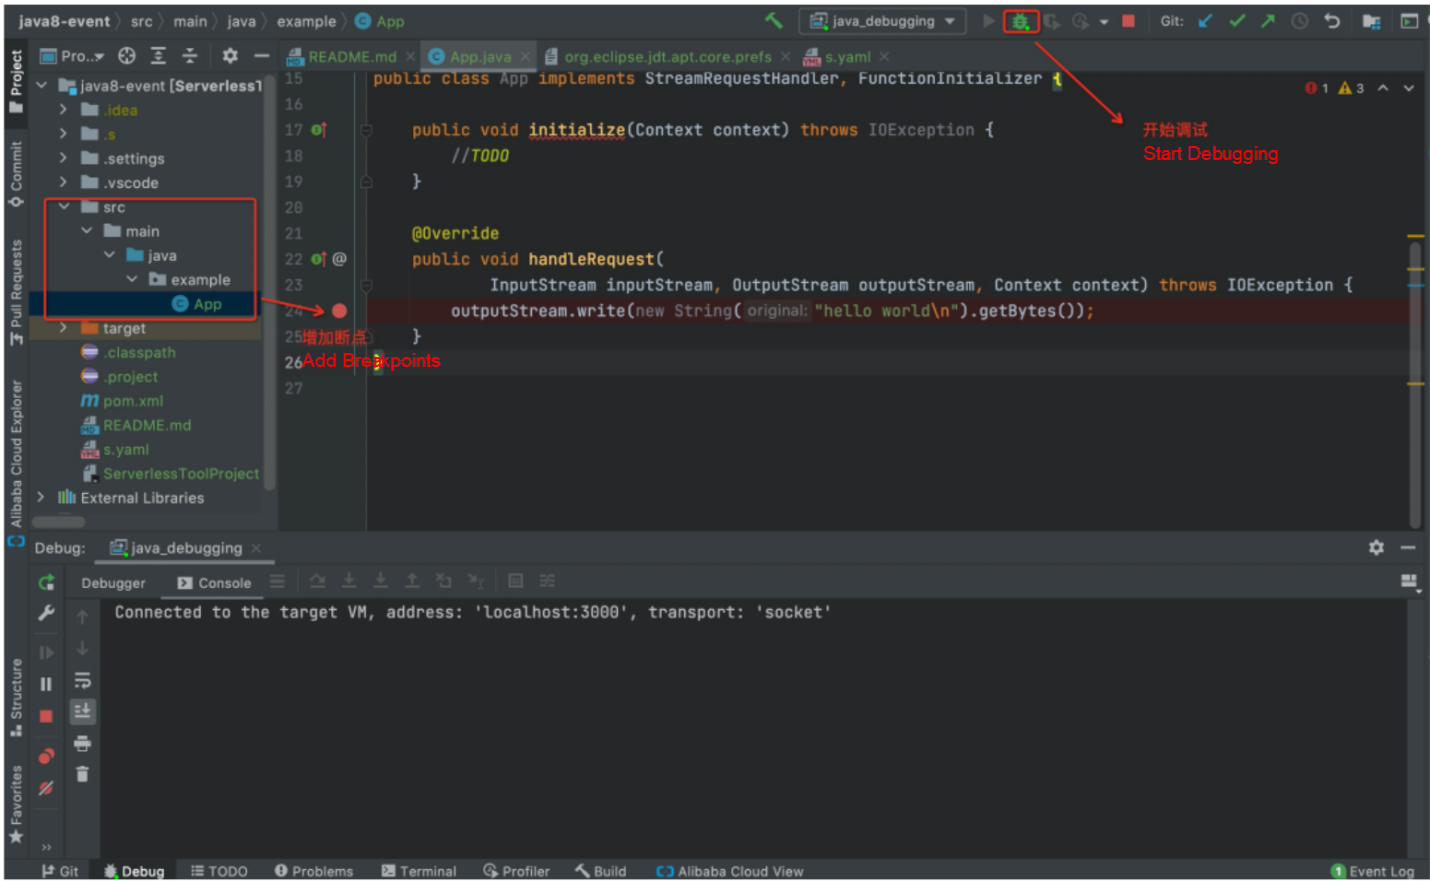
Intellij Starts the Breakpoint Debugger
Currently, only local debugging can perform breakpoint debugging operations in PyCharm. The supported runtime is Python2.7 and Python 3. When performing breakpoint debugging in PyCharm, the breakpoint debugger needs to be configured in the IDE, and the user's source code needs to be intrusively modified. Since the content of the operation steps is different from the conventional content, the debugging steps are explained below in detail:
Step 1: Start the Serverless application, open the terminal, go to the target project, and enter the startup command:
# Event Function
$ s local invoke --config pycharm --debug-port 3000

# Http Function
$ s local start --config pycharm --debug-port 3000
It is different from before. After the event function startup instruction is executed, it will not be blocked but will be directly executed. At this time, the Tips for PyCharm remote debug content needs to be recorded, as shown in the figure. After the recording completes, if it is an http function, the input Ctrl+C will exit the startup program.

Tips for PyCharm Remote Debug Content Example
Step 2: Next, start the breakpoint debugger. Start the breakpoint debugger mainly includes IDE breakpoint debugger configuration and source code update.
First, open the PyCharm interface and select Run → Edit Configurations in sequence on the menu bar.
Next, create a new Python Debug Server, as shown in the figure:
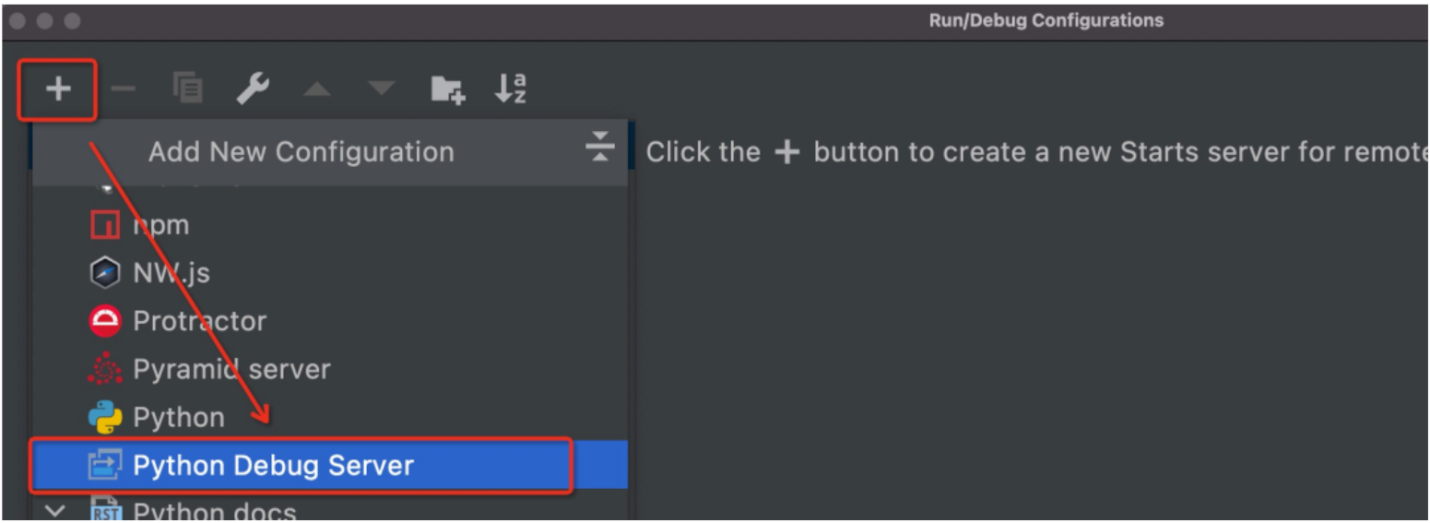
Create Python Debug Server
Then, set the custom debugger name and configure the IDE host name, Port, and Path mappings details of the three debugger configurations based on the content configuration obtained in Figure 5, as shown in the figure:
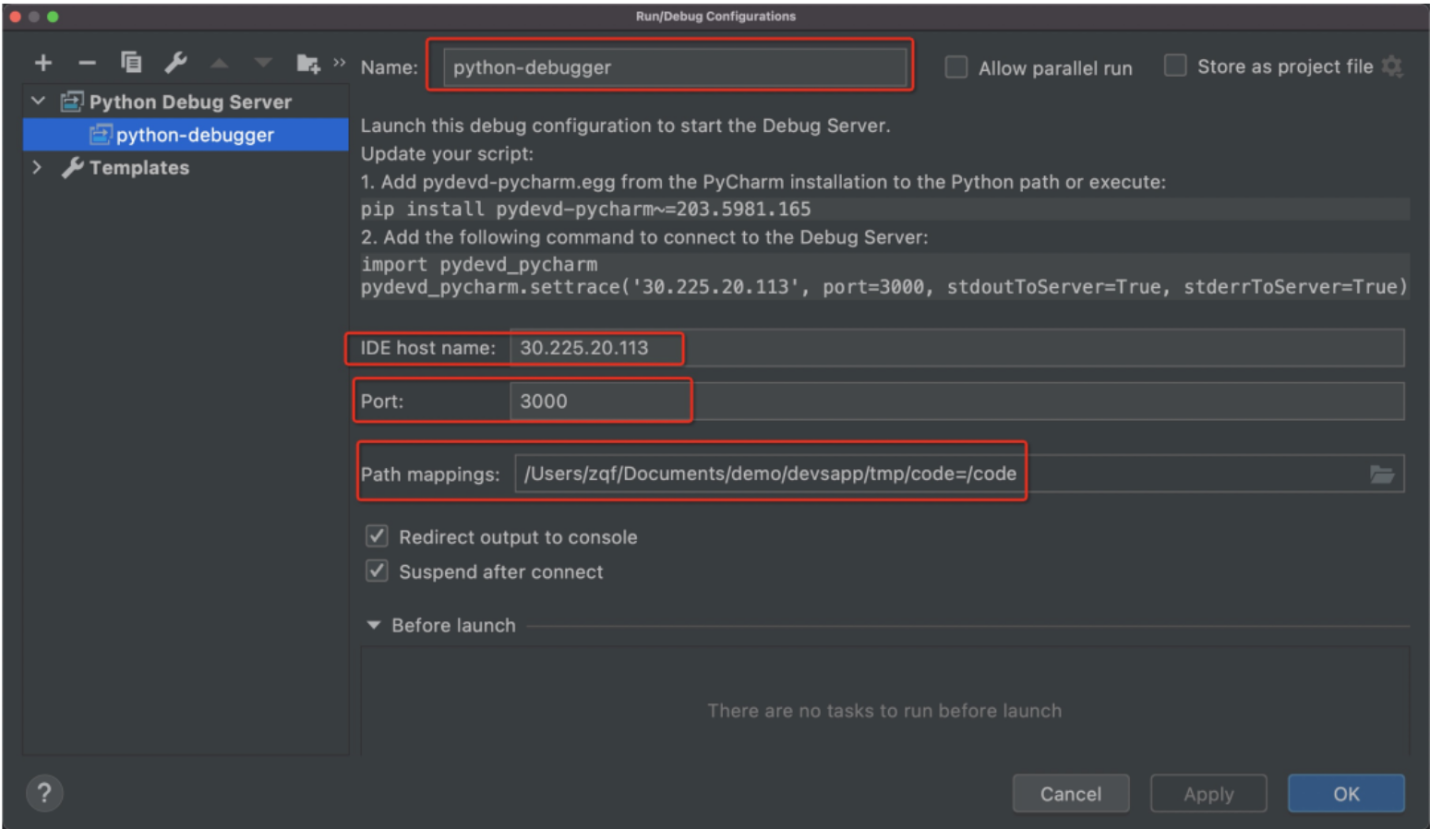
PyCharm Debugger Configuration
Then, open the codeUri source code stored in s.yml, paste the code content in the example diagram (Tips for PyCharm remote debug content example) to the beginning of the code, mark a breakpoint at the specified position of the source code as needed, and click the start debugging button. The specific operation is shown in the figure (PyCharm starts the breakpoint debugger).

Tips for PyCharm Remote Debug Content Example
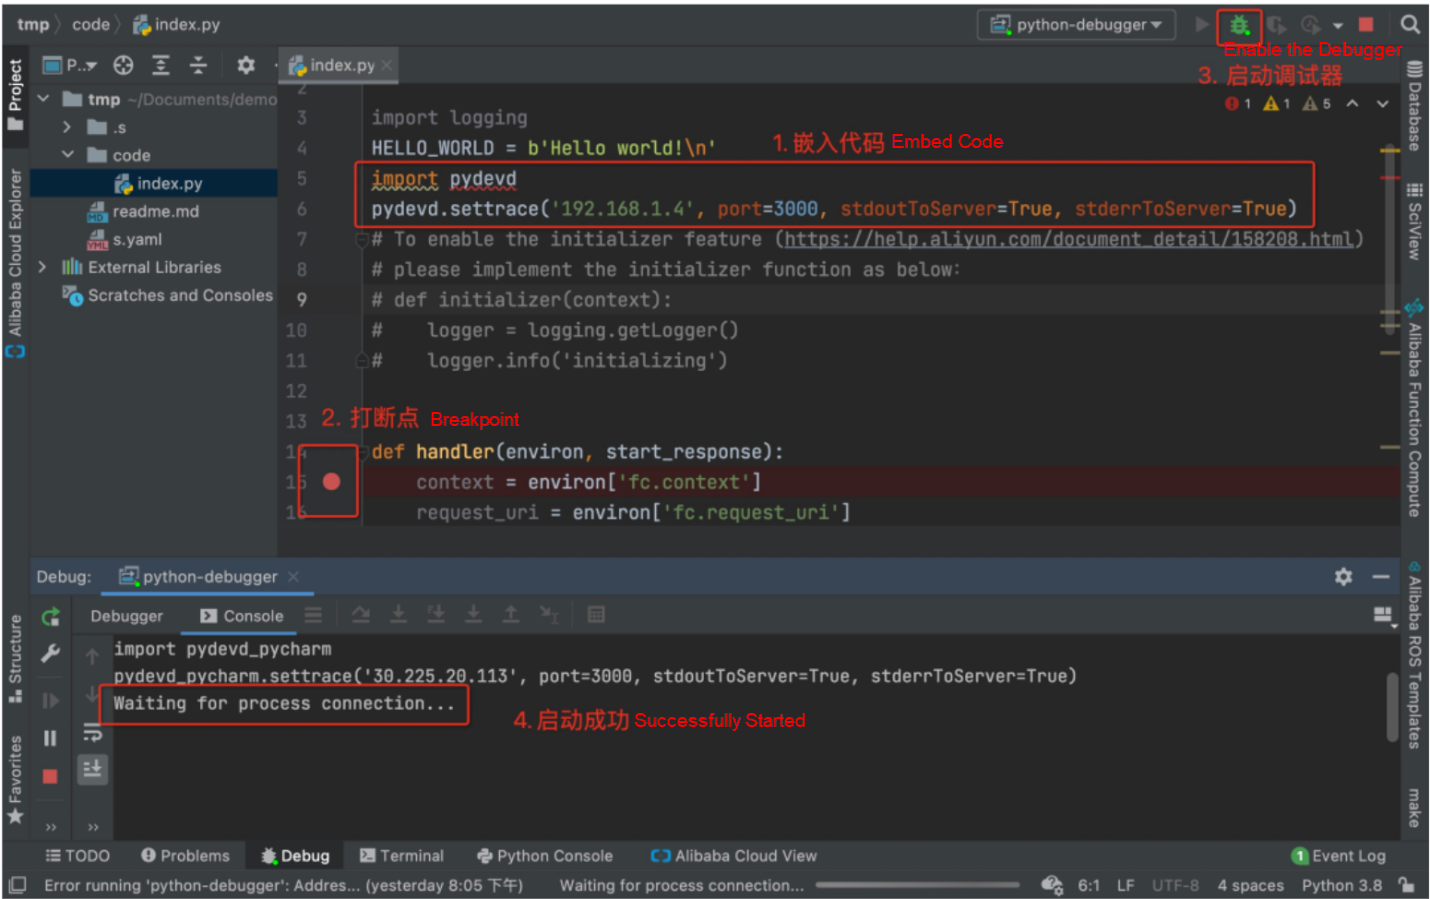
PyCharm starts the breakpoint debugger.
Step 3: Start breakpoint debugging, open the terminal, enter the target project, and execute the startup instruction. Note: You do not need to include relevant parameters for breakpoint debugging.
# Event Function
$ s local invoke

# Http Function
$ s local start
After the Event function startup instruction is executed, it will enter the breakpoint debugging phase. After the http function startup instruction is executed, the URL of the http function can be accessed through curl instruction, browser, etc. At this time, the program will start, and breakpoint debugging will begin.
Step 4: End breakpoint debugging. After debugging completes, close the breakpoint debugger actively. For the http function, Ctrl+C must be executed on the startup instruction terminal page to exit the debugging process.
Although the debugging of Serverless applications has been criticized, various cloud vendors have not given up their in-depth exploration in the debugging direction. Let's take Alibaba Cloud Function Compute (FC) as an example. Currently, it supports multiple debugging solutions, such as online debugging, local debugging, and end-cloud debugging. The application debugging capability provided by the Serverless Devs tool is comprehensive.
The section above shows some practical experiences, but in the process, some points are improved, such as:
We hope this article was helpful!
The following animation tutorials have completed the pre-operation steps mentioned in the article in advance. If you want to refer to the specific animation for practice, please complete the relevant process of pre-operation listed above first.
Even Stronger! AMAP and Serverless Escort Your Spring Festival Travel
99 posts | 7 followers
FollowAlibaba Cloud Community - June 17, 2022
Alibaba Cloud Serverless - June 9, 2022
digoal - May 27, 2022
Alibaba Cloud Serverless - August 21, 2019
卓凌 - September 8, 2020
Alibaba Cloud Community - November 25, 2021
99 posts | 7 followers
Follow Function Compute
Alibaba Cloud Function Compute is a fully-managed event-driven compute service. It allows you to focus on writing and uploading code without the need to manage infrastructure such as servers.
Learn More Serverless Workflow
Visualization, O&M-free orchestration, and Coordination of Stateful Application Scenarios
Learn More Serverless Application Engine
Serverless Application Engine (SAE) is the world's first application-oriented serverless PaaS, providing a cost-effective and highly efficient one-stop application hosting solution.
Learn More Container Compute Service (ACS)
A cloud computing service that provides container compute resources that comply with the container specifications of Kubernetes
Learn MoreMore Posts by Alibaba Cloud Serverless