By Sheng Taotao (Wumu)
Project URL: https://github.com/aliyun/ai-agent-handbook
This article is excerpted from the practical chapters of the open-source project Alibaba Cloud AI Agent Handbook. The project has also launched a mini-game with Agent engineering challenges. You are welcome to try it.
At the beginning of the year, I fixed a bug that left a deep impression on me. In the end, only two lines of code actually needed changing, but checking logs, reviewing monitoring data, and analyzing the issue beforehand took me an entire day. To reproduce the issue, I had to squeeze in repeated debugging sessions between meetings, and it took nearly a week in total to finish. After that, I still had to add test cases and follow up on code review until the code was merged.
AI can already help us write code. But if it only helps me write those two lines, it does not really save much time. Could we also hand over the work that actually consumes all that time?
This article shares some engineering practices from PolarDB-X team: enabling an Agent to start with an alert or a ticket, autonomously investigate, reproduce, fix, and validate the issue, and then hand the results over to developers for review.
PolarDB-X is a distributed database. Databases support the business operations of many users. When something goes wrong, it can disrupt those operations or even cause data corruption. We therefore have very high requirements for correctness and reliability.
Distributed systems are also inherently complex. They have multiple components and modules, and multiple versions may coexist in production. A change in one place can affect other functionality, making coding, troubleshooting, and regression validation more difficult. Involving an Agent in development requires meeting these same requirements.
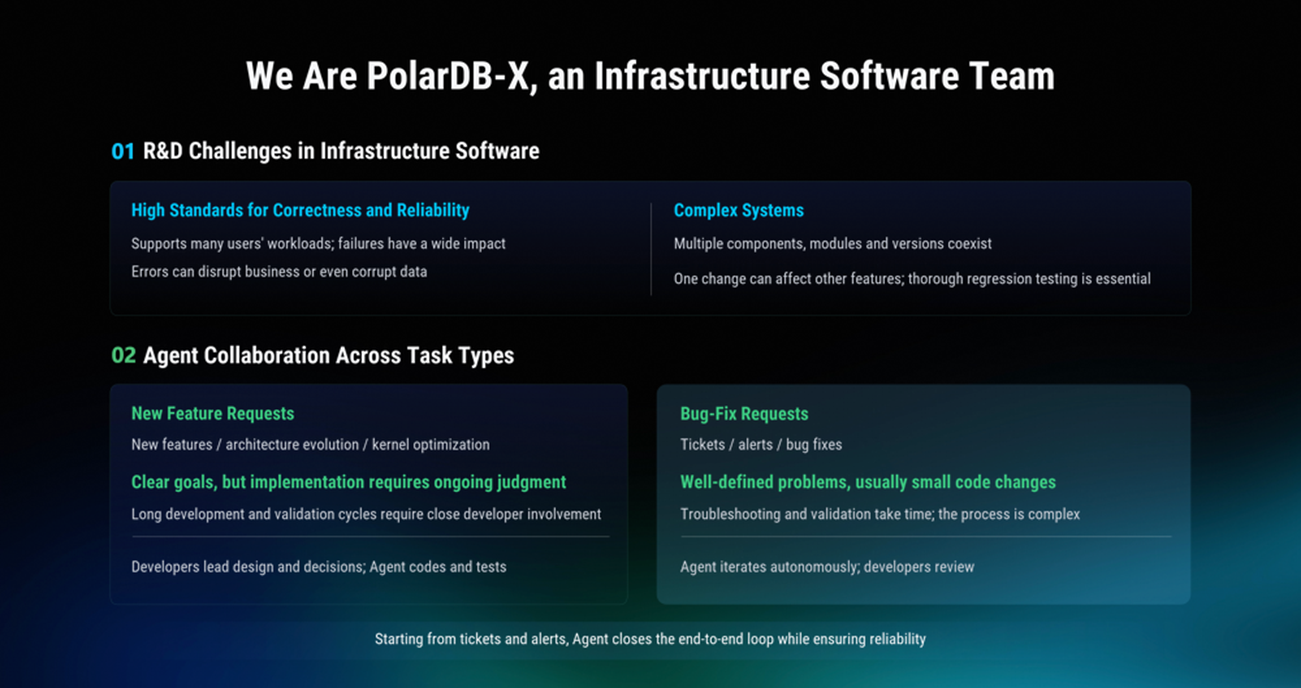
After a period of practical experience, we divided development tasks into two categories and adopted different collaboration approaches for each.
The first category is developing new features or iteratively optimizing existing ones, such as optimizing distributed transactions or implementing new data compression capabilities. These tasks involve more components, and many implementation details need ongoing adjustment during development. Developers still need to lead solution design and key decisions, while the Agent mainly assists with coding and testing.
The second category is handling tickets and alerts, and fixing defects. This work is important for system stability and has long been a pain point for the team. By comparison, the problems these tasks need to solve are relatively well defined, code changes are usually small, and the results can be validated through testing. We therefore tried letting the Agent complete these tasks autonomously, with developers responsible for reviewing the deliverables.
We established an end-to-end repair workflow for this category of tasks.
After receiving an alert or a ticket, the Agent first gathers information about the incident and analyzes possible causes. It then prepares an environment and attempts to reproduce the issue to validate its reasoning. Only after the issue can be reliably reproduced does it modify the code and turn the reproduction procedure into a test case. After passing regression tests, it submits the code and validation results to developers for review.
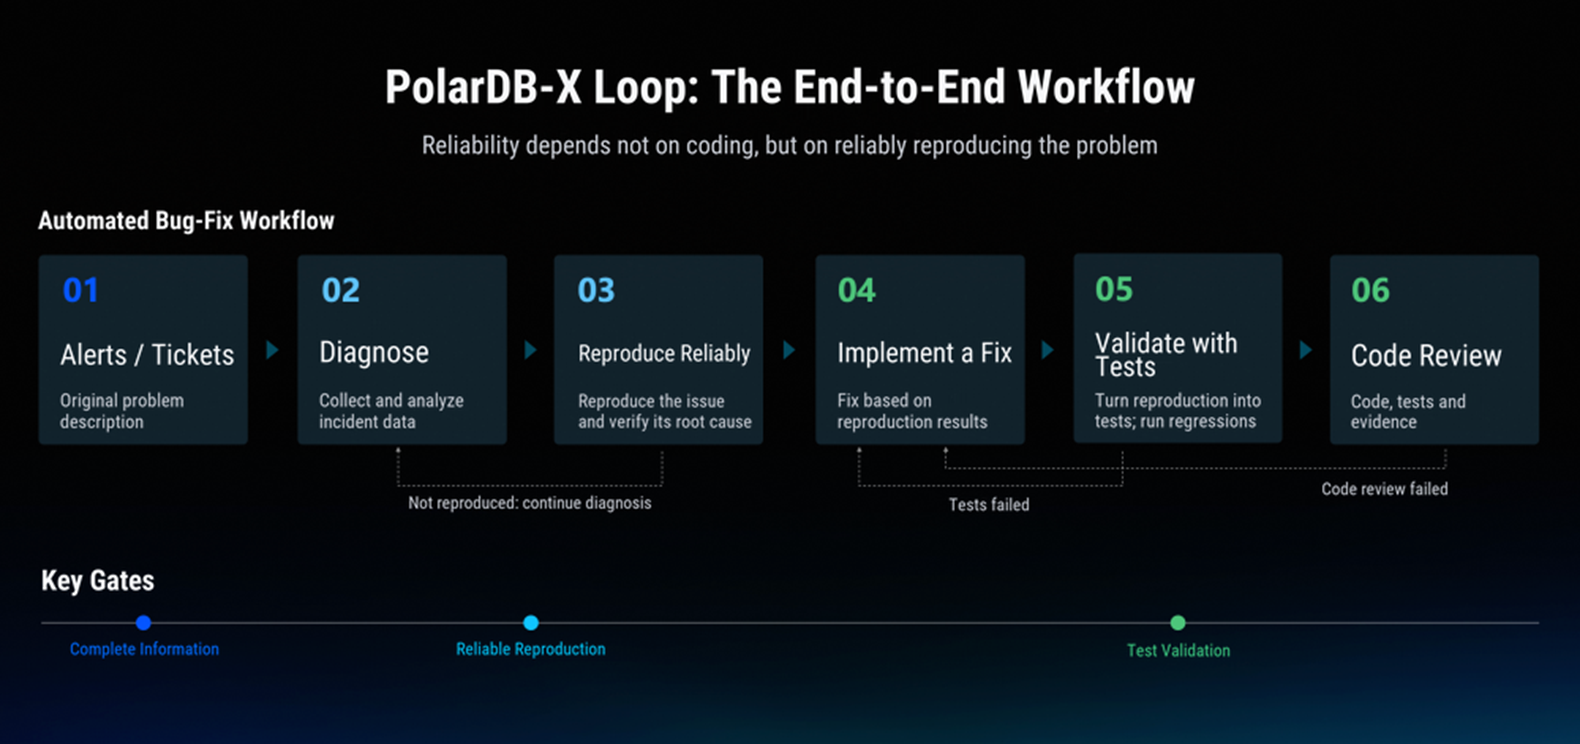
To enable the Agent to complete this workflow autonomously, we first have to ensure that its output is reliable.
When discussing reliability, people tend to focus more on the coding stage, hoping to ensure code correctness through specific Skills or constraints. But in defect repair, reliable reproduction is the most important step. Without reproducing the issue, it is difficult to confirm whether the analysis is correct. If the analysis itself is wrong, even perfectly well-structured code may fail to solve the real problem.
We therefore established three key requirements: incident information must be complete, the issue must be reliably reproducible, and the fix must be validated through testing. All the subsequent work on tools and environments was built around these requirements.
Alerts and tickets usually record only the symptoms of an issue. To define complete requirements for a fix, we also need to gather additional incident information, understand what happened, and determine whether it is a defect.
Initially, developers did all this work. We needed to review monitoring data and check logs, then analyze the issue alongside the source code. Only after confirming that it was a defect did we organize the findings into requirements for a fix and hand them to the Agent.
Later, we tried giving the collected incident information directly to the Agent and letting it analyze the issue and define the requirements itself. In practice, we found that it often did this work better than people: it could establish a clearer timeline before and after the issue occurred, was adept at retrieving and analyzing data from massive volumes of logs, and could also spot key clues overlooked during manual investigation.
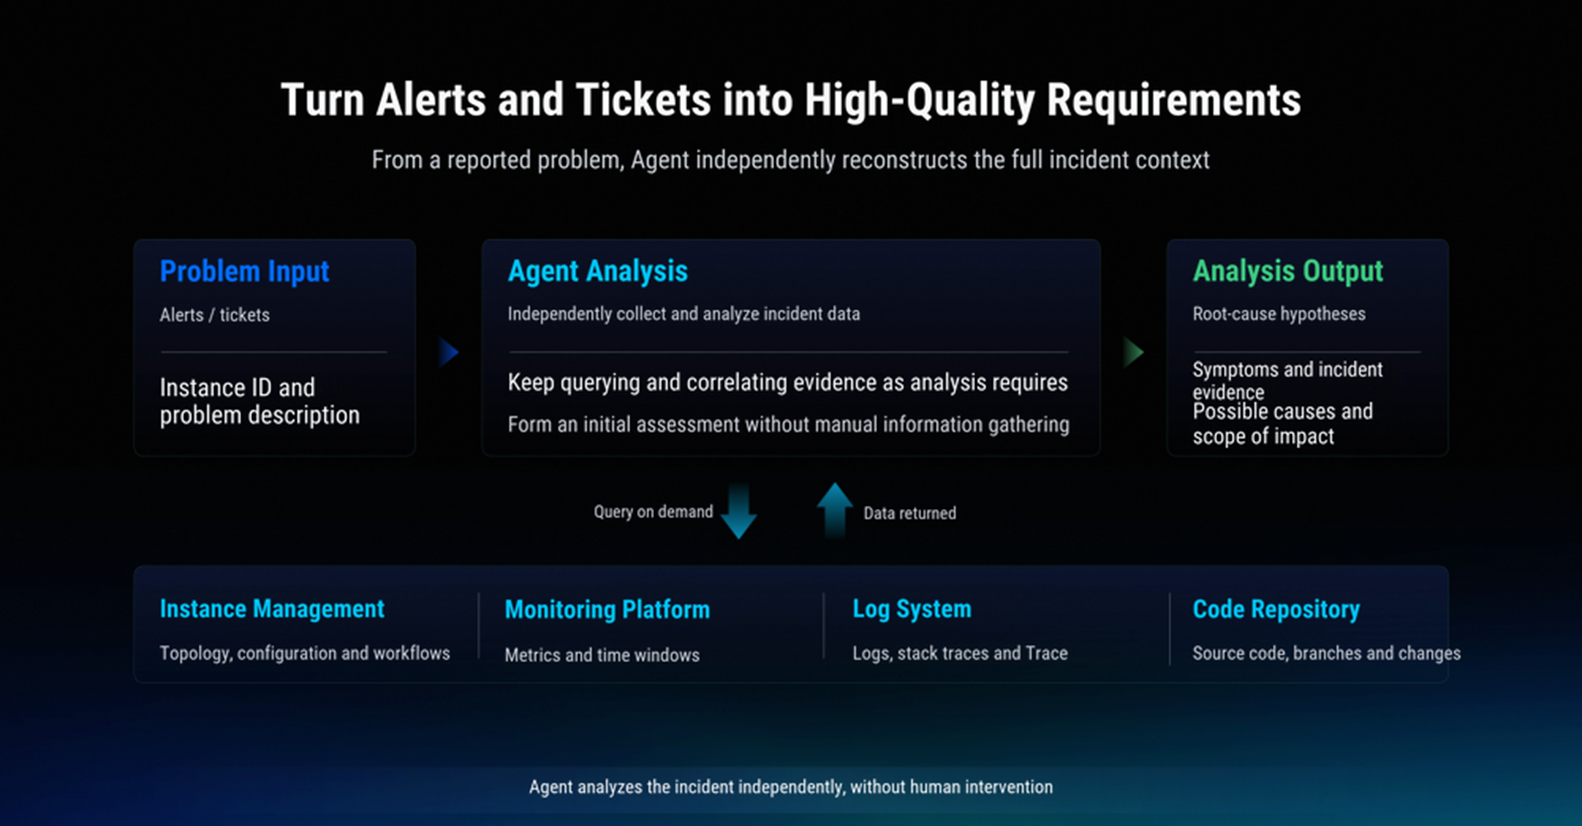
We then went a step further, letting the Agent receive alerts and tickets directly and gather information itself. As needed for its analysis, it can query topology, configuration, and task flows in the instance management platform, inspect monitoring metrics and logs, and continue its analysis by examining implementations and changes in the code repository.
For example, when a SQL statement fails during execution, the Agent can use the instance ID and error information already present in the alert to find the corresponding error stack trace in the logging system, then analyze possible causes using the source code. Ultimately, it compiles the symptoms, incident evidence, and hypotheses about the cause to support subsequent reproduction and repair.
To do this, the Agent must be able to retrieve data from these systems autonomously.
Take the monitoring platform as an example. Previously, we would send screenshots to AI and ask it to help analyze them. Monitoring charts make it easy for people to observe changes, but the Agent also needs to be able to query, parse, and compare raw data on demand.
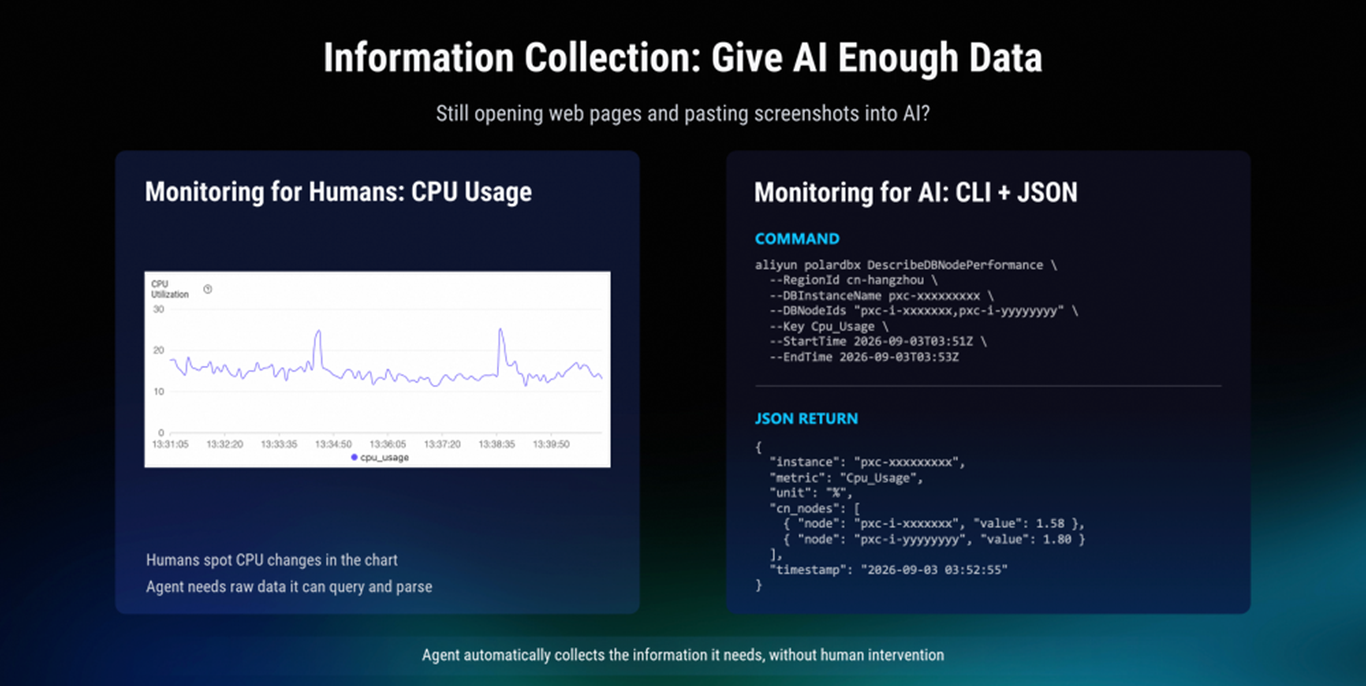
Alibaba Cloud already provides an official command-line tool, or CLI. The Agent can use the command shown in the figure to query PolarDB-X monitoring data, obtain structured data for a specified time range and node, and continue its analysis.
Other commonly used systems also need to provide similar capabilities. For logs, for example, it is best to first collect them in a logging platform such as SLS, then make them available to the Agent through query interfaces or CLI tools. This way, whenever information is missing during analysis, the Agent can look it up itself rather than wait for developers to provide additional material.
Some existing platforms are poorly maintained, and there may be no one available to provide tools suitable for an Agent. In such cases, could we build them ourselves?
There is a popular CLI within Alibaba for grabbing meeting room reservations. A single command can book a meeting room, and an Agent can also schedule a task to automatically grab a reservation at the designated time. Later, we discovered that its author was an ordinary developer who did not have access to the meeting room platform's source code.
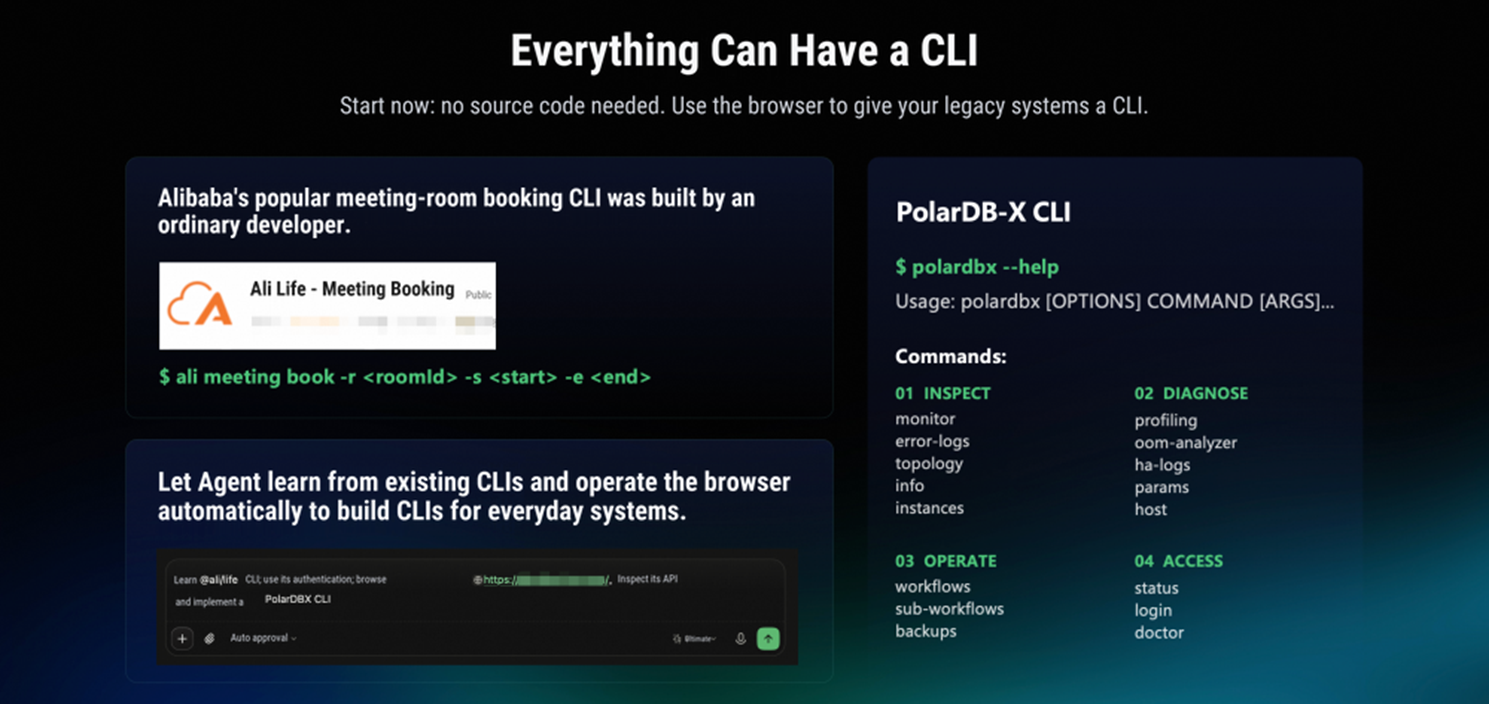
This gave us a straightforward insight: we can also package the functionality we need on commonly used platforms as CLI tools ourselves.
Specifically, we have the Agent refer to the implementations and authentication methods of existing CLI tools, interact with the web pages, analyze the underlying API requests, and finally wrap the functionality we need. Using this approach, we spent about a week integrating commonly used functionality into a set of CLI tools. Information such as monitoring metrics, logs, and instance topology can all be retrieved through commands.
Once information retrieval is in place, the Agent can continue the analysis on its own. But is the analysis it produces necessarily correct?
We encountered a low-probability concurrency issue. It had existed in production for a long time, but because it occurred rarely and was difficult to reproduce, we had never been able to identify its cause.
After receiving the incident information, the Agent produced an analysis report in just a few minutes. It described the code locations, execution flow, and possible failure points in detail, and looked professional and convincing. But after spending about two hours validating it, we found that the explanation did not hold up.
After we fed the results back to it, it quickly produced a new analysis. We validated that one too, and it was still wrong. After several rounds back and forth, we were left with a pile of reports, but the issue remained unexplained. The analysis and report list shown below are from that time; all the explanations of the cause were subsequently disproved by actual validation.
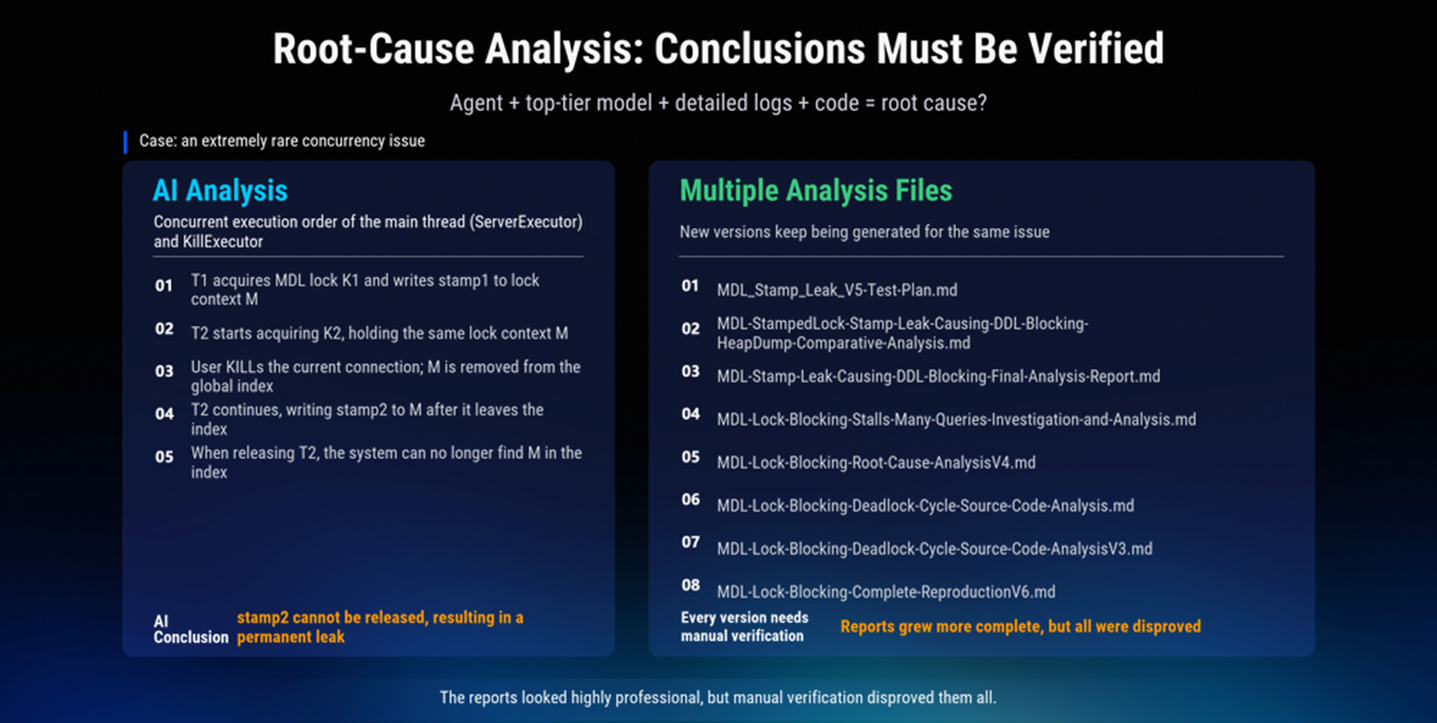
In fact, whether we are investigating an issue ourselves or validating the Agent's analysis, we need to prepare an environment and attempt to reproduce it. When necessary, we also need to debug with breakpoints, control thread execution order, and even inspect memory data.
The Agent at that time lacked these capabilities and could rely only on static code analysis. Its explanations did not match the program's actual runtime behavior, and it could not complete validation independently.
To enable the Agent to carry out validation itself, we added two types of tools: debugging and memory analysis.
Our core components are written in Java, so we initially tried JDB, the debugging tool included in the JDK. It is designed primarily for people and requires ongoing interaction in a terminal. To use it, the Agent has to maintain an interactive process, then send commands and read output through interprocess communication, which makes it cumbersome.
We therefore reimplemented JDB CLI using the Java debugging interface to make it more suitable for the Agent to invoke.
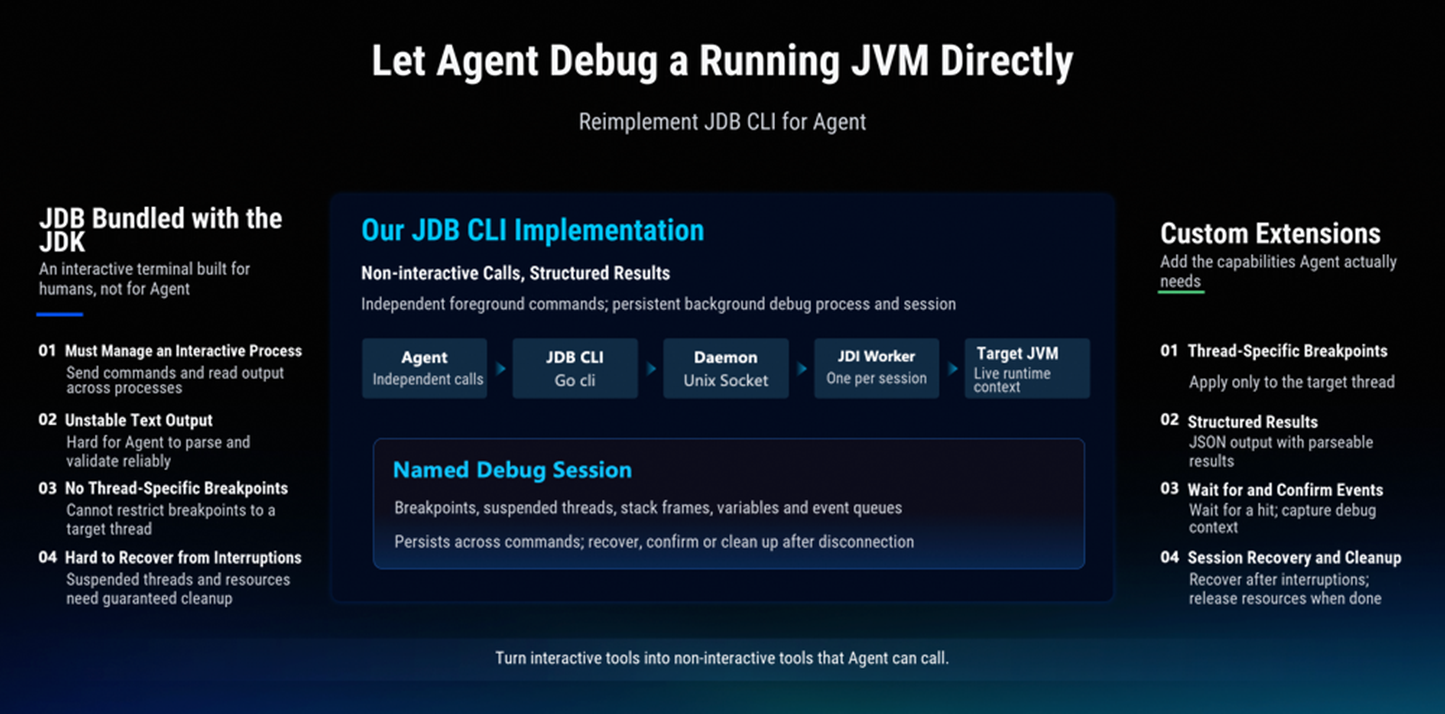
This tool handles session management, keeping the debugging process and its state alive in the background. Each foreground command can exit after execution, and the next invocation can continue operating on the same session. Results are returned in a structured form that the Agent can parse and inspect. It can also wait for a breakpoint to be hit, then retrieve information about the relevant threads, stack frames, and variables.
Another key capability is thread-specific breakpoints: only the target thread can trigger a breakpoint, and only that thread is suspended when it is hit; other threads continue running. Combined with resume operations, this lets us control the relevant threads so that they execute alternately in a specific order.
We used this capability to reproduce the low-probability concurrency issue mentioned earlier.
Besides debugging running programs, we also need to inspect the memory state when a lock leak occurs. By analyzing a snapshot of a Java program's heap memory, known as a Heap Dump, we can examine the field values, reference relationships, and memory usage of the relevant objects.
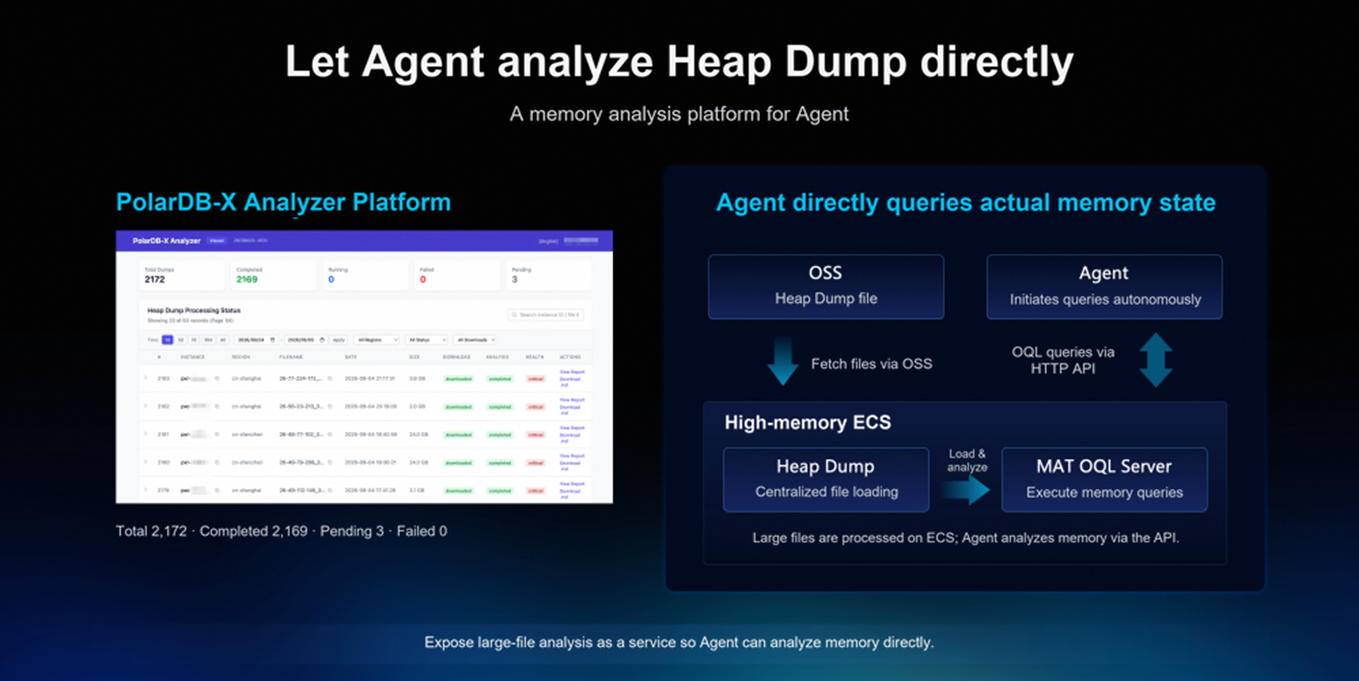
Heap Dump files are usually very large. We place them on a cloud server with a large amount of memory for centralized loading and processing, and provide query interfaces specifically for the Agent. Through these interfaces, the Agent queries the memory data it needs and continues its analysis based on the results, without having to process the entire large file locally itself.
After completing its analysis, the Agent can also upload its analysis records and final report to the platform for developers to consult later. In this way, the memory state becomes evidence that the Agent can directly inspect and cite.
Even with tools in place, the Agent still needs a runtime environment before it can actually attempt to reproduce an issue. We provide two options: a lightweight environment and a full cluster.
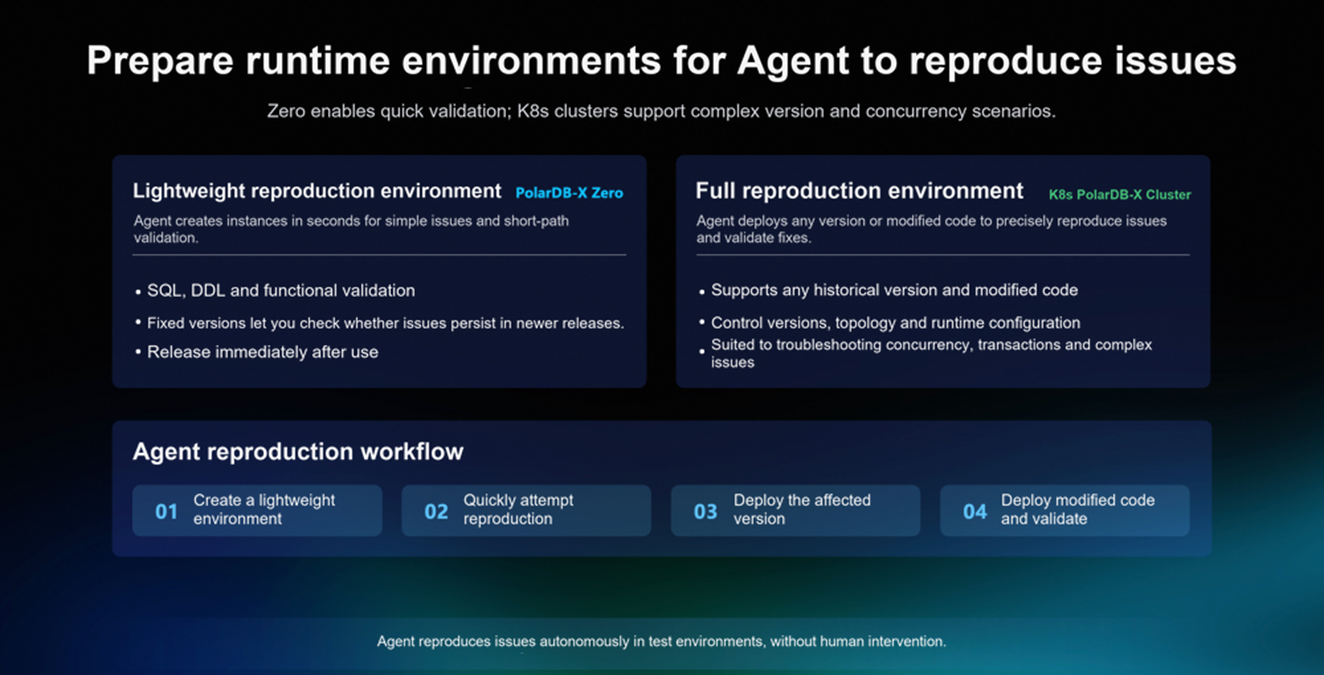
The first option is PolarDB-X Zero. The Agent can create a temporary instance within a few seconds to quickly attempt to reproduce simple issues, such as SQL errors or abnormal functionality, and release it immediately after use. It provides instances with a fixed version, making it suitable for quick initial validation.
If the issue requires a specific historical version or topology, or involves a complex concurrency scenario, we use the full reproduction environment in K8s. The Agent can build a cluster matching the affected instance's version and topology, then attempt to reproduce the issue using the debugging tools.
After completing the code changes, the Agent can also deploy the fixed version to this environment and use the same approach to check whether the original issue has been resolved.
With these tools and environments in place, we returned to the concurrency issue discussed earlier.
This time, the Agent could attempt reproduction itself and continue analyzing and debugging based on actual execution results. After several iterations, it identified the key triggering conditions and reproduced the same MDL lock-leak state seen in the original issue.
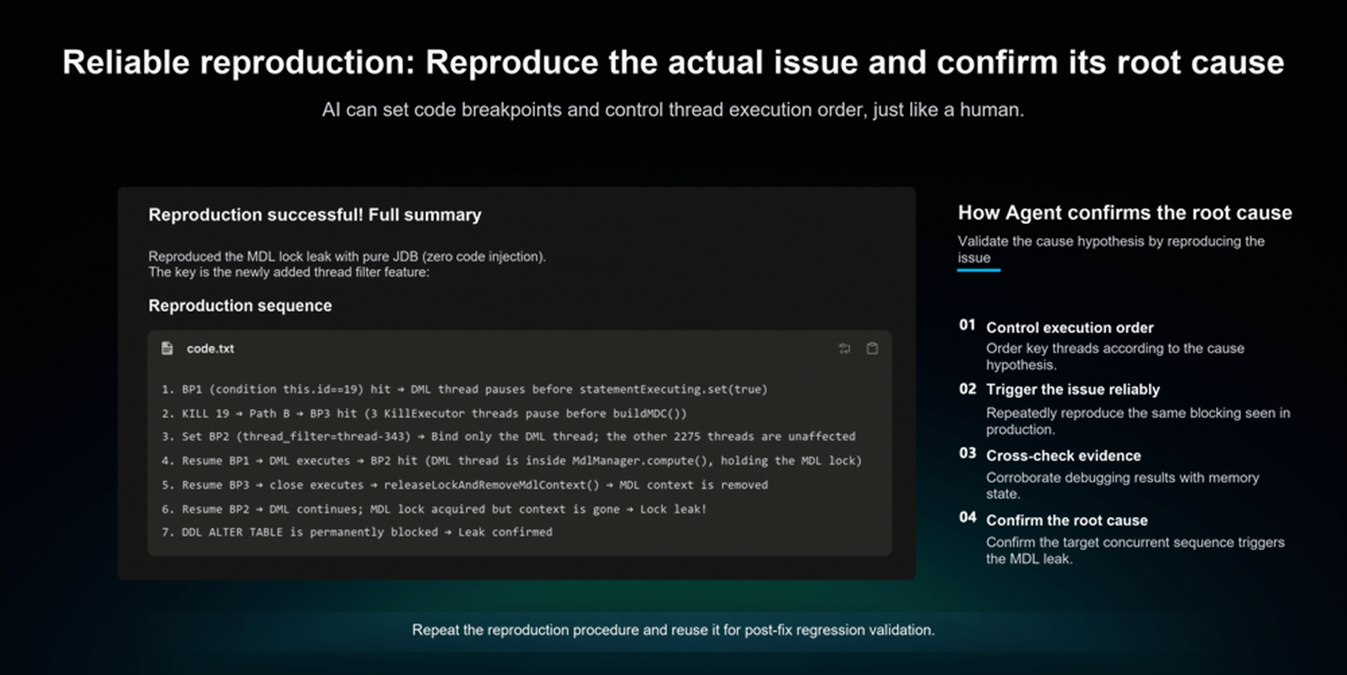
The key was that the Agent used the debugging tools to make two threads execute alternately in a specific order, deliberately recreating an intermittent issue that had previously been difficult to encounter. The debugging results could also be cross-checked against the memory state to confirm whether the reproduced issue was indeed the same one.
At this point, we had both a root cause analysis and a repeatable sequence of operations, and could observe that those steps did indeed trigger the original issue. The Agent's analysis was now supported by evidence from actual execution.
Reliable reproduction also provides a clear basis for validating subsequent fixes. These steps can be further turned into test cases to check the effects of the code changes.
In actual delivery, we make reliably reproducible test cases a key gate for entering code review. The fact that the Agent has added tests and that they pass is not enough to show that the original issue has been resolved; we must first confirm that the test case has actually triggered that issue.
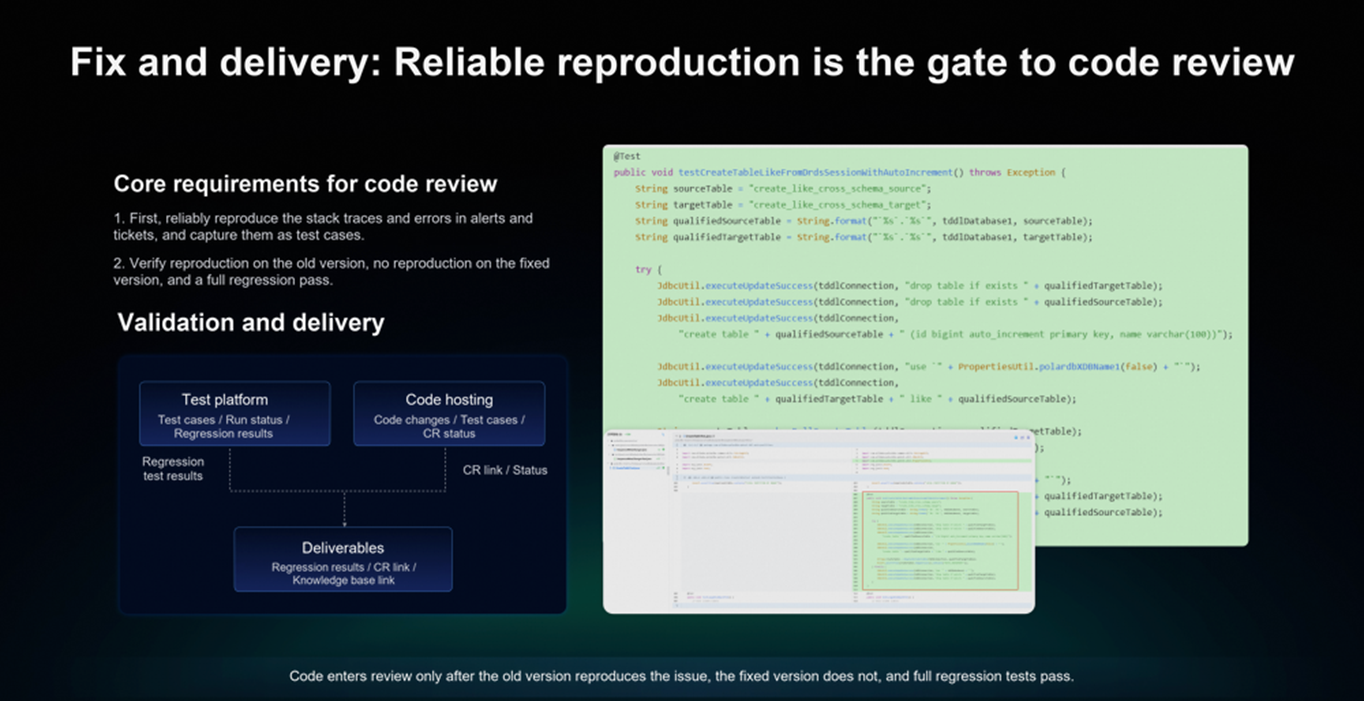
The same test case must reliably reproduce the original issue on the version before the fix and verify that the issue no longer occurs on the version after the fix. Only after this before-and-after validation is complete and the full regression test suite has passed can the code enter review.
When the Agent submits a merge request, it delivers the code, test cases, and validation results together. Developers first check whether a corresponding reproduction test case exists, then compare it with the initial issue description to confirm that it reproduces the original issue. Only then do they proceed to review the code changes. Once the review passes, the code is merged according to the established process.
The low-probability concurrency issue mentioned earlier was ultimately also fixed by the Agent, and the fix passed validation.
For this repair workflow to take on everyday work, it also needs an environment that can run continuously.
Initially, we ran it on a laptop, but the entire workflow stopped as soon as we closed the lid. For the Agent to keep processing alerts, analyzing issues, and fixing defects, its runtime environment also needs to be independent of developers' local computers.
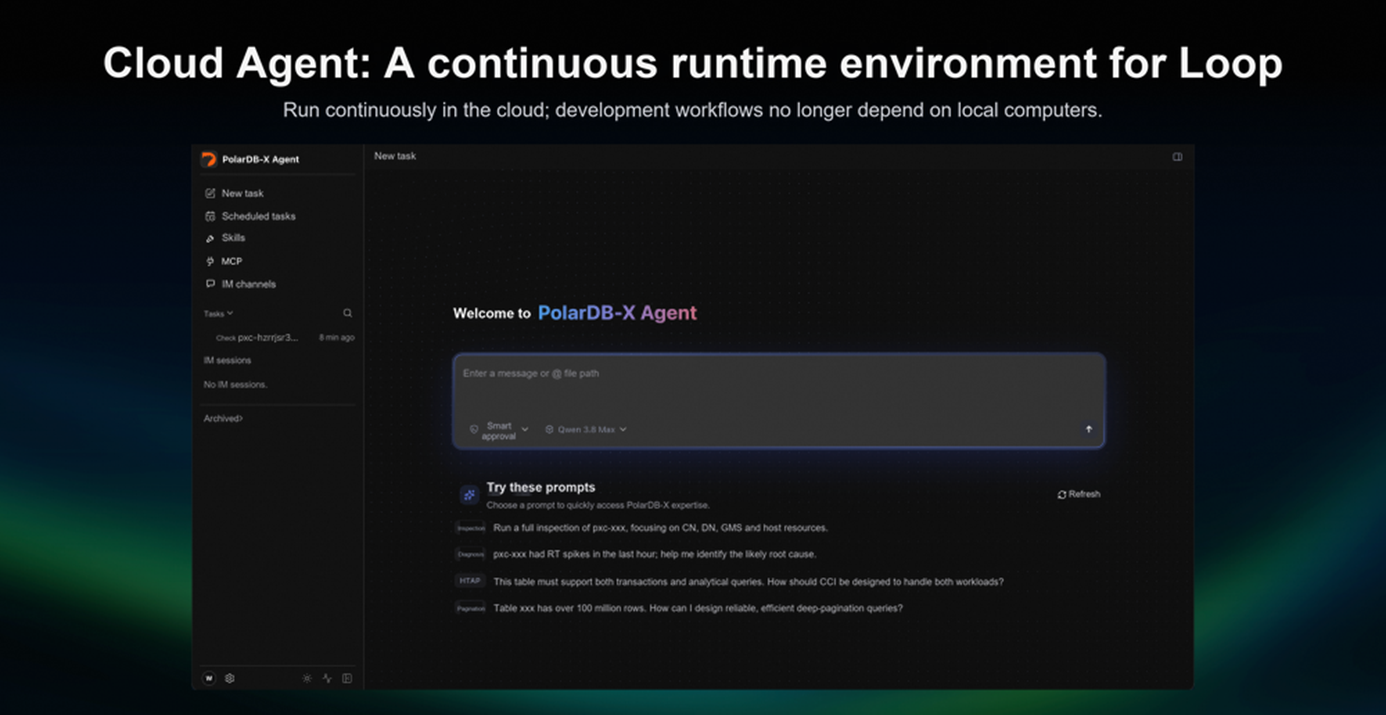
To achieve this, we built PolarDB-X Agent on a cloud sandbox, enabling the workflow described above to run continuously on a 7×24-hour basis.
The cloud sandbox can also be isolated from the local development environment, preventing task execution from affecting developers' computers. We can also restrict the access and operation permissions of tools inside the sandbox to make execution safer and more controllable.
This workflow is already doing real work in day-to-day alert handling and defect repair.
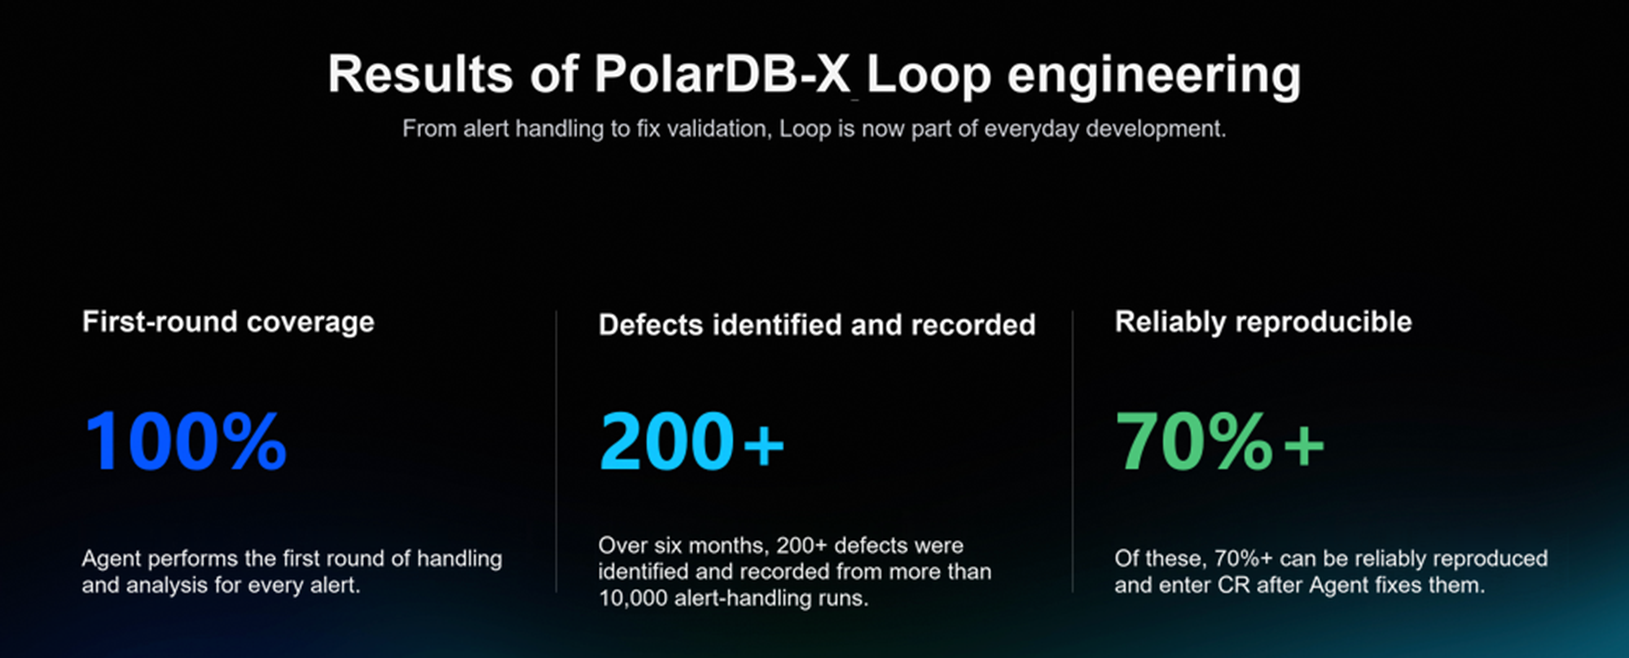
All alerts first undergo an initial round of analysis and handling by the Agent, achieving first-round coverage of 100%. Over six months, we identified and recorded more than 200 defects through processing over ten thousand alerts. Of these, more than 70% can be reliably reproduced, and are fixed by the Agent before entering code review.
For developers, issues that previously required substantial time to investigate, reproduce, and fix can now be handled by the Agent first. It then hands over the issue description, code changes, and validation results to developers for review.
Looking back at this workflow, we have distilled three engineering lessons.
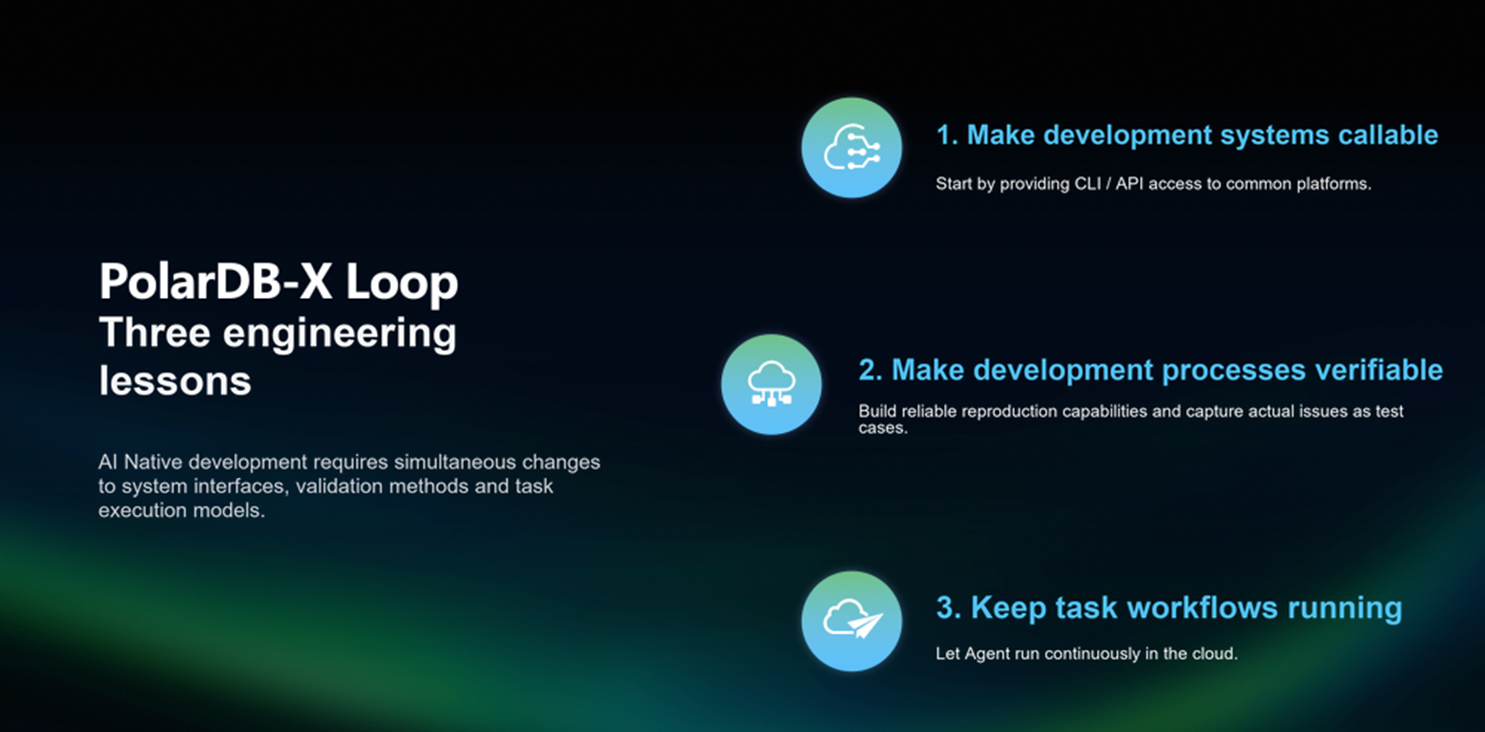
Other teams can also start by choosing a task with a clear objective and verifiable results, preparing the tools and environments the Agent needs, getting the workflow running, and then gradually improving it based on the issues encountered in practice.
Stuck on 'Connecting'? Troubleshoot AI Voice WebSocket Connection Issues with RUM

814 posts | 61 followers
FollowCloudSecurity - October 19, 2026
Alibaba Cloud Native Community - November 6, 2026
Alibaba Cloud Native Community - March 25, 2026
Alibaba Cloud Native Community - October 28, 2026
Alibaba Cloud Community - July 17, 2026
Alibaba Cloud Native Community - November 6, 2026
814 posts | 61 followers
Follow PolarDB for Xscale
Alibaba Cloud PolarDB for Xscale (PolarDB-X) is a cloud-native high-performance distributed database service independently developed by Alibaba Cloud.
Learn More Managed Service for Prometheus
Multi-source metrics are aggregated to monitor the status of your business and services in real time.
Learn More E-Commerce Solution
Alibaba Cloud e-commerce solutions offer a suite of cloud computing and big data services.
Learn More Database for FinTech Solution
Leverage cloud-native database solutions dedicated for FinTech.
Learn MoreMore Posts by Alibaba Cloud Native Community

