By Anish Nath, Alibaba Cloud Tech Share Author. Tech Share is Alibaba Cloud's incentive program to encourage the sharing of technical knowledge and best practices within the cloud community.
Alibaba Cloud Container Service for Kubernetes is a fully-managed service compatible with Kubernetes to help users focus on their applications rather than managing container infrastructure. There are two ways to deploy Kubernetes on Alibaba Cloud, one through Container Service (built-in) and another through an Elastic Compute Service (ECS) instance (self-built). If you are not sure which installation method suits your needs better, then refer to the documentation Alibaba Cloud Kubernetes vs. self-built Kubernetes.
In case you are new to Alibaba Cloud, you can get $10 worth in credit through my referral link to get started on an ECS instance.
In this article, we will cover the following topics:
You only need to have running Kubernetes cluster with deployed Prometheus. Prometheus will use metrics provided by cAdvisor via kubelet service (runs on each node of Kubernetes cluster by default) and via kube-apiserver service only.
Make sure your k8 cluster is up and running
root@kube-master:# kubectl cluster-info
Kubernetes master is running at https://172.16.2.13:6443
KubeDNS is running at https://172.16.2.13:6443/api/v1/namespaces/kube-system/services/kube-dns:dns/proxy
Make sure your nodes is up and running
root@kube-master:# kubectl get nodes
NAME  STATUS  ROLES AGE VERSION
kube-master Ready master  1m  v1.11.2
kube-minion Ready <none> 42s v1.11.2There are two ways to monitor K8s cluster service
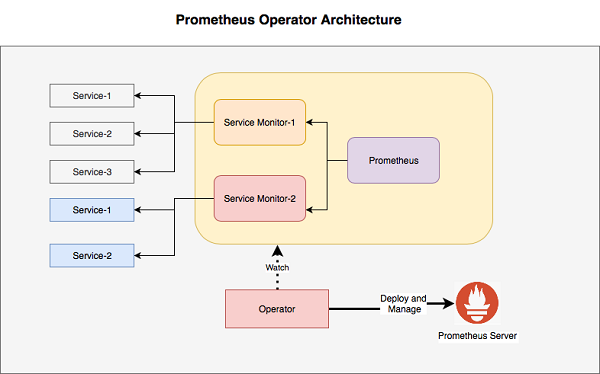
The Prometheus Operator provides monitoring for k8s services and deployments besides managing the below components.
Operators were introduced by CoreOS as a class of software that operates other software, putting operational knowledge collected by humans into software. The below high reference diagram shows, various service monitor can be created to check various K8 service, the operator lookup to these monitor and reports to Prometheus server
This step uses helm the kubernetes package manager. If you not setup the helm then do the below the configuration, otherwise move to next step.
root@kube-master:# helm init
root@kube-master:# kubectl create serviceaccount --namespace kube-system tiller
root@kube-master:# kubectl create clusterrolebinding tiller-cluster-rule \
   --clusterrole=cluster-admin --serviceaccount=kube-system:tiller
root@kube-master:# kubectl patch deploy --namespace kube-system tiller-deploy \
   -p '{"spec":{"template":{"spec":{"serviceAccount":"tiller"}}}}'
root@kube-master:# kubectl --namespace monitoring get pods -l "release=prometheus-operator
root@kube-master:# kubectl port-forward -n monitoring prometheus-prometheus-operator-prometheus-0 9090
Once the helm is ready and related titler pods is up and running , use the Prometheus chard from the helm repository
helm install stable/prometheus-operator --name prometheus-operator --namespace monitoringLookup all the required pods are up and running
root@kube-master:# kubectl --namespace monitoring get pods -l "release=prometheus-operator"
NAME                                                     READY     STATUS    RESTARTS   AGE
prometheus-operator-grafana-7654f69d89-ztwsk             2/3       Running   0          1m
prometheus-operator-kube-state-metrics-cdf84dd85-229c7   1/1       Running   0          1m
prometheus-operator-operator-66cf889d9f-ngdfq            1/1       Running   0          1m
prometheus-operator-prometheus-node-exporter-68mx2       1/1       Running   0          1m
prometheus-operator-prometheus-node-exporter-x2l68 1/1 Running 0 1mTo install kube-prometheus, first clone all the required repositories.
root@kube-master:# git clone https://github.com/coreos/prometheus-operator.git
root@kube-master:# git clone https://github.com/mateobur/prometheus-monitoring-guide.git
Apply the default Prometheus manifest
root@kube-master:# kubectl create -f prometheus-operator/contrib/kube-prometheus/manifests/
namespace/monitoring created
customresourcedefinition.apiextensions.k8s.io/alertmanagers.monitoring.coreos.com created
customresourcedefinition.apiextensions.k8s.io/prometheuses.monitoring.coreos.com created
customresourcedefinition.apiextensions.k8s.io/prometheusrules.monitoring.coreos.com created
customresourcedefinition.apiextensions.k8s.io/servicemonitors.monitoring.coreos.com created
clusterrole.rbac.authorization.k8s.io/prometheus-operator created
clusterrolebinding.rbac.authorization.k8s.io/prometheus-operator created
deployment.apps/prometheus-operator created
service/prometheus-operator created
serviceaccount/prometheus-operator created
servicemonitor.monitoring.coreos.com/prometheus-operator created
alertmanager.monitoring.coreos.com/main created
secret/alertmanager-main created
service/alertmanager-main created
serviceaccount/alertmanager-main created
servicemonitor.monitoring.coreos.com/alertmanager created
secret/grafana-datasources created
configmap/grafana-dashboard-k8s-cluster-rsrc-use created
configmap/grafana-dashboard-k8s-node-rsrc-use created
configmap/grafana-dashboard-k8s-resources-cluster created
configmap/grafana-dashboard-k8s-resources-namespace created
configmap/grafana-dashboard-k8s-resources-pod created
configmap/grafana-dashboard-nodes created
configmap/grafana-dashboard-pods created
configmap/grafana-dashboard-statefulset created
configmap/grafana-dashboards created
deployment.apps/grafana created
service/grafana created
serviceaccount/grafana created
clusterrole.rbac.authorization.k8s.io/kube-state-metrics created
clusterrolebinding.rbac.authorization.k8s.io/kube-state-metrics created
deployment.apps/kube-state-metrics created
role.rbac.authorization.k8s.io/kube-state-metrics created
rolebinding.rbac.authorization.k8s.io/kube-state-metrics created
service/kube-state-metrics created
serviceaccount/kube-state-metrics created
servicemonitor.monitoring.coreos.com/kube-state-metrics created
clusterrole.rbac.authorization.k8s.io/node-exporter created
clusterrolebinding.rbac.authorization.k8s.io/node-exporter created
daemonset.apps/node-exporter created
service/node-exporter created
serviceaccount/node-exporter created
servicemonitor.monitoring.coreos.com/node-exporter created
apiservice.apiregistration.k8s.io/v1beta1.metrics.k8s.io created
clusterrole.rbac.authorization.k8s.io/prometheus-adapter created
clusterrolebinding.rbac.authorization.k8s.io/prometheus-adapter created
clusterrolebinding.rbac.authorization.k8s.io/resource-metrics:system:auth-delegator created
clusterrole.rbac.authorization.k8s.io/resource-metrics-server-resources created
configmap/adapter-config created
deployment.apps/prometheus-adapter created
rolebinding.rbac.authorization.k8s.io/resource-metrics-auth-reader created
service/prometheus-adapter created
serviceaccount/prometheus-adapter created
clusterrole.rbac.authorization.k8s.io/prometheus-k8s created
clusterrolebinding.rbac.authorization.k8s.io/prometheus-k8s created
prometheus.monitoring.coreos.com/k8s created
rolebinding.rbac.authorization.k8s.io/prometheus-k8s-config created
rolebinding.rbac.authorization.k8s.io/prometheus-k8s created
rolebinding.rbac.authorization.k8s.io/prometheus-k8s created
rolebinding.rbac.authorization.k8s.io/prometheus-k8s created
role.rbac.authorization.k8s.io/prometheus-k8s-config created
role.rbac.authorization.k8s.io/prometheus-k8s created
role.rbac.authorization.k8s.io/prometheus-k8s created
role.rbac.authorization.k8s.io/prometheus-k8s created
prometheusrule.monitoring.coreos.com/prometheus-k8s-rules created
service/prometheus-k8s created
serviceaccount/prometheus-k8s created
servicemonitor.monitoring.coreos.com/prometheus created
servicemonitor.monitoring.coreos.com/kube-apiserver created
servicemonitor.monitoring.coreos.com/coredns created
servicemonitor.monitoring.coreos.com/kube-controller-manager created
servicemonitor.monitoring.coreos.com/kube-scheduler created
servicemonitor.monitoring.coreos.com/kubelet created
The default stack deploys the components like :
root@kube-master:# kubectl get pods -n monitoring
NAME                                   READY     STATUS    RESTARTS   AGE
alertmanager-main-0                    2/2       Running   0          1m
alertmanager-main-1                    2/2       Running   0          1m
alertmanager-main-2                    2/2       Running   0          40s
grafana-7b9578fb4-dqskm                1/1       Running   0          2m
kube-state-metrics-7f4478ff68-zdbgk    4/4       Running   0          47s
node-exporter-4p5nm                    2/2       Running   0          2m
node-exporter-6dxt9                    2/2       Running   0          2m
prometheus-adapter-69bd74fc7-m4jl5     1/1       Running   0          2m
prometheus-k8s-0                       3/3       Running   1          1m
prometheus-k8s-1                       3/3       Running   1          48s
prometheus-operator-6db8dbb7dd-s2tbz   1/1       Running   0          2m
We have defined the following configurations:
Note: The default configuration is not production ready, the TLS setting needs to applied and to re-work on which API needs to be exposed.
Grafana dashboard has a datasource ready to query on Prometheus
root@kube-master:# kubectl port-forward grafana-7b9578fb4-dqskm -n monitoring 3000:3000
Forwarding from 127.0.0.1:3000 -> 3000
Forwarding from [::1]:3000 -> 3000
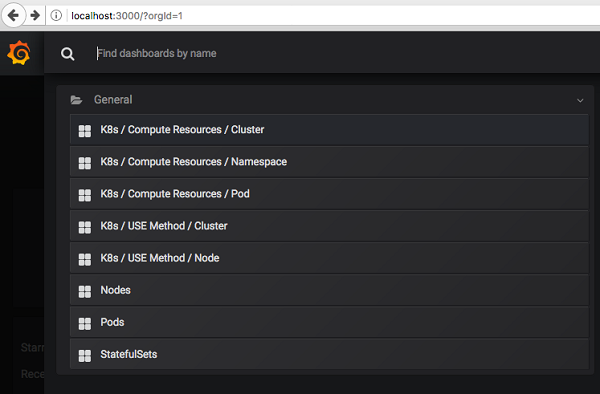
Open web browser to http://localhost:300 , you will access the Grafana interface, which is already populated with some useful dashboards related to kubernetes (k8)
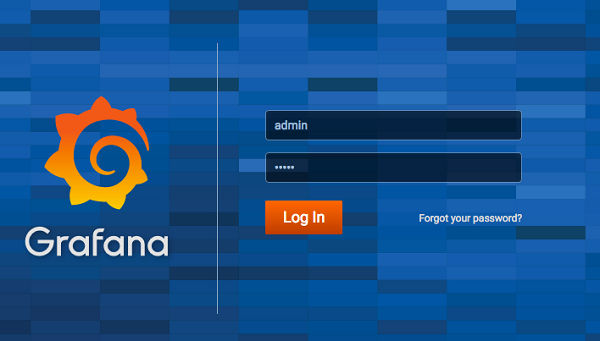
By default, Grafana will be listening on http://localhost:3000. The default login is "admin" / "admin".
Grafana Login
The Grafana interface already populated with some useful dashboards.
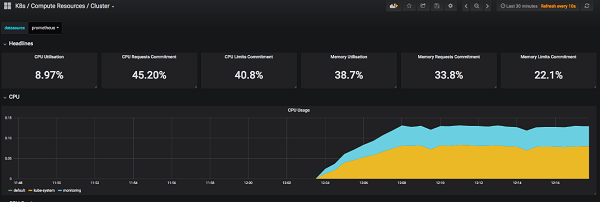
The K8s / Compute Resources / Cluster Dashboard.
The K8s / Compute Resources / Namespaces Dashboard
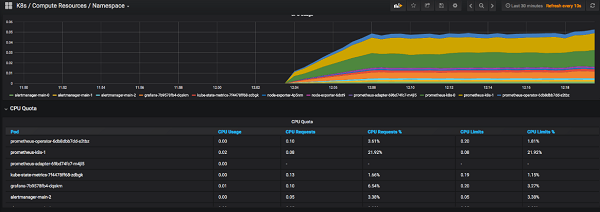
The K8s / Compute Resources / Pods Dashboard

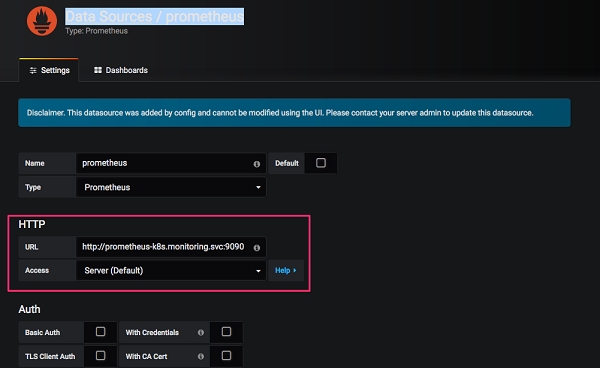
Data Sources / Prometheus: Service lookup is achieved through kube-dns lookup URL http://prometheus-k8s.monitoring.svc:9090
Create the service pods which will expose the endpoint address
root@kube-master:# kubectl create -f prometheus-monitoring-guide/operator/service-prometheus.yaml
prometheus.monitoring.coreos.com/service-prometheus created
Wait for the prometheus-service-prometheus-0 to be up and running
root@kube-master:# kubectl get pods -n monitoring
NAME                                   READY     STATUS    RESTARTS   AGE
alertmanager-main-0                    2/2       Running   0          2h
alertmanager-main-1                    2/2       Running   0          2h
alertmanager-main-2                    2/2       Running   0          2h
grafana-7b9578fb4-dqskm                1/1       Running   0          2h
kube-state-metrics-7f4478ff68-zdbgk    4/4       Running   0          2h
node-exporter-4p5nm                    2/2       Running   0          2h
node-exporter-6dxt9                    2/2       Running   0          2h
prometheus-adapter-69bd74fc7-m4jl5     1/1       Running   0          2h
prometheus-k8s-0                       3/3       Running   1          2h
prometheus-k8s-1                       3/3       Running   1          2h
prometheus-operator-6db8dbb7dd-s2tbz   1/1       Running   0          2h
prometheus-service-prometheus-0        3/3       Running   1          21s
Then Enable port forward configuration to access Prometheus server UI
root@kube-master:# kubectl port-forward -n monitoring prometheus-service-prometheus-0   9090
Forwarding from 127.0.0.1:9090 -> 9090
Forwarding from [::1]:9090 -> 9090
Open web browser to http://localhost:9090, you will access the Prometheus interface.
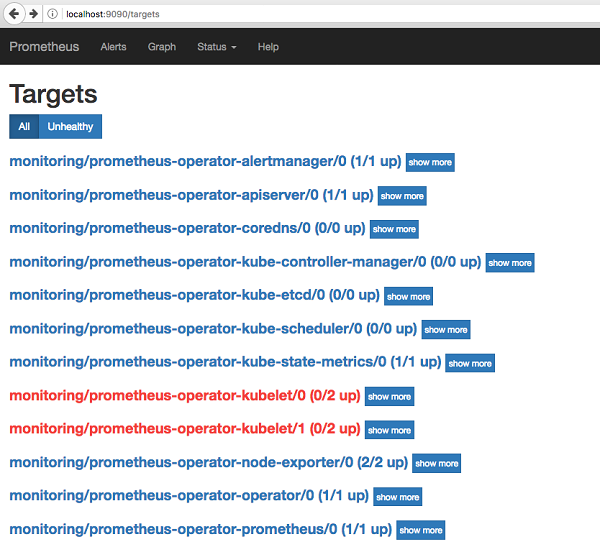
These are the standard ports which will be helpful while dealing with Prometheus server and its associated service.
Until now, we have worked out with the example of monitoring the K8 cluster with prometheus-operator, what about the application which is loaded externally, well for that we have ServiceMonitor Lookups but before jumping to it, let's revisit
For example the below YAML configuration will select and monitor the nginx pod using the matchLabels selector. i.e app=nginx
apiVersion: monitoring.coreos.com/v1
kind: ServiceMonitor
metadata:
  name: nginx
spec:
  selector:
    matchLabels:
      app: nginx
  namespaceSelector:
    matchNames:
    - default
  endpoints:
  - port: web
    interval: 30s
serviceMonitorSelector which defines a selection of ServiceMonitors to be used.
Here's another example of using ServiceMonitor. Let's first deploy three instances of a simple example application, which listens and exposes metrics on port 8080
root@kube-master:# kubectl apply -f https://raw.githubusercontent.com/coreos/prometheus-operator/master/contrib/kube-prometheus/examples/example-app/example-app.yaml
example-app.yaml
service/example-app created
deployment.extensions/example-app created
root@kube-master:# kubectl get pods
NAME                                READY     STATUS    RESTARTS   AGE
example-app-5d644dbfc6-4t4gn        1/1       Running   0          33s
example-app-5d644dbfc6-dsxzq        1/1       Running   0          33s
example-app-5d644dbfc6-sb8xd        1/1       Running   0          33s
example-app-5d644dbfc6-v7l89        1/1       Running   0          33s
This serviceobject is discovered and monitor by a ServiceMonitor where app=example-app
apiVersion: monitoring.coreos.com/v1
kind: ServiceMonitor
metadata:
  name: example-app
  labels:
    team: frontend
spec:
  selector:
    matchLabels:
      app: example-app
  endpoints:
  - port: web
root@kube-master:/home/ansible# kubectl create -f  example-app.yaml
servicemonitor.monitoring.coreos.com/example-app createdThat's it! It is fairly easy to deploy Prometheus Operator and now I hope it's easy to monitor all your services even if they are exist outside from your Kubernetes cluster. While running up this exercise, you might end-up with troubleshooting, as this is the beauty of kubernetes, In order to debug it correctly, you must have a good understanding of kubernetes deployment and related k8 services then proceed with Prometheus setup. There are many other thing Prometheus offer like third party integration and it's not an event logging system, and attempting to use it that way will result in low performance and other issues.

2,593 posts | 793 followers
FollowAlibaba Container Service - February 13, 2019
DavidZhang - December 30, 2020
Alibaba Cloud Native - November 6, 2024
Alibaba Container Service - December 6, 2019
feuyeux - July 6, 2021
Alibaba Container Service - August 10, 2023

2,593 posts | 793 followers
Follow Container Service for Kubernetes
Alibaba Cloud Container Service for Kubernetes is a fully managed cloud container management service that supports native Kubernetes and integrates with other Alibaba Cloud products.
Learn More ECS(Elastic Compute Service)
Elastic and secure virtual cloud servers to cater all your cloud hosting needs.
Learn More Container Registry
A secure image hosting platform providing containerized image lifecycle management
Learn MoreMore Posts by Alibaba Clouder