By Liusheng
You can use Application Real-Time Monitoring Service (ARMS) Prometheus to manage Kubernetes clusters deployed across regions in a unified manner. This article describes how to enable ARMS Prometheus for a registered Kubernetes cluster by deploying the application in Alibaba Cloud Container Service for Kubernetes (ACK).
You need to a registered Kubernetes cluster through ACK. Please see Create a Registered Cluster and Enable it for a Local Data Center Cluster for more information.
Note: If you connect to a registered cluster over an internal network, skip this step. If you want to connect to a registered cluster over a public network, you must configure an AccessKey pair to access cloud services in the registered cluster before installing components in it.
Run the following command to check whether the cluster is connected over the internal network:
kubectl -n kube-system get deploy ack-cluster-agent -o=jsonpath='{.spec.template.spec.containers[0].env[?(@.name=="INTERNAL_ENDPOINT")].value}'If the output is true, it is an internal network.
If the output is false, it is a public network. You need to use the following methods to configure the AccessKey.
Please visit this article for more information.
After onectl is configured, run the following command to automatically configure and install the arms-prometheus component:
onectl addon install ack-arms-prometheus1. Create a RAM user. Please see Create a RAM User for more information.
2. Create a permission policy. Please see Create a Custom Policy for more information.
The following permissions are required for the arms-prometheus component:
{
    "Version": "1",
    "Statement": [
        {
            "Action": [
                "arms:Describe*",
                "arms:List*",
                "arms:Get*",
                "arms:Search*",
                "arms:Check*",
                "arms:Query*"
            ],
            "Resource": "*",
            "Effect": "Allow"
        }
    ]
}
3. Add permissions to the RAM user. Please see Grant permissions to a RAM user for more information.
4. Create an AccessKey pair for the RAM user. Please see Create an AccessKey Pair for more information.
5. Use the AccessKey pair to create a Secret named alibaba-addon-secret in the registered cluster. Run the following command to create a Secret for the Logtail component:
kubectl -n arms-prom create secret generic alibaba-addon-secret --from-literal='access-key-id=<your AccessKey ID>' --from-literal='access-key-secret=<your AccessKey Secret>'After the installation, you can log on to the Prometheus console. Click the Prometheus instance named after the registered cluster. On the details page of the Prometheus instance, you can view monitoring data and create alert rules. Please see ARMS Prometheus Monitoring and Create a Prometheus Monitoring Alert for more information.
The arms-promethues component collects data from the cadvisor port 10255 by default. If only the kubelet port 10250 is enabled for your cluster, perform the following steps:
1. Deploy and configure ServiceMonitor in the cluster:
apiVersion: monitoring.coreos.com/v1
kind: ServiceMonitor
metadata:
  annotations:
    arms.prometheus.io/discovery: 'true'
  name: arms-prom-cadvisor-10250
  namespace: arms-prom
spec:
  endpoints:
    - bearerTokenFile: /var/run/secrets/kubernetes.io/serviceaccount/token
      honorLabels: true
      port: https-metrics
      relabelings:
        - sourceLabels:
            - __metrics_path__
          targetLabel: metrics_path
      scheme: https
      tlsConfig:
        caFile: /var/run/secrets/kubernetes.io/serviceaccount/ca.crt
        insecureSkipVerify: true
    - bearerTokenFile: /var/run/secrets/kubernetes.io/serviceaccount/token
      honorLabels: true
      path: /metrics/cadvisor
      port: https-metrics
      relabelings:
        - sourceLabels:
            - __metrics_path__
          targetLabel: metrics_path
      scheme: https
      tlsConfig:
        caFile: /var/run/secrets/kubernetes.io/serviceaccount/ca.crt
        insecureSkipVerify: true
    - bearerTokenFile: /var/run/secrets/kubernetes.io/serviceaccount/token
      honorLabels: true
      path: /metrics/probes
      port: https-metrics
      relabelings:
        - sourceLabels:
            - __metrics_path__
          targetLabel: metrics_path
      scheme: https
      tlsConfig:
        caFile: /var/run/secrets/kubernetes.io/serviceaccount/ca.crt
        insecureSkipVerify: true
  jobLabel: k8s-app
  namespaceSelector:
    matchNames:
      - kube-system
  selector:
    matchLabels:
      k8s-app: kubelet
2. Verify data:
Wait for about 15s to 1min. Log on to the ARMS Prometheus console. Go to the Prometheus instance page.
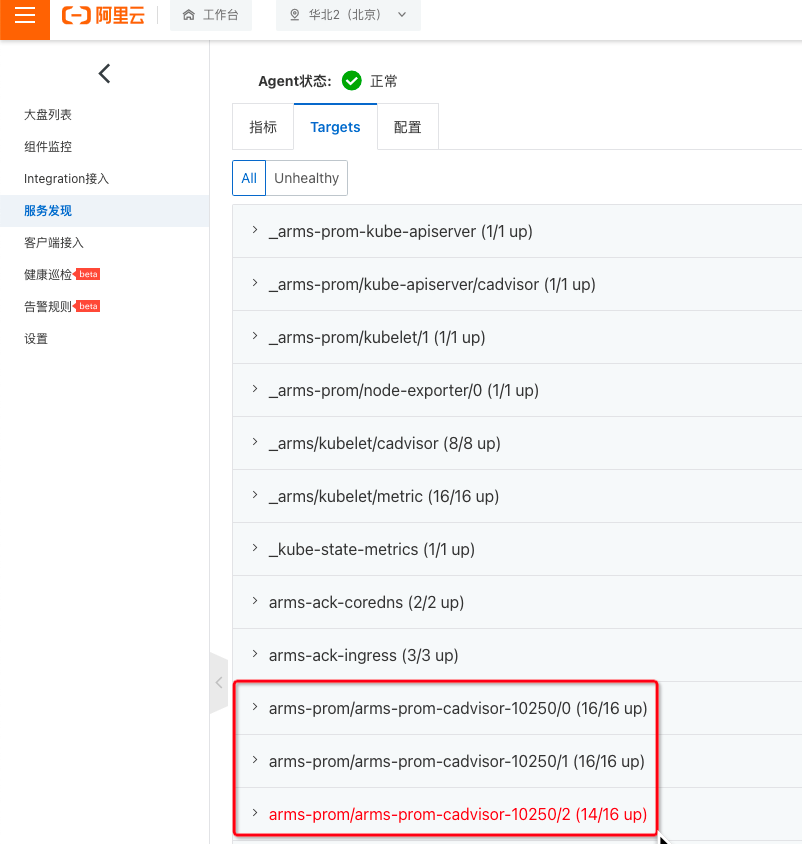
On the left-side Service Discovery > Targets page, check whether the_cadvisor_10250 collection task already exists and whether the collection task status is normal.
Three sets of cadvisor data collection tasks will appear:


229 posts | 34 followers
FollowAlibaba Cloud Native - October 16, 2023
Alibaba Container Service - August 2, 2023
Alibaba Container Service - August 10, 2023
Alibaba Cloud Native - March 6, 2024
feuyeux - July 6, 2021
Alibaba Cloud Native Community - August 30, 2022

229 posts | 34 followers
Follow Container Service for Kubernetes
Alibaba Cloud Container Service for Kubernetes is a fully managed cloud container management service that supports native Kubernetes and integrates with other Alibaba Cloud products.
Learn More Container Compute Service (ACS)
A cloud computing service that provides container compute resources that comply with the container specifications of Kubernetes
Learn More Cloud-Native Applications Management Solution
Accelerate and secure the development, deployment, and management of containerized applications cost-effectively.
Learn More Application Real-Time Monitoring Service
Build business monitoring capabilities with real time response based on frontend monitoring, application monitoring, and custom business monitoring capabilities
Learn MoreMore Posts by Alibaba Container Service