Alibaba Cloud Service Mesh (ASM) provides non-intrusive telemetry data for business containers with its Mixerless Telemetry. On the one hand, telemetry data is collected by ARMPS and Prometheus as a monitoring metric for service mesh observability. On the other hand, it is used by HPA and flaggers as the basis of application-level scaling and progressive canary release.
In terms of the implementation of telemetry data in application-level scaling and progressive canary release, there will be three articles in this series, focusing on telemetry data (monitoring metrics), application-level scaling, and progressive canary release.
The overall architecture of the implementation is shown in the following figure:
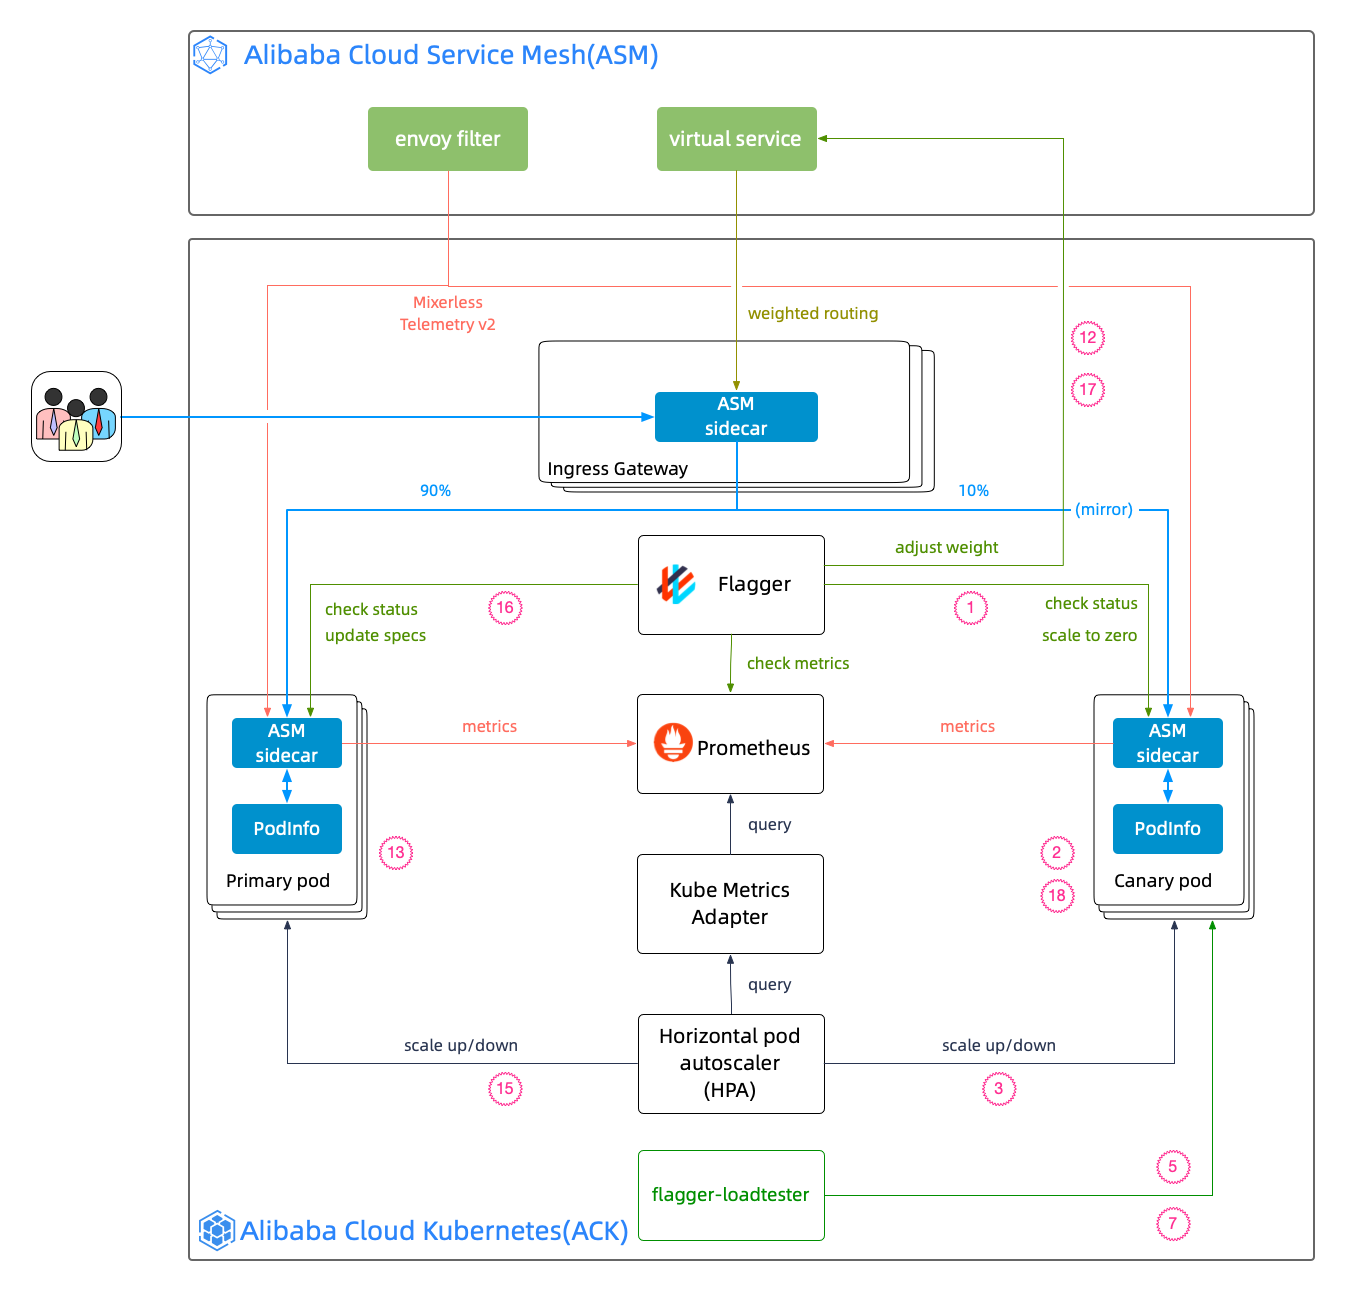
The Flagger official website describes the process of progressive canary release, and the original is listed below:
Flagger will run a canary release with the configuration above using the following steps:
This section describes how to configure and collect application-level monitoring metrics (such as request total istio_requests_total and request latency istio_request_duration) based on ASM. The main steps include creating the EnvoyFilter, verifying envoy telemetry data, and verifying telemetry data collected by Prometheus.
Log onto the ASM console, select Service Mesh > Mesh Management on the left navigation bar, and enter the feature configuration page for an ASM instance.
1 Check Enable Prometheus monitoring metrics collection
2 Click Enable self-built Prometheus and enter the Prometheus service address: prometheus:9090. (The community version Prometheus is used in this series, and the configuration above will be used in later articles.) If you use Alibaba Cloud ARMS, please refer to Integrate ARMS Prometheus to implement mesh monitoring.
3 Check Enable Kiali (optional).
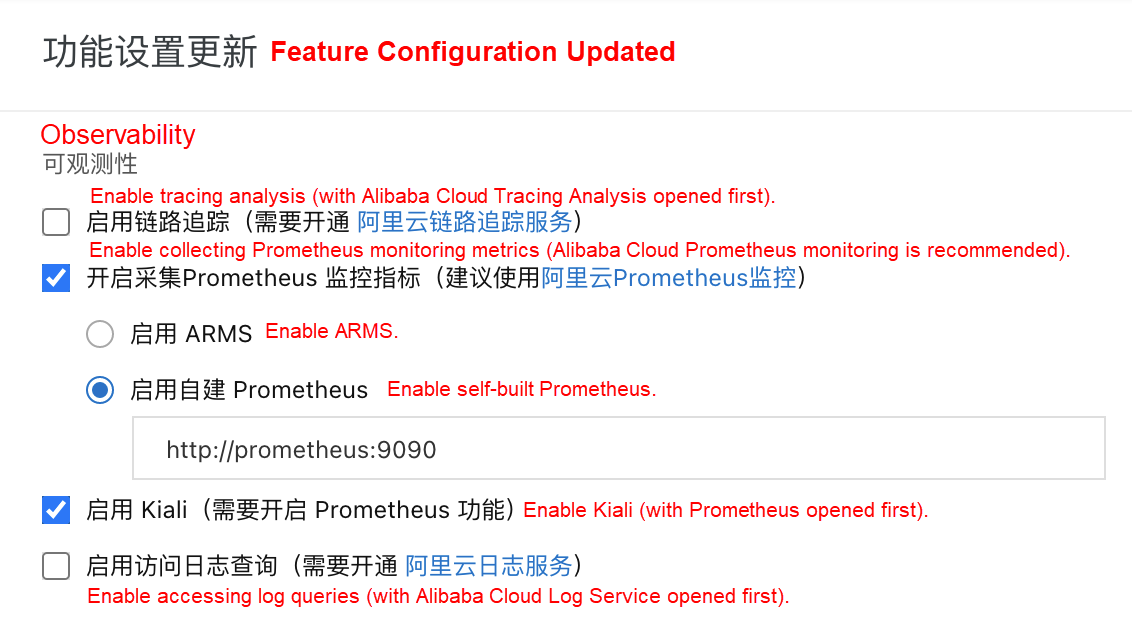
4 Click OK. Then, the related EnvoyFilter list generated by ASM is available in the control plane:

Run the following command to install Prometheus. For the complete script, please see: demo_mixerless.sh.
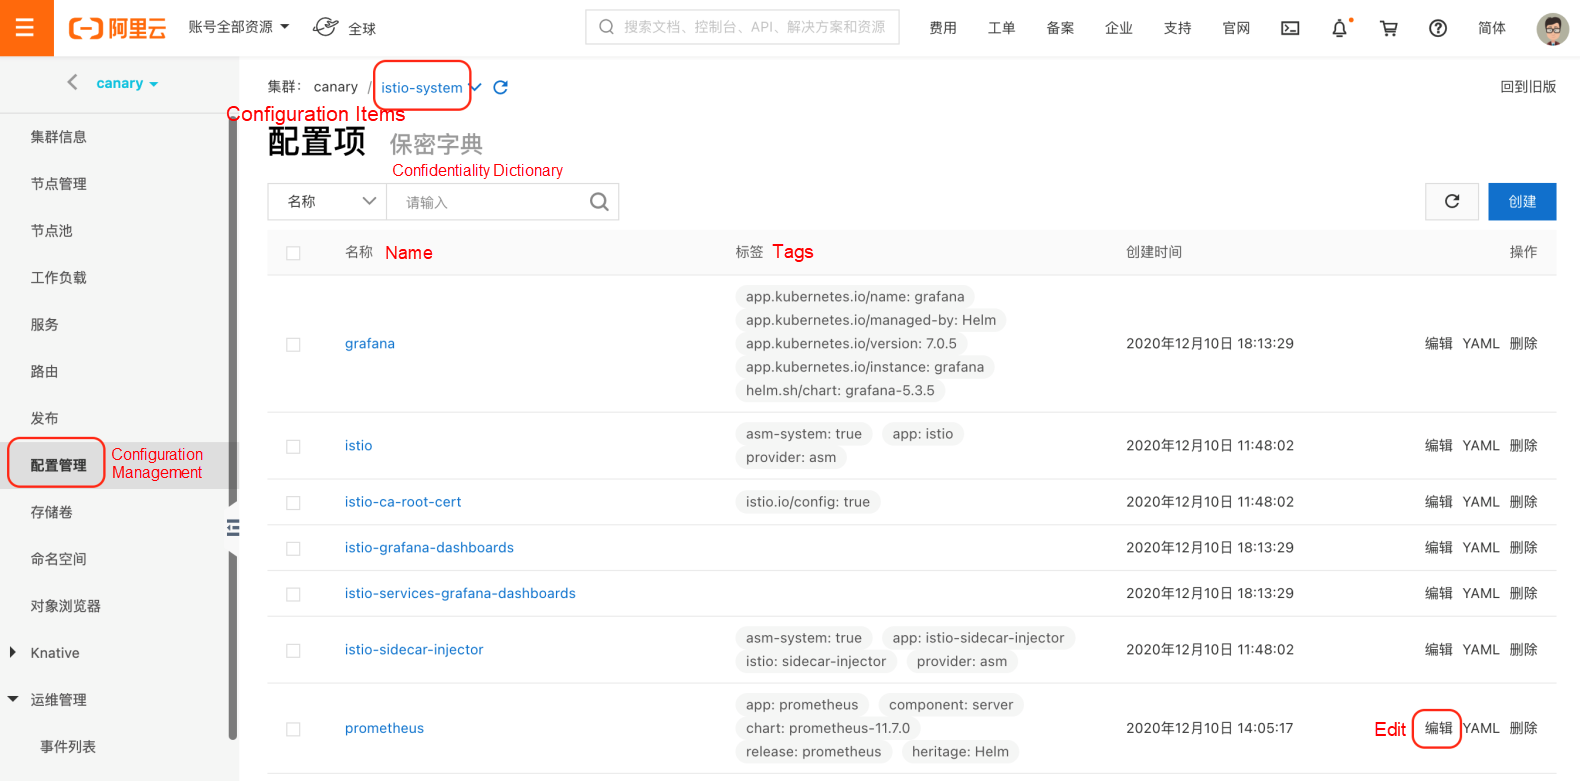
kubectl --kubeconfig "$USER_CONFIG" apply -f $ISTIO_SRC/samples/addons/prometheus.yamlAfter installing Prometheus, add istio-related monitoring metrics to its configuration. Log onto the ACK console, select Configuration Management > Configuration Items on the left navigation bar, find Prometheus under istio-system, and click Edit.
In the prometheus.yaml configuration, add the configuration in scrape_configs.yaml to scrape_configs.
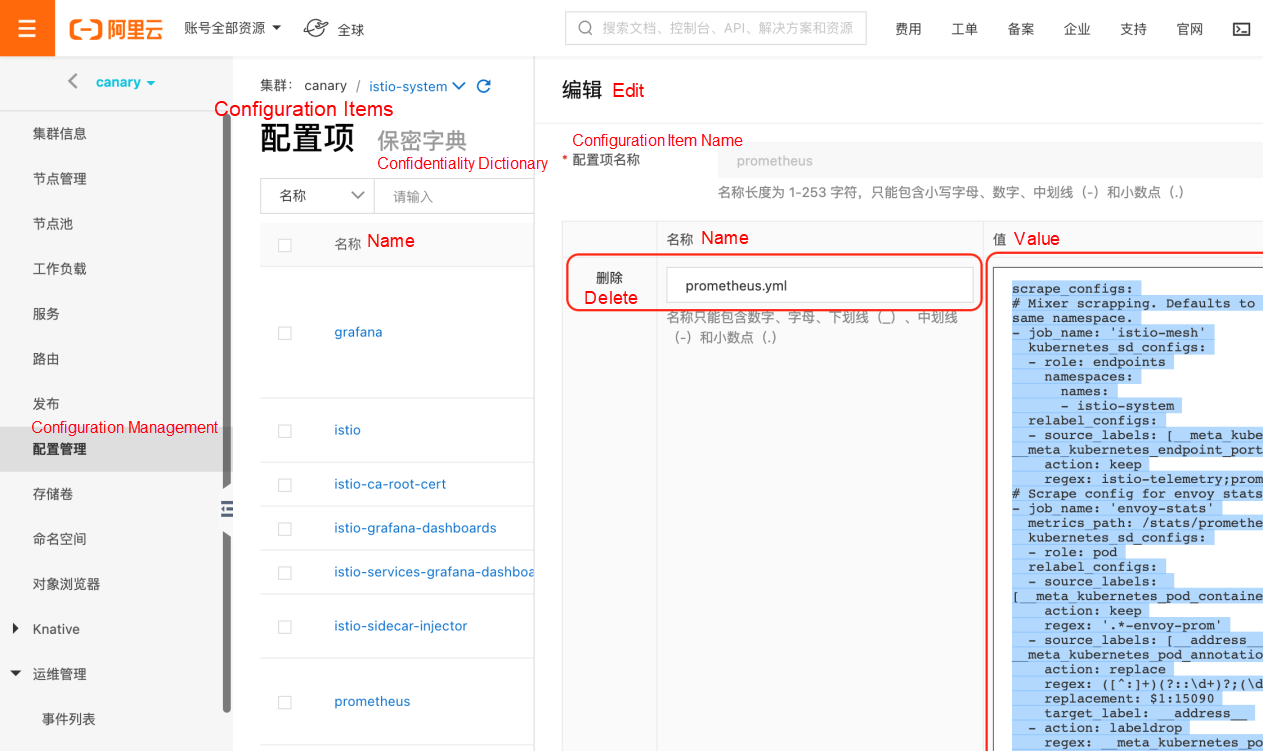
After the configuration is saved, select Workload > Container Group on the left navigation bar, find Prometheus under istio-system, and delete Prometheus POD to ensure that the configuration takes effect in the new POD.
Users can run the following command to view job_name in the Prometheus configuration:
kubectl --kubeconfig "$USER_CONFIG" get cm prometheus -n istio-system -o jsonpath={.data.prometheus\\.yml} | grep job_name
- job_name: 'istio-mesh'
- job_name: 'envoy-stats'
- job_name: 'istio-policy'
- job_name: 'istio-telemetry'
- job_name: 'pilot'
- job_name: 'sidecar-injector'
- job_name: prometheus
  job_name: kubernetes-apiservers
  job_name: kubernetes-nodes
  job_name: kubernetes-nodes-cadvisor
- job_name: kubernetes-service-endpoints
- job_name: kubernetes-service-endpoints-slow
  job_name: prometheus-pushgateway
- job_name: kubernetes-services
- job_name: kubernetes-pods
- job_name: kubernetes-pods-slowRun the following command to deploy the podinfo as an example in this series:
kubectl --kubeconfig "$USER_CONFIG" apply -f $PODINFO_SRC/kustomize/deployment.yaml -n test
kubectl --kubeconfig "$USER_CONFIG" apply -f $PODINFO_SRC/kustomize/service.yaml -n testRun the following command to request the monitoring metrics generated from podinfo:
podinfo_pod=$(k get po -n test -l app=podinfo -o jsonpath={.items..metadata.name})
for i in {1..10}; do
   kubectl --kubeconfig "$USER_CONFIG" exec $podinfo_pod -c podinfod -n test -- curl -s podinfo:9898/version
  echo
doneThe key metrics in this series are istio_requests_total and istio_request_duration, which should be confirmed to have been generated in the envoy container.
istio_requests_total
Run the following command to request stats-related metric data from envoy and confirm that istio_requests_total is included.
kubectl --kubeconfig "$USER_CONFIG" exec $podinfo_pod -n test -c istio-proxy -- curl -s localhost:15090/stats/prometheus | grep istio_requests_totalThe returned results are listed below:
:::: istio_requests_total ::::
# TYPE istio_requests_total counter
istio_requests_total{response_code="200",reporter="destination",source_workload="podinfo",source_workload_namespace="test",source_principal="spiffe://cluster.local/ns/test/sa/default",source_app="podinfo",source_version="unknown",source_cluster="c199d81d4e3104a5d90254b2a210914c8",destination_workload="podinfo",destination_workload_namespace="test",destination_principal="spiffe://cluster.local/ns/test/sa/default",destination_app="podinfo",destination_version="unknown",destination_service="podinfo.test.svc.cluster.local",destination_service_name="podinfo",destination_service_namespace="test",destination_cluster="c199d81d4e3104a5d90254b2a210914c8",request_protocol="http",response_flags="-",grpc_response_status="",connection_security_policy="mutual_tls",source_canonical_service="podinfo",destination_canonical_service="podinfo",source_canonical_revision="latest",destination_canonical_revision="latest"} 10

istio_requests_total{response_code="200",reporter="source",source_workload="podinfo",source_workload_namespace="test",source_principal="spiffe://cluster.local/ns/test/sa/default",source_app="podinfo",source_version="unknown",source_cluster="c199d81d4e3104a5d90254b2a210914c8",destination_workload="podinfo",destination_workload_namespace="test",destination_principal="spiffe://cluster.local/ns/test/sa/default",destination_app="podinfo",destination_version="unknown",destination_service="podinfo.test.svc.cluster.local",destination_service_name="podinfo",destination_service_namespace="test",destination_cluster="c199d81d4e3104a5d90254b2a210914c8",request_protocol="http",response_flags="-",grpc_response_status="",connection_security_policy="unknown",source_canonical_service="podinfo",destination_canonical_service="podinfo",source_canonical_revision="latest",destination_canonical_revision="latest"} 10istio_request_duration
Run the following command to request stats-related metric data from envoy and confirm that istio_request_duration is included.
kubectl --kubeconfig "$USER_CONFIG" exec $podinfo_pod -n test -c istio-proxy -- curl -s localhost:15090/stats/prometheus | grep istio_request_durationThe returned results are listed below:
:::: istio_request_duration ::::
# TYPE istio_request_duration_milliseconds histogram
istio_request_duration_milliseconds_bucket{response_code="200",reporter="destination",source_workload="podinfo",source_workload_namespace="test",source_principal="spiffe://cluster.local/ns/test/sa/default",source_app="podinfo",source_version="unknown",source_cluster="c199d81d4e3104a5d90254b2a210914c8",destination_workload="podinfo",destination_workload_namespace="test",destination_principal="spiffe://cluster.local/ns/test/sa/default",destination_app="podinfo",destination_version="unknown",destination_service="podinfo.test.svc.cluster.local",destination_service_name="podinfo",destination_service_namespace="test",destination_cluster="c199d81d4e3104a5d90254b2a210914c8",request_protocol="http",response_flags="-",grpc_response_status="",connection_security_policy="mutual_tls",source_canonical_service="podinfo",destination_canonical_service="podinfo",source_canonical_revision="latest",destination_canonical_revision="latest",le="0.5"} 10

istio_request_duration_milliseconds_bucket{response_code="200",reporter="destination",source_workload="podinfo",source_workload_namespace="test",source_principal="spiffe://cluster.local/ns/test/sa/default",source_app="podinfo",source_version="unknown",source_cluster="c199d81d4e3104a5d90254b2a210914c8",destination_workload="podinfo",destination_workload_namespace="test",destination_principal="spiffe://cluster.local/ns/test/sa/default",destination_app="podinfo",destination_version="unknown",destination_service="podinfo.test.svc.cluster.local",destination_service_name="podinfo",destination_service_namespace="test",destination_cluster="c199d81d4e3104a5d90254b2a210914c8",request_protocol="http",response_flags="-",grpc_response_status="",connection_security_policy="mutual_tls",source_canonical_service="podinfo",destination_canonical_service="podinfo",source_canonical_revision="latest",destination_canonical_revision="latest",le="1"} 10
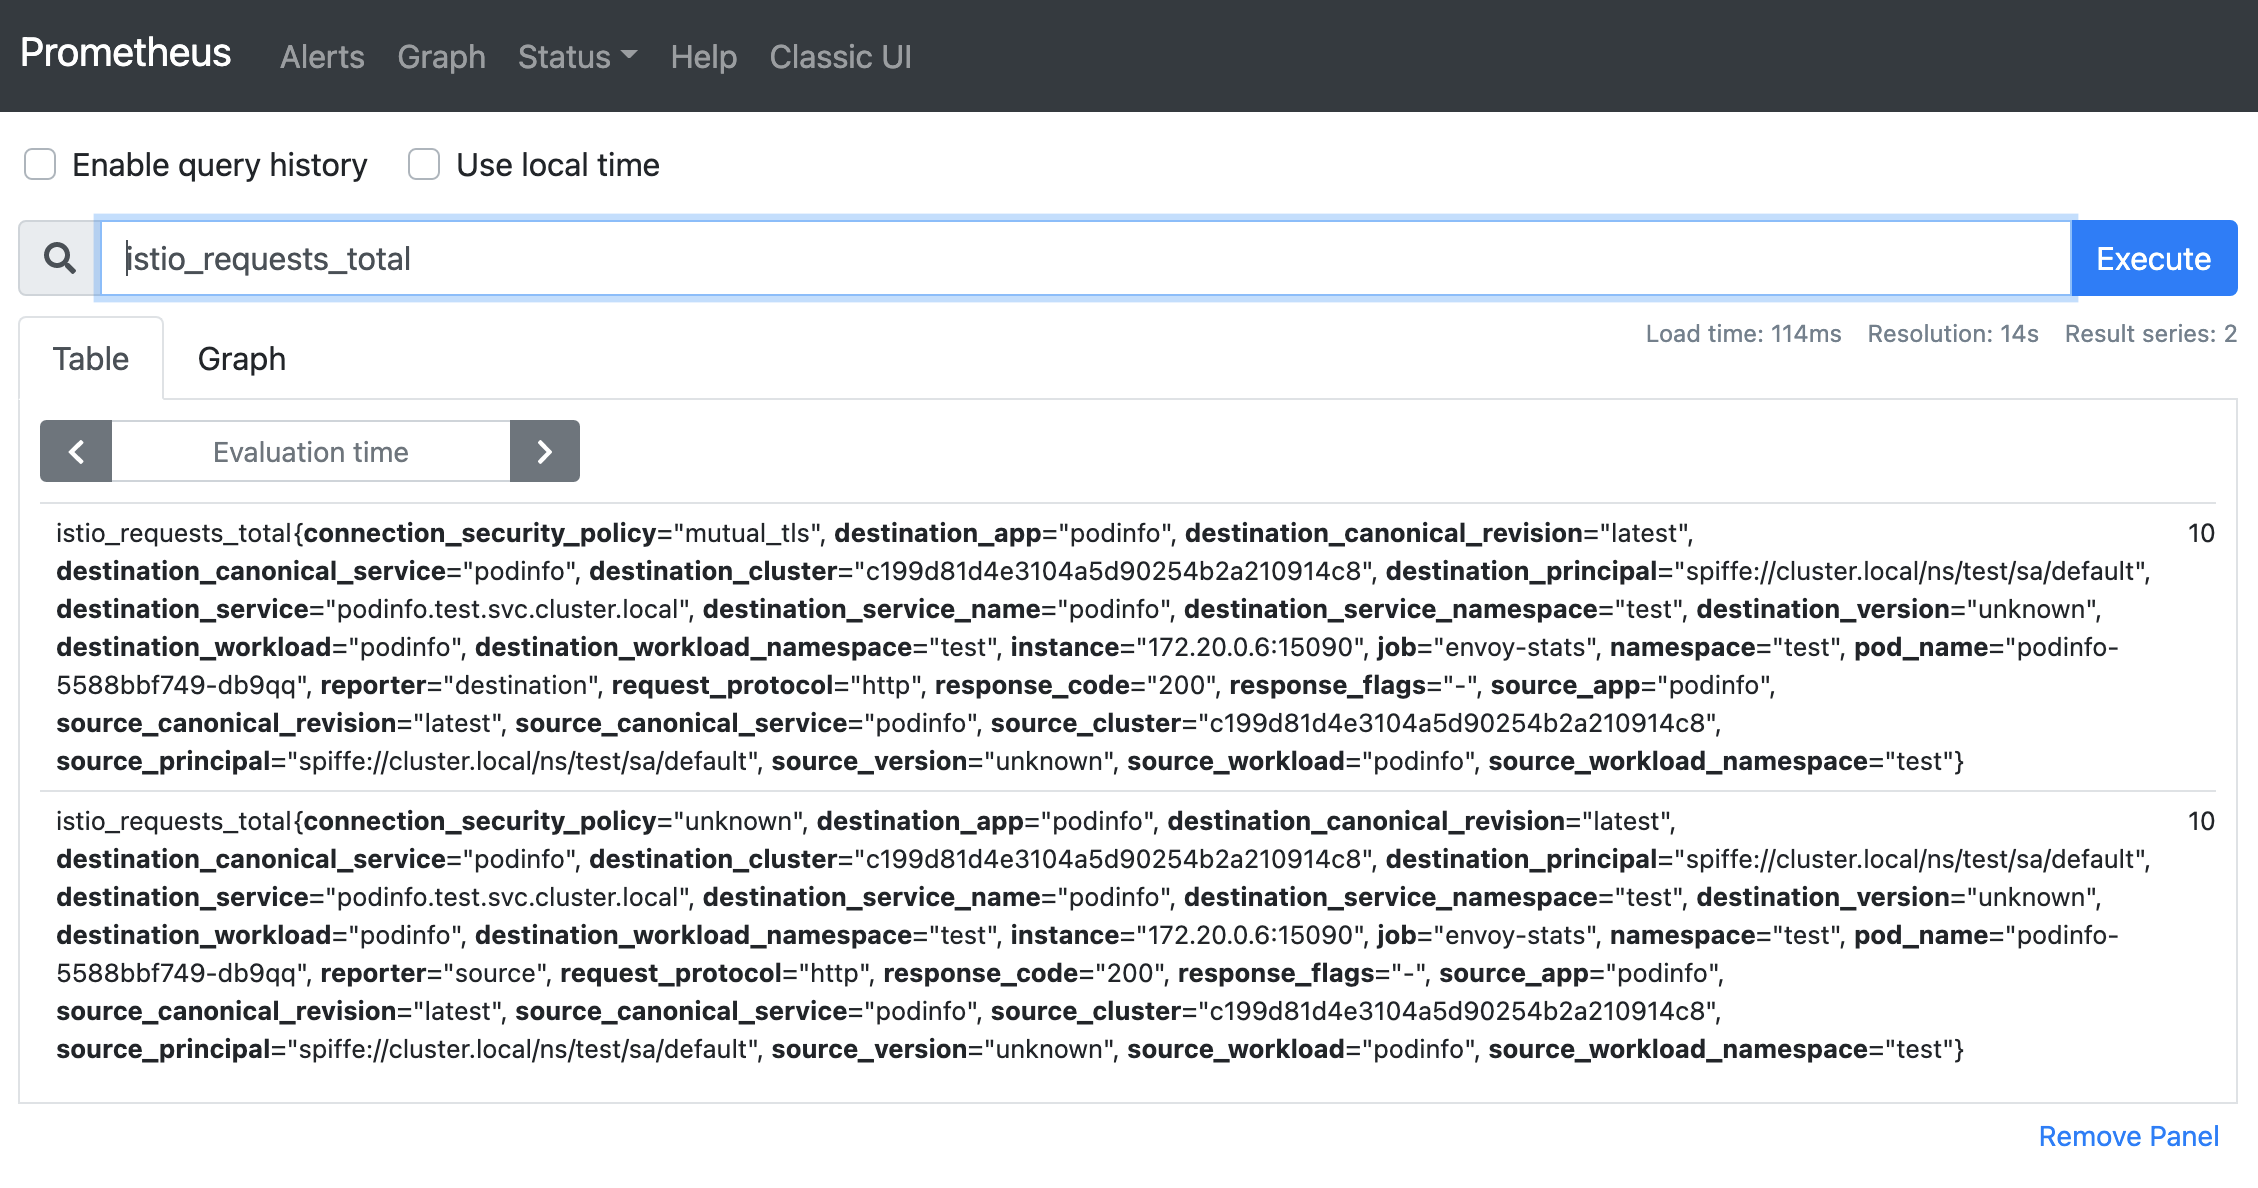
...The final step is to check whether the metric data generated by Envoy is collected by Prometheus in real-time. Expose the Prometheus service externally and use a browser to request the service. Enter istio_requests_total in the query box, and the results are listed below:
Request gRPC Services in the Mesh by HTTP through ASM Ingress Gateway
feuyeux - July 6, 2021
feuyeux - July 6, 2021
Alibaba Cloud Native - November 3, 2022
Alibaba Container Service - October 12, 2024
Xi Ning Wang(王夕宁) - July 21, 2023
Alibaba Cloud Native Community - September 20, 2022
 Managed Service for Prometheus
Multi-source metrics are aggregated to monitor the status of your business and services in real time.
Learn More Cloud-Native Applications Management Solution
Accelerate and secure the development, deployment, and management of containerized applications cost-effectively.
Learn More Container Service for Kubernetes
Alibaba Cloud Container Service for Kubernetes is a fully managed cloud container management service that supports native Kubernetes and integrates with other Alibaba Cloud products.
Learn More ACK One
Provides a control plane to allow users to manage Kubernetes clusters that run based on different infrastructure resources
Learn MoreMore Posts by feuyeux