Whenever you are training artificial intelligence (AI) models using an Alibaba Cloud Container Service for Kubernetes cluster constructed based on GPU ECS hosts, you need to know the GPU status of each pod. For example, you may need to know the video memory usage, GPU usage, and GPU temperature to ensure the stability of services. This document describes how to rapidly construct a GPU monitoring solution based on Prometheus and Grafana on Alibaba Cloud.
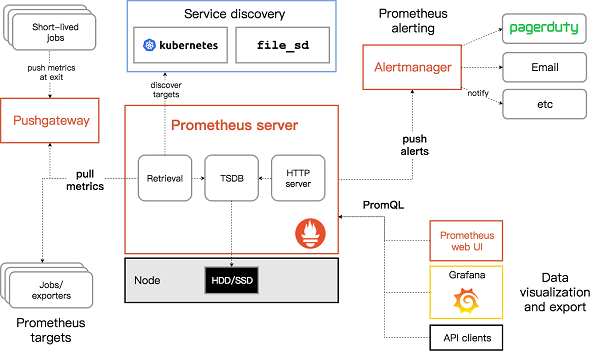
Prometheus is an open-source service monitoring system and a time series database. Since its inception in 2012 and open source placement on GitHub in 2015, Prometheus has attracted many companies and organizations. Prometheus joined the Cloud Native Computing Foundation (CNCF) in 2016 as the second hosted project, after Kubernetes. It graduated from the CNCF in August, 2018.
As a next-generation open-source solution, Prometheus has a lot of O&M ideas that happen to coincide with those of Google SRE.
Prerequisites: You have created a Kubernetes cluster consisting of GPU ECS hosts through Container Service.
Log on to the Container Service console and select Container Service - Kubernetes. Choose Application > Deployment and click Create by Template.
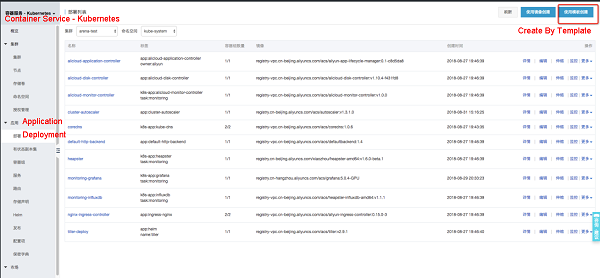
Select your GPU cluster and namespace. (For example, you can select the kube-system namespace.) Fill the YAML configuration template to deploy Prometheus and GPU-Exporter.
apiVersion: v1
kind: ConfigMap
metadata:
  name: prometheus-env
data:
  storage-retention: 360h
---

apiVersion: rbac.authorization.k8s.io/v1beta1
kind: ClusterRole
metadata:
  name: prometheus
rules:
  - apiGroups: ["", "extensions", "apps"]
    resources:
    - nodes
    - nodes/proxy
    - services
    - endpoints
    - pods
    - deployments
    - services
    verbs: ["get", "list", "watch"]
  - nonResourceURLs: ["/metrics"]
    verbs: ["get"]
---
apiVersion: v1
kind: ServiceAccount
metadata:
  name: prometheus
---
apiVersion: rbac.authorization.k8s.io/v1beta1
kind: ClusterRoleBinding
metadata:
  name: prometheus
roleRef:
  apiGroup: rbac.authorization.k8s.io
  kind: ClusterRole
  name: prometheus
subjects:
- kind: ServiceAccount
  name: prometheus
  namespace: kube-system # Change the namespace if you plan to use a different one.
---
apiVersion: extensions/v1beta1
kind: Deployment
metadata:
  name: prometheus-deployment
spec:
  replicas: 1
  selector:
    matchLabels:
      app: prometheus
  template:
    metadata:
      name: prometheus
      labels:
        app: prometheus
    spec:
      serviceAccount: prometheus
      serviceAccountName: prometheus
      containers:
      - name: prometheus
        image: registry.cn-hangzhou.aliyuncs.com/acs/prometheus:v2.2.0-rc.0
        args:
          - '--storage.tsdb.path=/prometheus'
          - '--storage.tsdb.retention=$(STORAGE_RETENTION)'
          - '--web.enable-lifecycle'
          - '--storage.tsdb.no-lockfile'
          - '--config.file=/etc/prometheus/prometheus.yml'
        ports:
        - name: web
          containerPort: 9090
        env:
        - name: STORAGE_RETENTION
          valueFrom:
            configMapKeyRef:
              name: prometheus-env
              key: storage-retention
        volumeMounts:
        - name: config-volume
          mountPath: /etc/prometheus
        - name: prometheus-data
          mountPath: /prometheus
      volumes:
      - name: config-volume
        configMap:
          name: prometheus-configmap
      - name: prometheus-data
        emptyDir: {}
---

apiVersion: v1
kind: Service
metadata:
  labels:
    name: prometheus-svc
    kubernetes.io/name: "Prometheus"
  name: prometheus-svc
spec:
  type: LoadBalancer
  selector:
    app: prometheus
  ports:
  - name: prometheus
    protocol: TCP
    port: 9090
    targetPort: 9090

---
apiVersion: v1
kind: ConfigMap
metadata:
  name: prometheus-configmap
data:
  prometheus.yml: |-
    rule_files:
      - "/etc/prometheus-rules/*.rules"
    scrape_configs:
    - job_name: kubernetes-service-endpoints
      scrape_interval: 10s
      scrape_timeout: 10s
      kubernetes_sd_configs:
      - api_server: null
        role: endpoints
      relabel_configs:
      - source_labels: [__meta_kubernetes_service_annotation_prometheus_io_scrape]
        action: keep
        regex: true
      - source_labels: [__meta_kubernetes_service_annotation_prometheus_io_scheme]
        action: replace
        target_label: __scheme__
        regex: (https?)
      - source_labels: [__meta_kubernetes_service_annotation_prometheus_io_path]
        action: replace
        target_label: __metrics_path__
        regex: (.+)
      - source_labels: [__address__, __meta_kubernetes_service_annotation_prometheus_io_port]
        action: replace
        target_label: __address__
        regex: (.+)(?::\d+);(\d+)
        replacement: $1:$2
      - action: labelmap
        regex: __meta_kubernetes_service_label_(.+)
      - source_labels: [__meta_kubernetes_service_namespace]
        action: replace
        target_label: kubernetes_namespace
      - source_labels: [__meta_kubernetes_service_name]
        action: replace
        target_label: kubernetes_name
If you use a namespace other than kube-system, you need to modify serviceAccount in ClusterRoleBinding in the YAML file.
apiVersion: rbac.authorization.k8s.io/v1beta1
kind: ClusterRoleBinding
metadata:
  name: prometheus
roleRef:
  apiGroup: rbac.authorization.k8s.io
  kind: ClusterRole
  name: prometheus
subjects:
- kind: ServiceAccount
  name: prometheus
namespace: kube-system # Change the namespace if you plan to use a different one.apiVersion: apps/v1
kind: DaemonSet
metadata:
name: node-gpu-exporter
spec:
selector:
matchLabels:
app: node-gpu-exporter
template:
metadata:
labels:
app: node-gpu-exporter
spec:
affinity:
nodeAffinity:
requiredDuringSchedulingIgnoredDuringExecution:
nodeSelectorTerms:
- matchExpressions:
- key: aliyun.accelerator/nvidia_count
operator: Exists
hostPID: true
containers:
- name: node-gpu-exporter
image: registry.cn-hangzhou.aliyuncs.com/acs/gpu-prometheus-exporter:0.1-f48bc3c
imagePullPolicy: Always
env:
- name: MY_NODE_NAME
valueFrom:
fieldRef:
fieldPath: spec.nodeName
- name: MY_POD_NAME
valueFrom:
fieldRef:
fieldPath: metadata.name
- name: MY_NODE_IP
valueFrom:
fieldRef:
fieldPath: status.hostIP
- name: EXCLUDE_PODS
value: $(MY_POD_NAME),nvidia-device-plugin-$(MY_NODE_NAME),nvidia-device-plugin-ctr
- name: CADVISOR_URL
value: http://$(MY_NODE_IP):10255
ports:
- containerPort: 9445
hostPort: 9445
resources:
requests:
memory: 30Mi
cpu: 100m
limits:
memory: 50Mi
cpu: 200m
---
apiVersion: v1
kind: Service
metadata:
annotations:
prometheus.io/scrape: 'true'
name: node-gpu-exporter
labels:
app: node-gpu-exporter
k8s-app: node-gpu-exporter
spec:
type: ClusterIP
clusterIP: None
ports:
- name: http-metrics
port: 9445
protocol: TCP
selector:
app: node-gpu-exporterapiVersion: extensions/v1beta1
kind: Deployment
metadata:
name: monitoring-grafana
spec:
replicas: 1
template:
metadata:
labels:
task: monitoring
k8s-app: grafana
spec:
containers:
- name: grafana
image: registry.cn-hangzhou.aliyuncs.com/acs/grafana:5.0.4-gpu-monitoring
ports:
- containerPort: 3000
protocol: TCP
volumes:
- name: grafana-storage
emptyDir: {}
---
apiVersion: v1
kind: Service
metadata:
name: monitoring-grafana
spec:
ports:
- port: 80
targetPort: 3000
type: LoadBalancer
selector:
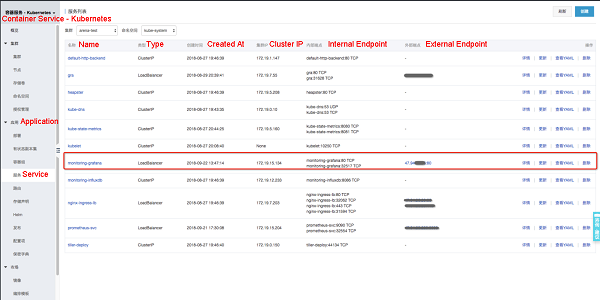
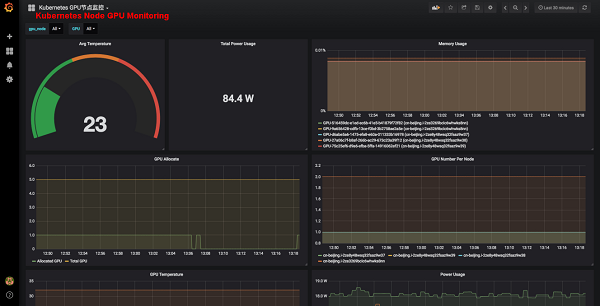
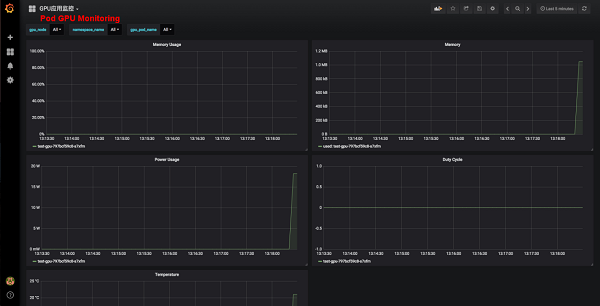
k8s-app: grafanaChoose Application > Service. Select the corresponding cluster and the kube-system namespace, and click the external endpoint of monitoring-grafana. The logon page of Grafana is displayed. Log on to Grafana using the initial username and password, which are both admin. You can change the password or add other accounts after successful logon. On the Dashboard, you can view the node and pod GPU monitoring information.
If you already have Arena, use it to submit a training task.
arena submit tf --name=style-transfer              \
              --gpus=1              \
              --workers=1              \
              --workerImage=registry.cn-hangzhou.aliyuncs.com/tensorflow-samples/neural-style:gpu \
              --workingDir=/neural-style \
              --ps=1              \
              --psImage=registry.cn-hangzhou.aliyuncs.com/tensorflow-samples/style-transfer:ps   \
              "python neural_style.py --styles /neural-style/examples/1-style.jpg --iterations 1000000"

NAME:   style-transfer
LAST DEPLOYED: Thu Sep 20 14:34:55 2018
NAMESPACE: default
STATUS: DEPLOYED

RESOURCES:
==> v1alpha2/TFJob
NAME                  AGE
style-transfer-tfjob  0s
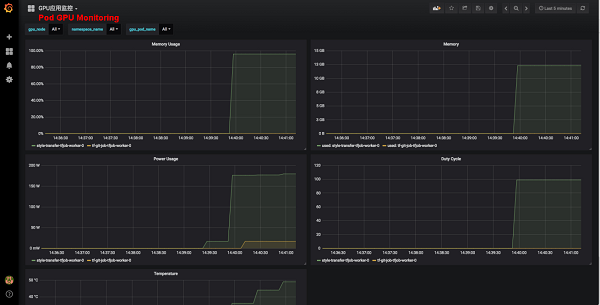
After the task is submitted, you can see the pod deployed through Arena and the pod GPU monitoring information.
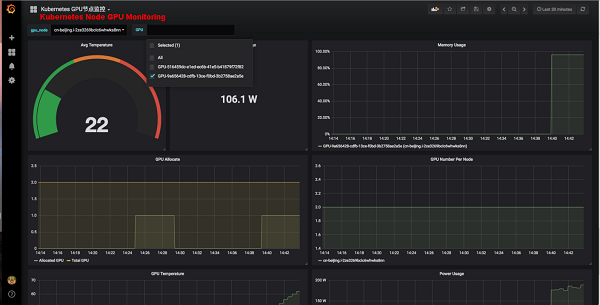
You can also see the GPU and load information about each node.
Serverless Kubernetes Container Service Supports Mounting EIPs with Pods

229 posts | 34 followers
FollowAlibaba Clouder - August 3, 2020
Alibaba Developer - February 3, 2020
Alibaba Cloud Blockchain Service Team - December 26, 2018
Alibaba Container Service - November 15, 2024
Alibaba Container Service - April 17, 2025
Alibaba Container Service - July 10, 2025

229 posts | 34 followers
Follow Container Service for Kubernetes
Alibaba Cloud Container Service for Kubernetes is a fully managed cloud container management service that supports native Kubernetes and integrates with other Alibaba Cloud products.
Learn More Container Compute Service (ACS)
A cloud computing service that provides container compute resources that comply with the container specifications of Kubernetes
Learn More ACK One
Provides a control plane to allow users to manage Kubernetes clusters that run based on different infrastructure resources
Learn More Container Registry
A secure image hosting platform providing containerized image lifecycle management
Learn MoreMore Posts by Alibaba Container Service