By Jiao Fangfei
In recent years, we have found that observability is frequently mentioned in the industry. Many people began to wonder about the differences between observability and conventional monitoring. Observability is not a new concept. It extends the conventional monitoring. Conventional monitoring is the act of evaluating system behavior from an external perspective and planning failure models for the entire system based on evaluation results. It focuses more on the O&M of a system. Today, we extend it to observability. Observability measures a system's internal running states from an internal white-box approach. It uses multiple observation methods, including conventional metrics, to do an in-depth analysis to understand the root causes of the overall running status of the system.
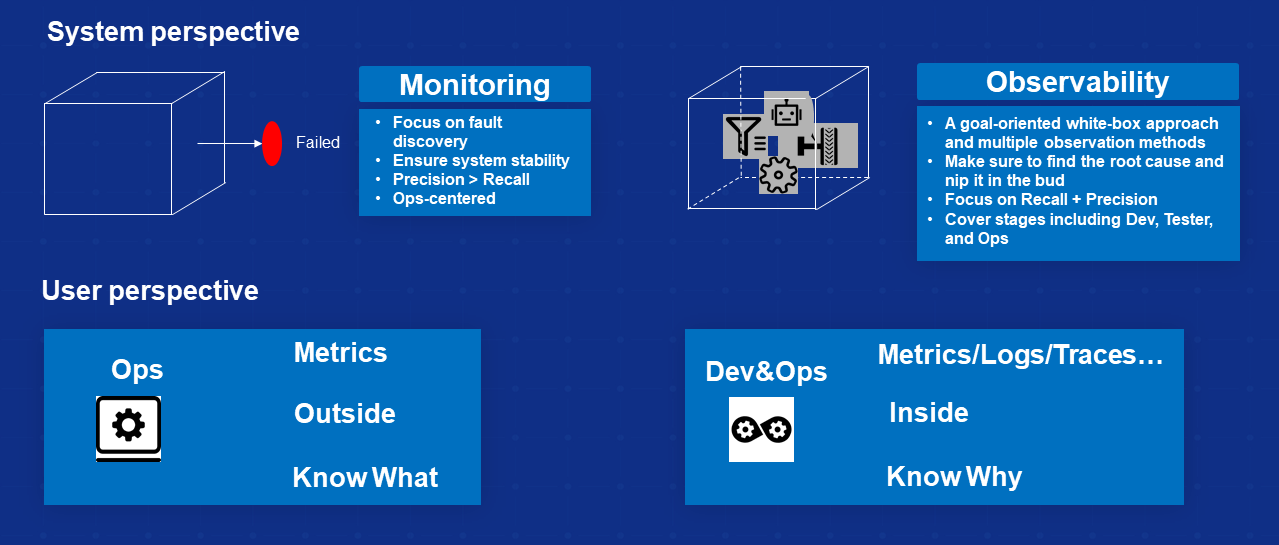
In addition, from the perspective of users, conventional monitoring is more about using traditional metrics to observe what is going on inside a system from the O&M perspective. However, cloud-native observability is involved throughout the entire lifecycle of an application from application development, testing, launching, and deployment to release. 360-degree monitoring is conducted in all lifecycle stages on metrics, system logs, business logs, and tracing. In other words, cloud-native observability diagnoses the root cause of problems that occurred inside the system through an inside-out manner. The problems themselves, the causes, and corresponding recovery methods are the main focus points of the whole observability.
As containers and microservices become more popular, we are entering the cloud-native era. To succeed in cloud-native transformation, traditional enterprises put forward higher requirements for monitoring and stability:
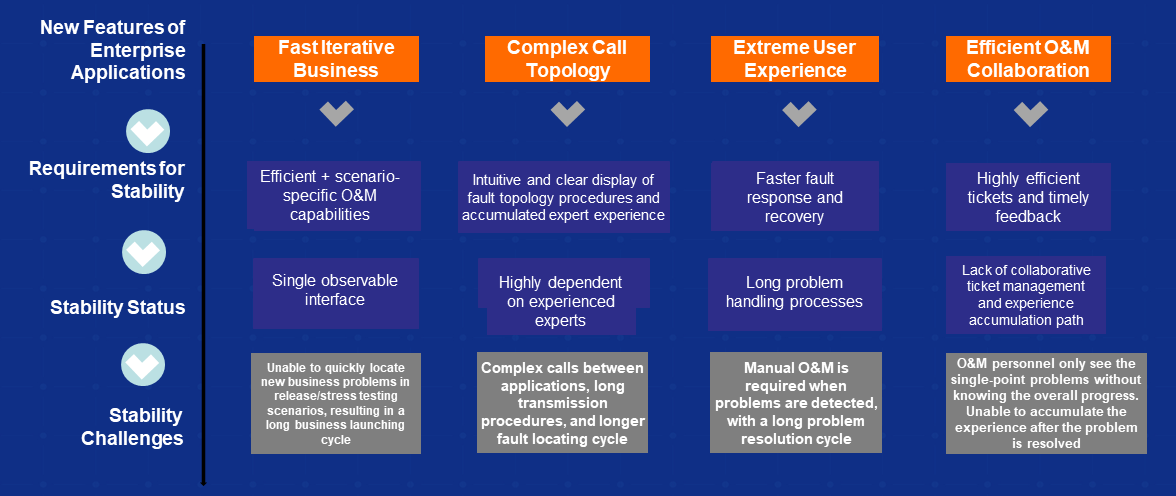
Cloud-native observability focuses on the following scenarios:
Next, I will explain some key points of cloud-native observability. These key points are summarized based on our best practices:
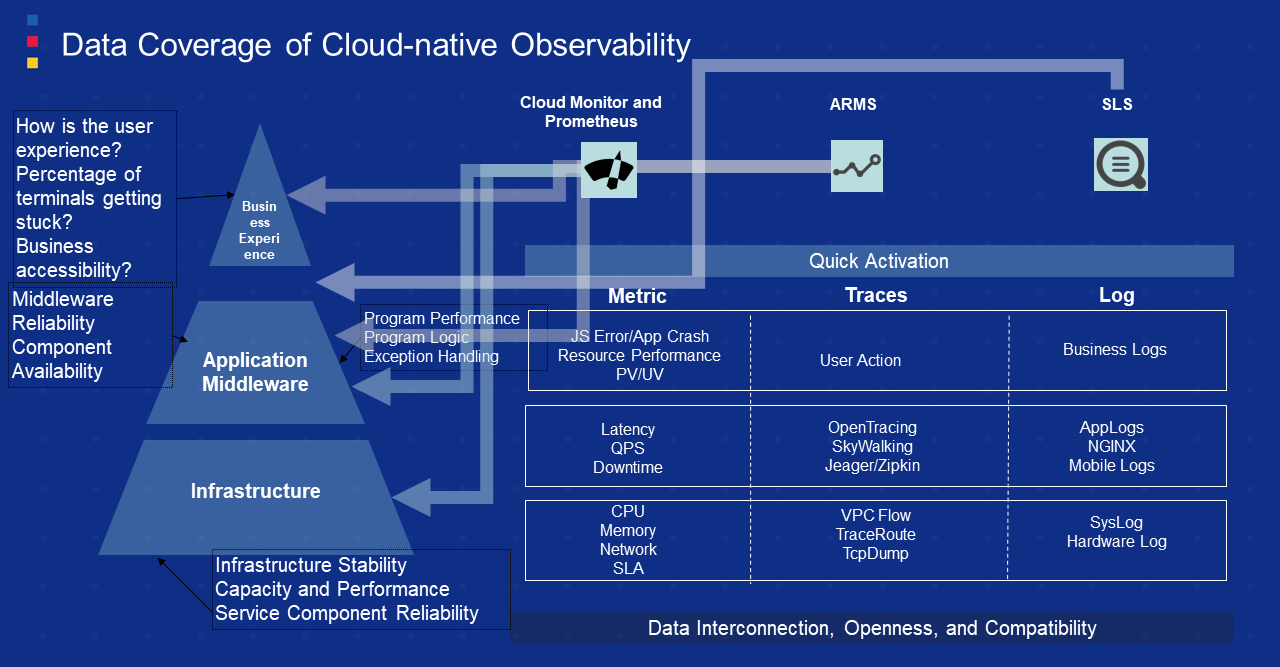
Today, the entire observability system is already very complete. We need to incorporate all the ends, including upper-layer businesses to applications, distributed systems, middleware, and underlying infrastructure, into the observability system. The core of the system is various monitoring products of Alibaba Cloud, including CloudMonitor, Prometheus, ARMS, and SLS. The combination of these products can help users integrate all observable points into the entire system, including metrics and traces with various dimensions, open-source compatibility, self-created tracing, business logs, system logs, and component logs. This is the first step, which is to solve the problems of where the data comes from and whether the data is comprehensive.
How can I build a model after obtaining the data? Considering the O&M of traditional enterprises, a unified monitoring view (for example, a 2D or 3D display) may be required. I made a video showing the model. The download link is available here.
Firstly, the bottom layer is IaaS, involving containers and virtual machines. Another layer involves applications, including microservice applications and components, distributed databases, distributed messages, and caches. The upper layer provides the entire application services, and each layer can be analyzed. You can observe the very detailed information by just checking a certain faulty node.
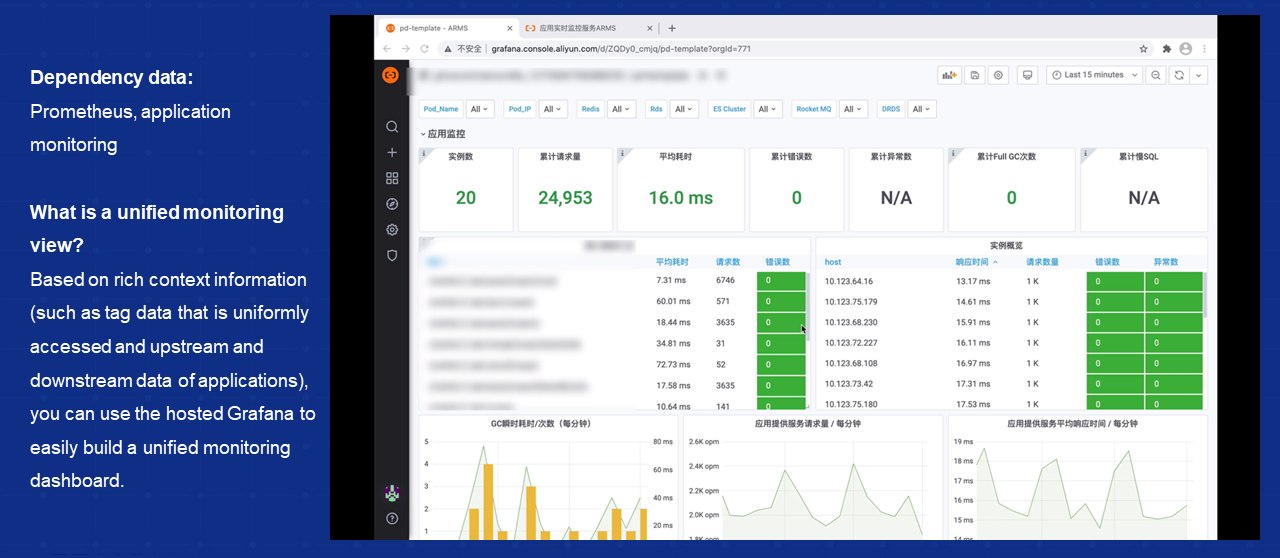
Secondly, in a container-based scenario, since today's containers are a standard unit of the entire infrastructure, you can rely on the entire monitoring system to build a platform to meet your needs quickly. We monitor key core data components, including application status, RT, CPU response, messages, and caching status. We can also display what we monitored, including ApsaraDB RDS, management databases, Message Queue (MQ), and core databases. In addition, we have many database diagnosis methods, including using the Elasticsearch engine and MQ. All of them constitute a unified monitoring dashboard for O&M personnel, allowing convenient and fast customization.
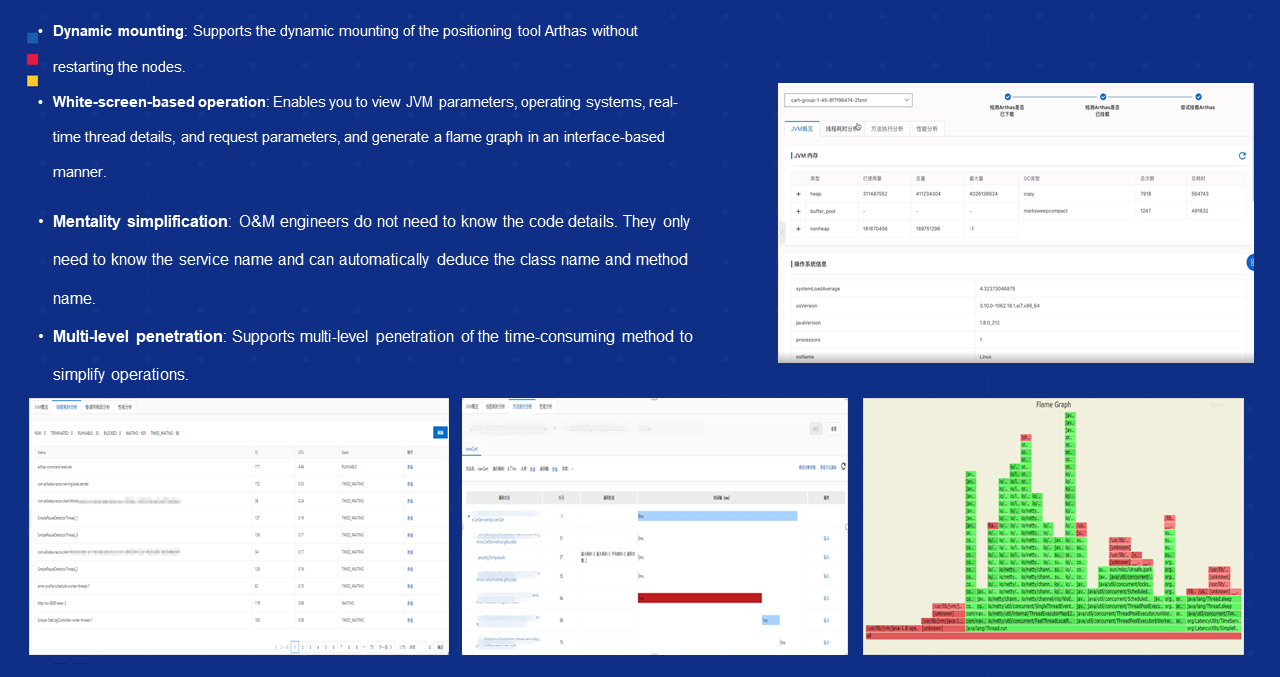
Finally, white-screen-based integrated positioning. After we get the monitored data, the next step is to locate the problem. Today, products used internally in Alibaba and provided externally by Alibaba can achieve a fast interface-based positioning. You don't need to browse your code, log on to the machine, and check the logs. All problems are displayed in the whole procedure, and you can locate the root node of the entire procedure based on the problem details. In addition, memory data, CPU, JVM parameters, and thread parameters that we care about can be displayed in an interface-based manner. This is attributed to the high integrations we did for the observability system.
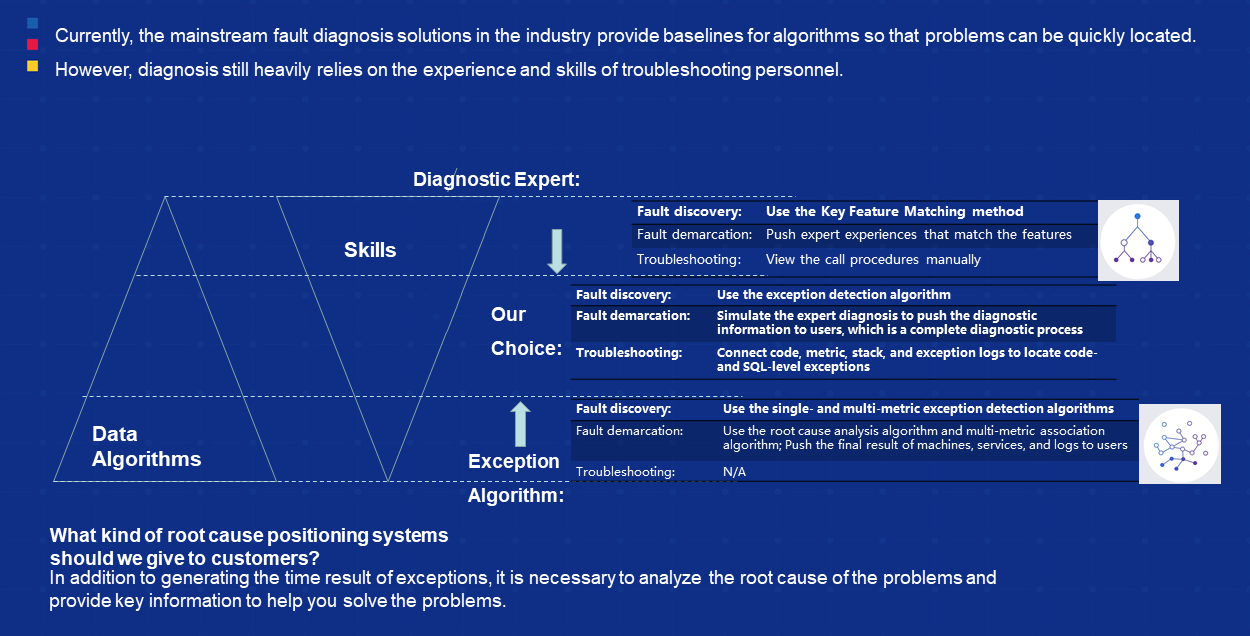
It is far from enough after knowing how to collect data and build a data model. Today, we need to perform in-depth mining on observed data, which is mainly divided into two aspects:
One is the use of AI technology. We found that using AI technology alone sometimes does not work, and some expert experience is required. We need to accumulate all expert experiences. Currently, the mainstream fault diagnosis solution in the industry is to provide baseline standards using algorithms and then detect the problems. However, the root cause diagnosis still depends heavily on the skills of troubleshooting engineers. We need to find the abnormal results and perform an end-to-end analysis on the root cause of problems and display key information. This relies on two factors: human skills and machine algorithms.
The first factor is human skills. Our expert experience can help you solve problems to some extent, but accumulating the experience is a problem. As for machine algorithms, we use deterministic AI algorithms to detect metrics and solve problems.
Today, our idea is to combine these two items, which means offering guidance by accumulating expert experience based on utilizing AI algorithms. In real-world practices, we found that if you only rely on AI, it cannot give you any help in some scenarios. Therefore, you must rely on accumulated expert experience to train these algorithms.
We made a combination of the two. In terms of expert experience, we utilized the expert experience in designing the product. Alibaba Cloud ARMS is an observability product that covers more than 50 scenarios with faults, including application changes, sudden increase of RT, sudden large requests, standalone application problems, and MySQL. Experiences related to dealing with these scenarios will be accumulated to help you diagnose problems in these scenarios quickly and automatically. We accumulated our expert experiences through extensive practices and display them automatically in an interface-based manner.
What is essential is daily predictive monitoring that we must implement, which is commonly used within Alibaba Group. Exception detection is mainly performed in Alibaba from three aspects:
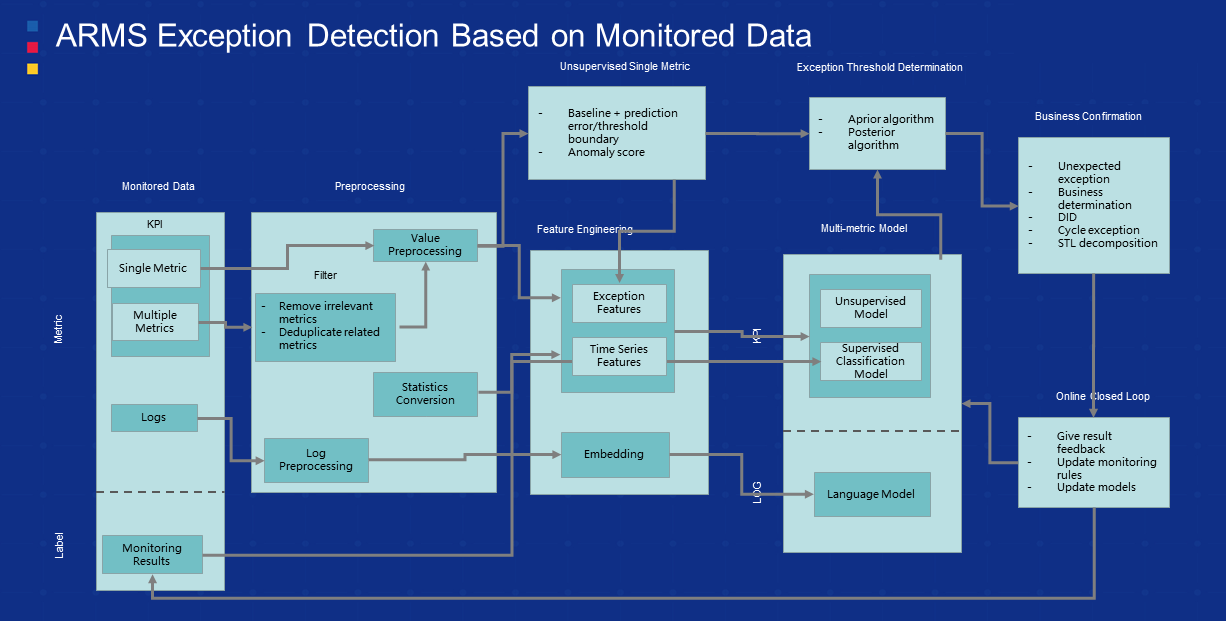
The first part is about monitored data. We remove some irrelevant metrics or deduplicate some relevant metrics through preprocessing after the monitored data of multiple metrics is collected. In this step, we use an innovative method, which adopts a standardized model that incorporates normal and abnormal differences into a certain range and then performs the analysis. After the preprocessing, we need to conduct feature engineering. We regard the score of single-metric exception as an exceptional feature. We have done a lot in this regard. The purpose is to improve the accuracy of the entire exception features and time-series features. After completing the feature project, we need to build a multi-metric model. Alibaba uses time series forecasting to build a more accurate multi-metric model. Meanwhile, after the model is created, when applications are launched and running, we will continuously provide feedback and revise the trained model to form a closed loop with positive feedback. This is the basic framework of an observability product for daily detection.
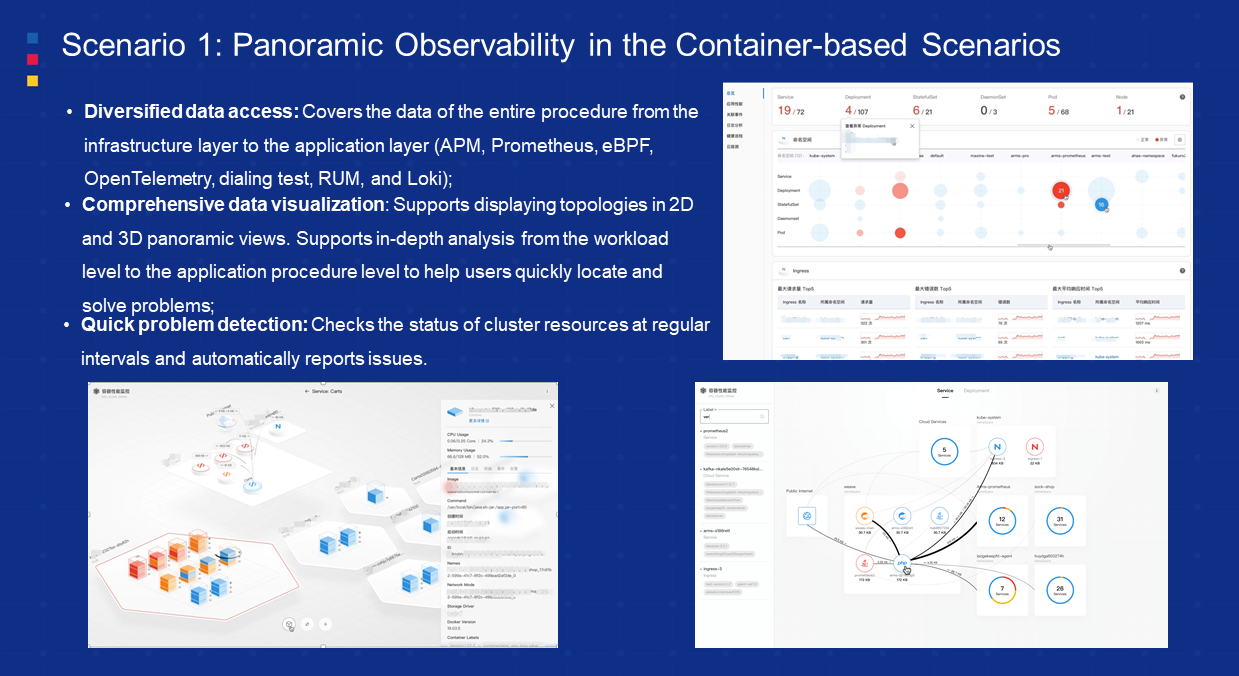
Scenario 1: Panoramic Observability in Container-Based Scenarios: Today, containers have become a standard unit of the IaaS layer. The observability of the entire container-based scenarios includes the full-procedure end-to-end diverse data access capabilities, which means the ability to incorporate the APM vendors, Prometheus, active dial tests, traffic monitoring, and network monitoring into the monitoring scope of container-based scenarios. The other is about comprehensive data visualization. We will present the observable data models in an easy and friendly way to O&M personnel and customers. The topology of each layer can be displayed in a panoramic 2D or 3D view. You can analyze each layer in-depth for the root cause. Another feature is quick problem detection. All problems can be analyzed in-depth, layer by layer using expert experience and white-screen diagnosis methods. You can use these methods until you find the relevant information at the bottom to solve the problem.
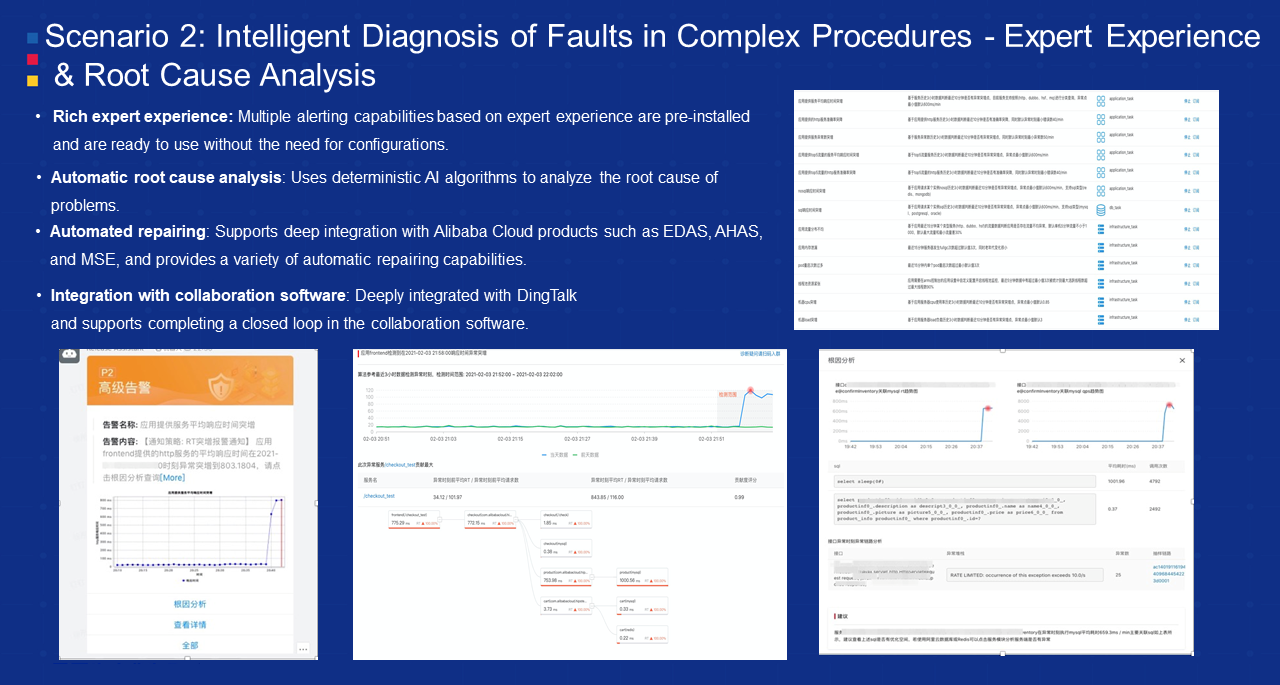
Scenario 2: Intelligent Diagnosis in Complex Procedures: It mainly relies on two points. The first point is expert experience. We have accumulated expert experience from nearly 50 scenarios to conduct interface-based root cause analysis. The second point uses deterministic AI algorithms to predict and detect some exceptions. We integrate the entire observability system of Alibaba Cloud (including the core cloud products like ECS, EDAS, AHAS, and MSE) with all other products and then inject some auto-recovery capabilities. By doing so, we can realize automatic problem discovery, diagnosis, and recovery.
Scenario 3: I want to discuss our best practices on AI technologies for exception detection. There are two main scenarios:
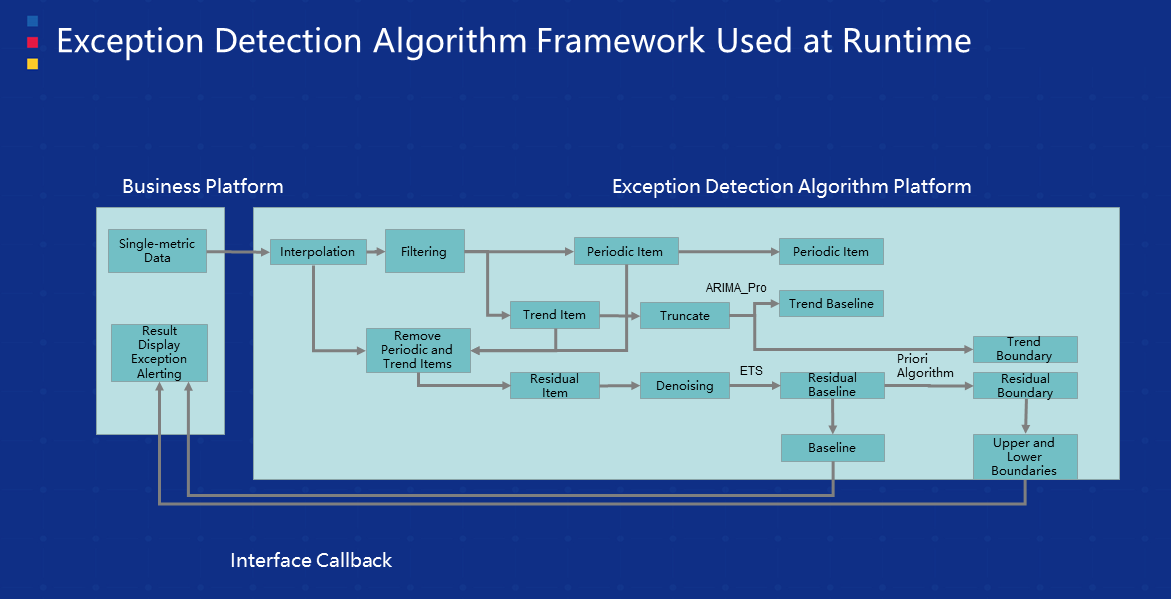
The first scenario is about common runtime exception detection. Alibaba runs about 8,000 to 10,000 applications internally, of which the monitoring frequency is within minutes. In this case, there are millions of metrics to be monitored almost every moment. The workload is very high. It is unrealistic to only rely on O&M personnel. Therefore, we use the exception detection algorithm platform. The main idea is to use baseline forecasting after STL time series decomposition and predictions based on the upper and lower boundaries.
Regarding baseline forecasting, we have several best practices. The one is using STL to perform predicted time series data decomposition. The other is ARIMA-Pro based on the ARIMA framework, which can detect periodic time series and update RAIMA framework parameters automatically, including the DBQ parameter (difference and AR parameters.) We can form a closed loop For these core AI parameters.
Another model is based on Holt-Winters methods to forecast time series data and predict residual values. Besides, the context estimation scheme is implemented based on an a priori solution that involves IQR and historical data. This is a good internal practice. About the framework of the runtime detection algorithm I just mentioned, the core innovative points are described as below:
All these are core technical points of the algorithm platform. What can be achieved after this platform is adopted? For example, if we use the statistical method of RMSE equilibrium distribution, we can probably reduce the error from 0.74 to 0.59, down by nearly 20%. In June 2019, this algorithm framework successfully predicted a fault caused by refunds. This was a relatively serious fault for Alibaba, but the framework avoided it.
The second scenario is about exception detection during application release. Many faults occur when a new version is released. Therefore, we have implemented many algorithms for application release in Alibaba, where 8,000 applications are run, and nearly 4,000 releases are conducted every day. The internal application iterations are very fast. If we rely on conventional monitoring methods with fixed thresholds, the solution is not flexible enough and has poor scalability. In addition, the monitoring thresholds need to be manually updated, resulting in low efficiency.
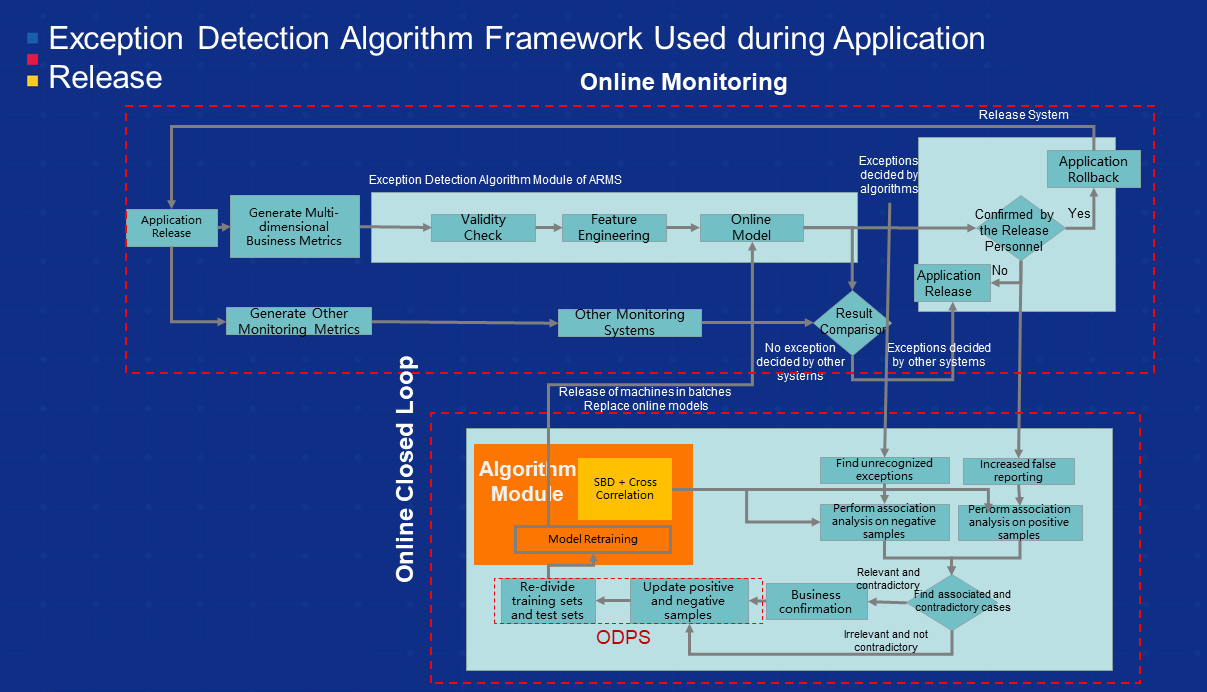
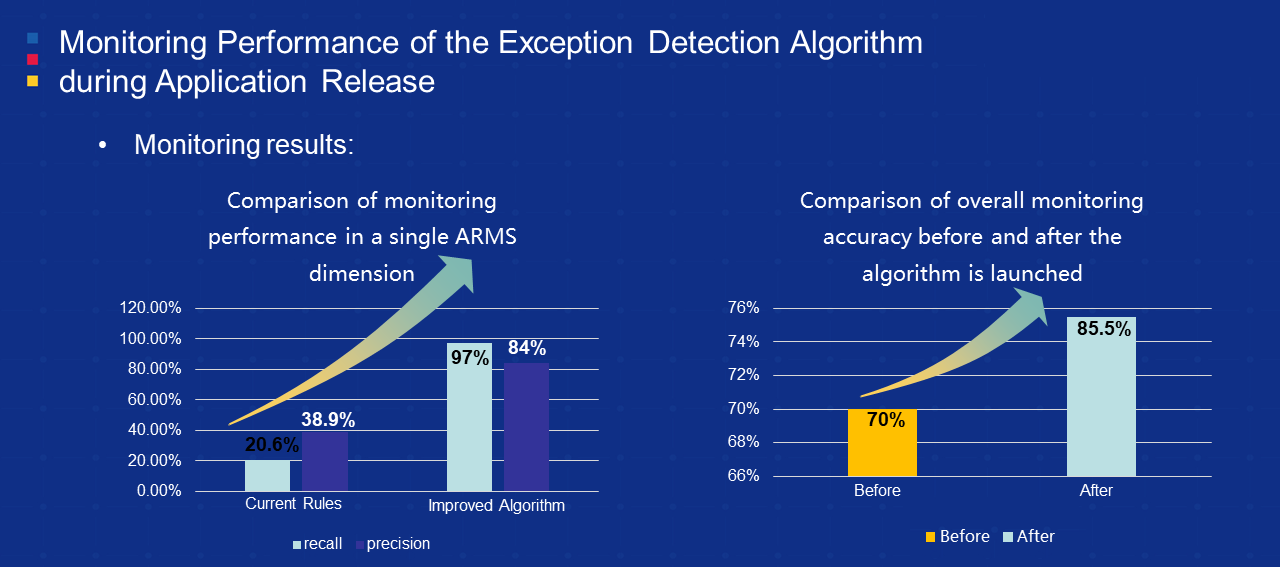
The core of the framework that we implemented for application release is to form a self-adaptive closed loop for algorithm models. First, we update the model again by updating positive and negative samples and training sets on the big data platform for the entire online model, incorrect detection filtering, and detection exception. In addition, this framework is based on SBD, which can analyze the relevance of offset time series. The whole training closed loop is great. This was the core innovative point of the exception detection algorithm framework for application release at that time. The performance is clear. After the entire algorithm framework was launched, the monitoring performance in a single internal dimension improved three to five times. In addition, from the overall monitoring dimension, the accuracy rate increased by 5% to 10%.
This article mainly describes cloud-native observability during application runtime and release. It also discusses other relevant content, such as the monitoring of daily exceptions *which is a typical example in the industry) and the detection of abnormal business metrics. We have integrated some AI technologies and expert experiences and have been applied them to external cloud products gradually. Readers are welcome to use them.
Build Modernized Applications Using Cloud-Native Technologies

212 posts | 13 followers
FollowAlibaba Cloud Native Community - March 18, 2025
Alibaba Cloud Community - January 4, 2026
Alibaba Cloud Native - September 11, 2023
Alibaba Cloud Serverless - June 23, 2021
Alibaba Cloud Native Community - November 11, 2022
Alibaba Cloud Native Community - April 29, 2024

212 posts | 13 followers
Follow Microservices Engine (MSE)
MSE provides a fully managed registration and configuration center, and gateway and microservices governance capabilities.
Learn More ACK One
Provides a control plane to allow users to manage Kubernetes clusters that run based on different infrastructure resources
Learn More Container Service for Kubernetes
Alibaba Cloud Container Service for Kubernetes is a fully managed cloud container management service that supports native Kubernetes and integrates with other Alibaba Cloud products.
Learn More Container Registry
A secure image hosting platform providing containerized image lifecycle management
Learn MoreMore Posts by Alibaba Cloud Native