Filebeat is a lightweight log shipper from the Beats family. This guide walks through deploying a Filebeat shipper from the Alibaba Cloud Elasticsearch console to collect logs from an Elastic Compute Service (ECS) instance and send them to an Elasticsearch or Logstash cluster.
Prerequisites
Before you begin, make sure you have:
An Alibaba Cloud Elasticsearch or Logstash cluster. This guide uses a V6.7.0 cluster. See Create an Alibaba Cloud Elasticsearch cluster or Create an Alibaba Cloud Logstash cluster.
Auto Indexing enabled on your Elasticsearch cluster. Alibaba Cloud Elasticsearch disables Auto Indexing by default for security reasons. Beats depends on this feature when it collects the logs of ECS instances. To enable it, see Configure the YML file.
An ECS instance in the same virtual private cloud (VPC) as your Elasticsearch or Logstash cluster, running Alibaba Cloud Linux (Alinux), Red Hat Enterprise Linux (RHEL), or CentOS. Beats supports only these three operating systems. See Create an instance on the Custom Launch tab.
Cloud Assistant and Docker Community Edition (Docker-CE) installed on the ECS instance. Alibaba Cloud deploys Beats inside Docker containers. Use Docker-CE specifically — other Docker variants such as podman-docker cause deployment failures. See Install Cloud Assistant Agent and Deploy and use Docker on ECS instances.
Beats installs to/opt/aliyunbeats/by default and creates three subdirectories:conf(configuration),logs(Beats log files), anddata(Beats data files). Do not delete or modify these files — doing so can cause errors or data loss. Check thelogsdirectory to diagnose issues.
Step 1: Open the Beats Data Shippers page
Log on to the Alibaba Cloud Elasticsearch console.
In the top navigation bar, select a region.
In the left-side navigation pane, click Beats Data Shippers.
(Optional) If this is your first visit, read the message that appears and click OK to authorize the system to create a service-linked role for your account.
Beats depends on this service-linked role to access your data sources. Do not delete it. For details, see Elasticsearch service-linked roles.
Step 2: Configure the Filebeat shipper
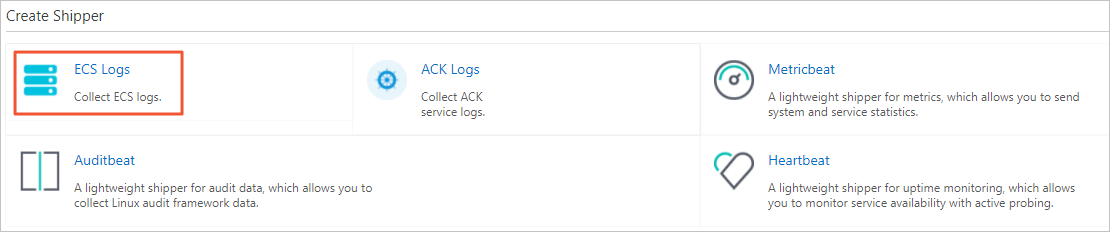
In the Create Shipper section, hover over Filebeat and click ECS Logs.
For other shipper types, click the shipper name directly — for example, click Metricbeat to create a Metricbeat shipper.
In the Configure Shipper step, fill in the parameters described in the following table. A minimal Shipper YML Configuration example:
ImportantDo not configure the output destination in Shipper YML Configuration — you already selected it in the Output field. Duplicating it causes a shipper installation error.
Index names are fixed and cannot be customized. The system creates indexes in the format
filebeat-%{[agent.version]}-%{+yyyy.MM.dd}— for example,filebeat-6.8.5-2021.12.11.
Parameter Description Shipper Name 1–30 characters; letters, digits, underscores ( _), and hyphens (-); must start with a letter.Version Set to 6.8.5 — the only version supported for Filebeat. Output The destination cluster. Select from your existing Elasticsearch or Logstash clusters. The protocol must match the selected Elasticsearch cluster. Elasticsearch V8.X clusters are not supported. Username and Password If you select Elasticsearch for Output, enter the credentials for the destination Elasticsearch cluster. The default username is elastic. The password was set when you created the cluster; reset it if needed. See Reset the access password for an Elasticsearch cluster.Enable Kibana Monitoring Monitors shipper metrics in Kibana. If Output is Elasticsearch, the same cluster is used for monitoring. If Output is Logstash, configure a monitor in the Logstash cluster's configuration file. Enable Kibana Dashboard Enables the default Kibana dashboard. Kibana is deployed in a VPC — enable the Private Network Access feature for Kibana beforehand. See Configure a public or private IP address whitelist for Kibana. Filebeat File Path The directory on the ECS instance from which logs are collected. This path is mounted into the Docker container and must match the pathsvalue in Shipper YML Configuration. For paths containing wildcards (*), specify only the non-wildcard parent directory — for example, to collect from/var/log/*/*.log, enter/var/or/var/log/. To collect from multiple directories, click Add and enter each path, then add all paths to thepathsparameter in Shipper YML Configuration.Shipper YML Configuration The Filebeat configuration. Log collection must be enabled and pathsmust match Filebeat File Path. See Prepare a YML configuration file for a shipper for additional options.filebeat.inputs: - type: log enabled: true paths: - /var/log/*.log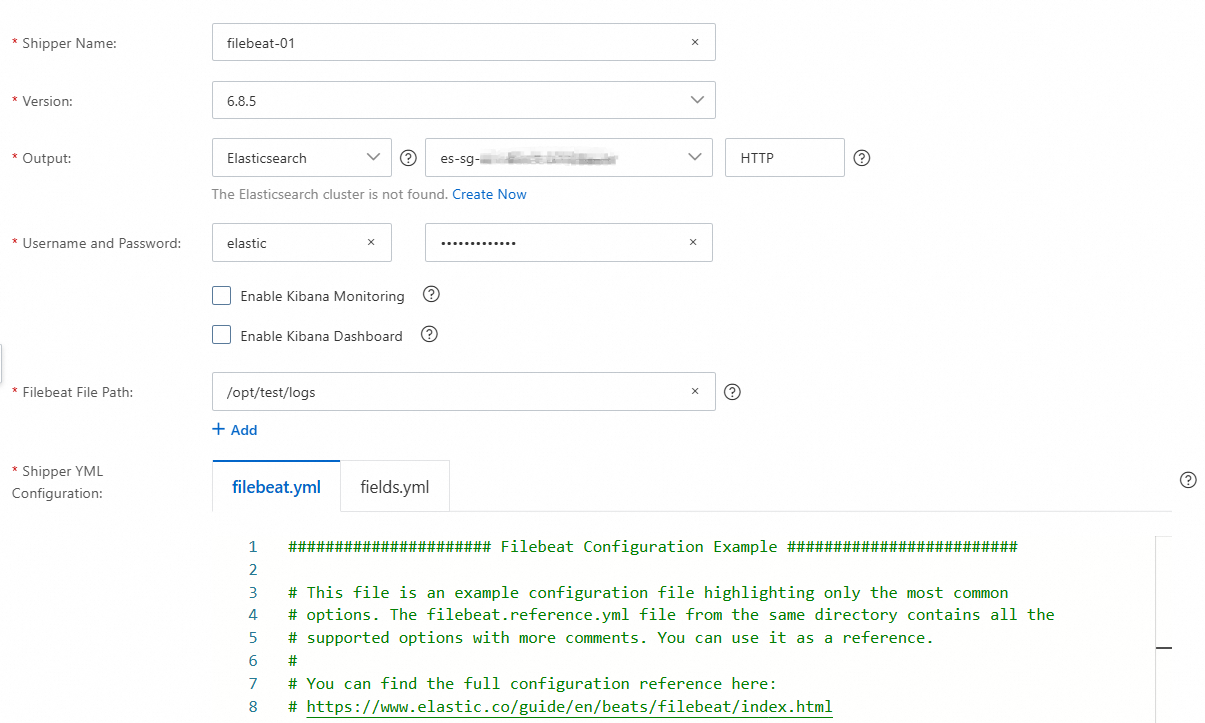
Click Next.
Step 3: Authorize and install the shipper
(Optional) If this is your first time on the Install Shipper step, click Authorize Now. On the Cloud Resource Access Authorization page, click Agree to Authorization. This creates two system roles via Resource Access Management (RAM): Do not delete these roles or policies while Beats is in use. If they are accidentally deleted, go to the Cloud Resource Access Authorization page to re-authorize. Your RAM user also needs the following custom policy — see Create a custom policy:
AliyunElasticsearchAccessingOOSRole (policy:
AliyunElasticsearchAccessingOOSRolePolicy)AliyunOOSAccessingECS4ESRole (policy:
AliyunOOSAccessingECS4ESRolePolicy)
{
    "Version": "1",
    "Statement": [
        {
            "Effect": "Allow",
            "Action": [
                "ram:CreateRole",
                "ram:AttachPolicyToRole",
                "ram:GetRole"
            ],
            "Resource": "acs:ram:*:*:role/*",
            "Condition": {
                "ForAllValues:StringEquals": {
                    "ram:TrustedPrincipalTypes": "Service",
                    "ram:ServiceNames": [
                        "elasticsearch.aliyuncs.com",
                        "oos.aliyuncs.com"
                    ]
                }
            }
        },
        {
            "Effect": "Allow",
            "Action": "ram:AttachPolicyToRole",
            "Resource": "acs:ram:*:*:policy/*"
        },
        {
            "Action": "ram:PassRole",
            "Resource": "*",
            "Effect": "Allow",
            "Condition": {
                "StringEquals": {
                    "acs:Service": "elasticsearch.aliyuncs.com"
                }
            }
        }
    ]
}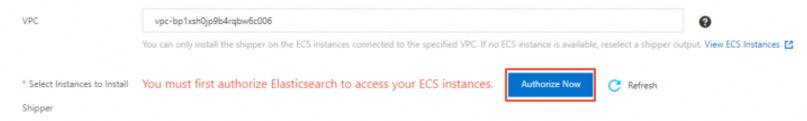
Select the ECS instance on which you want to install the shipper.
The list shows all ECS instances in your account that share the same VPC as the Output cluster. Only instances with Cloud Assistant and Docker installed can run a shipper.
Click Start.
In the Start Shipper dialog box, click Back to Beats Shippers.
Step 4: Verify the shipper is running
In the Manage Shippers section, find your newly created shipper and check its Status column.
Enabled — the shipper was created. The two numbers that follow (for example,
2/3) show how many ECS instances have the shipper installed versus the total requested. When both numbers match, installation is complete on all instances.
To check per-instance status, click View Instances in the Actions column. The Installed Shippers column shows one of three values:
| Status | Meaning | Next step |
|---|---|---|
| Normal Heartbeat | Installation succeeded | No action needed |
| No Heartbeat | Shipper not responding | Remove the instance or retry installation |
| Installation Failed | Installation error | Remove the instance or retry; if retry fails, see Installation failures of Beats shippers |
Step 5: View monitoring and dashboards (optional)
If you enabled Kibana Monitoring or Kibana Dashboard during configuration, access them from the Kibana console after the shipper starts.
In the Manage Shippers section, hover over
 in the Actions column for your shipper, and select View Dashboards.
Log in to the Kibana console with your username and password.
To view dashboards: click Dashboard in the left-side navigation pane, then select a metric.
To view monitoring data: click Monitoring in the left-side navigation pane, then select a monitoring item.
FAQ
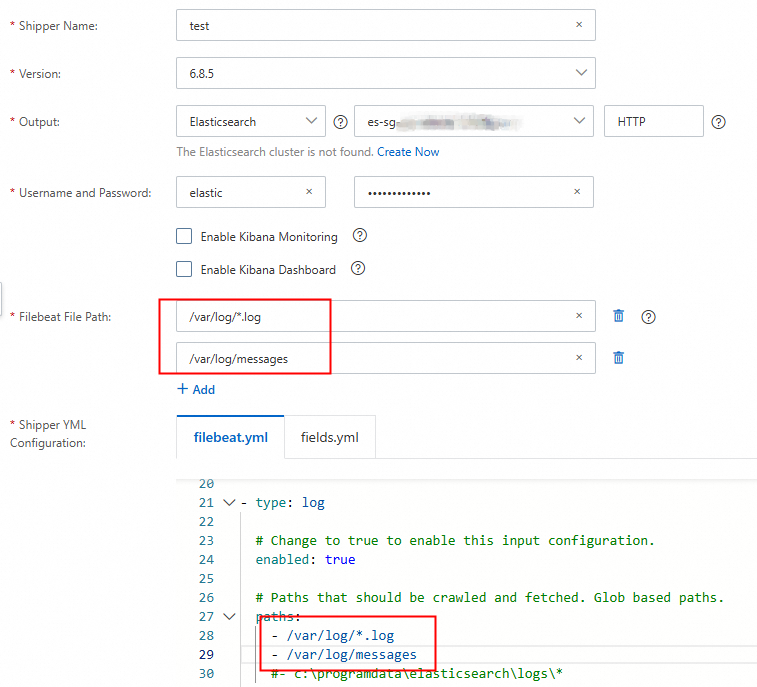
How do I collect logs from multiple directories?
Click Add when configuring the Filebeat File Path parameter, enter each additional directory, and add all paths to the paths parameter in Shipper YML Configuration.
What do I do if Beats shipper installation fails on an ECS instance?
Follow the troubleshooting steps in Installation failures of Beats shippers.
API reference
To create a shipper programmatically, use the CreateCollector API operation.