Written by Liu Xiaoguo, an Evangelist of the Elasticsearch Community in China, and edited by Lettie and Dayu
Released by ELK Geek
Nginx is a popular, open-source web server used for millions of applications around the world and is second only to Apache. It also acts as a reverse proxy, HTTP cache, and load balancer. From the operation and security perspective, Nginx needs to be monitored in real-time because it plays a critical role in various application architectures.
Nginx provides a variety of log entry options, including log entry to files, conditional log entry, and syslog log entry. Nginx generates two log types that are used for operation monitoring and troubleshooting: error logs and access logs.
By default, both logs are usually located under /var/log/nginx, but this location may vary from system to system.
# cd /var/log/nginx/
# ls
access.log error.logError logs contain diagnostic information that is used to troubleshoot operational problems. Nginx error_log can be used to specify the path of log files and the severity level of logs, and it can be used in main, http, mail, stream, server, and location in the sequence.
A sample log is as follows:
2020/04/22 10:06:21 [error] 9289#0: *4128 connect() failed (111: Connection refused) while connecting to upstream, client: 101.133.213.44, server: notest004, request: "GET /admin/ HTTP/1.1", upstream: "http://121.41.222.215:3000/admin/", host: "121.41.222.215"Access logs contain information about all requests sent to and served by Nginx. Therefore, they are valuable resources for performance monitoring and security. The default format for Nginx access logs is a combined format but may vary between distributions. Use the access_log pseudo command to set the log file path and log format like the operations on error logs.
Sample Log:
47.97.73.90 - - [22/Apr/2020:06:26:39 +0800] "GET / HTTP/1.1" 502 559 "-" "Mozilla/5.0 (X11; Linux x86_64) AppleWebKit/537.36 (KHTML, like Gecko) HeadlessChrome/69.0.3494.0 Safari/537.36" "-"The simplest way to send Nginx logs to Alibaba Cloud Elasticsearch is via Filebeat. Install Node.js, Nginx, and Filebeat on an Elastic Compute Service (ECS) instance and activate Alibaba Cloud Elasticsearch.
Node.js is a simple web server runtime environment based on the Express framework. Install Node.js using the following command on an Alibaba Cloud ECS instance.
# yum install nodejs
# yum install -y npm
##### View node and npm version #######
# node -v
# npm -v
#### Deploy the web server of nodejs, download simple nodejs code from git
# git clone https://github.com/liu-xiao-guo/samplenodejs
#### Go to the root directory of samplenodejs and run the following commands ####
# cd samplenodejs/
# npm install
# npm start
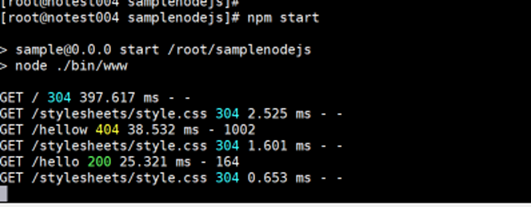
Enable port 3000 in the ECS security group, and enter the ECS IP address in the address bar of the browser: http://121.41.xx.xx:3000/hello

If the following output appears in the console and browser, it indicates that the Node.js application is running successfully.
Use the following command on the Alibaba Cloud ECS instance to install Nginx:
# yum install nginx
#### Configure reverse proxy ####
# vim /etc/nginx/nginx.conf
 server {
        listen       80 default_server;
        listen       [::]:80 default_server;
        server_name  notest004;

        # Load configuration files for the default server block.
        include /etc/nginx/default.d/*.conf;

        location / {
           proxy_pass http://121.40.100.115:3000;
           index index.html index.htm;
           proxy_set_header Host $host;
           proxy_set_header X-Real-IP $remote_addr;
        }
    }
#### Start nginx ###
# systemctl start nginx
To stop Nginx, run the following command:
systemctl stop nginxTo start the Web server when Nginx stops, run the following command:
systemctl start nginxTo stop and then start the service again, run the following command:
systemctl restart nginxIn the Alibaba Cloud ECS environment, download the Filebeat installation package, and decompress it.
# wget https://artifacts.elastic.co/downloads/beats/filebeat/filebeat-6.7.0-linux-x86_64.tar.gz
# tar -zxvf filebeat-6.7.0-linux-x86_64.tar.gzModify filebeat-6.7.0-linux-x86_64/filebeat.yml as follows:
#-------------------------- Elasticsearch output ------------------------------
output.elasticsearch:
  # Array of hosts to connect to.
  hosts: ["es-cn-0pp19tb10000688c8p.elasticsearch.aliyuncs.com:9200"]
  username: "elastic"
  password: "Elastic123"

  setup.kibana:
host: "https://es-cn-0pp19tb1000888c8p.kibana.elasticsearch.aliyuncs.com:5601"# ./filebeat modules enable nginxRun the following command to display the Nginx module on the Kibana Dashboard.
# ./filebeat setup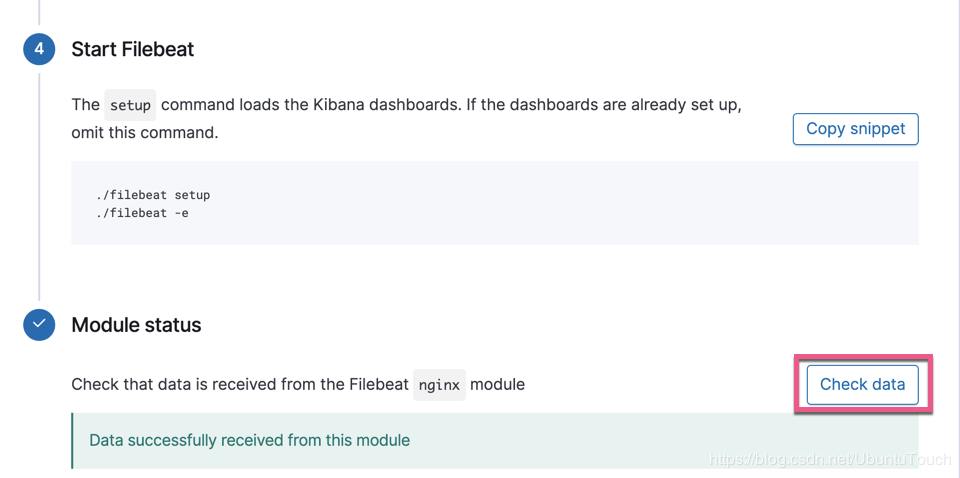
At this point, the installation has been completed.
Log on to Kibana and click "Dashboard" to select the Nginx module that has been imported.
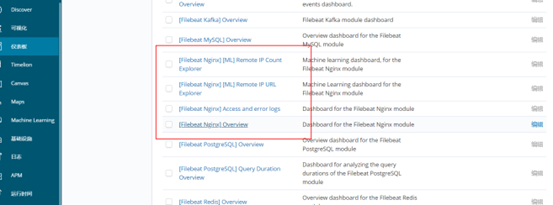
Click "[Filebeat Nginx] Overview".
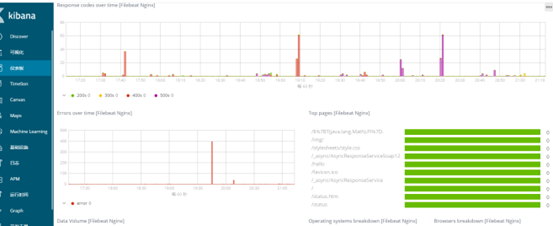
With this, the monitoring process of Nginx logs is completed. View all the information about Nginx in the Kibana Dashboard.
This article is adapted from the article "Beats: Use the Elastic Stack to Monitor Nginx Web Servers" and modified based on Alibaba Cloud service environment authorization.
Source: (Page in Chinese) https://me.csdn.net/UbuntuTouch
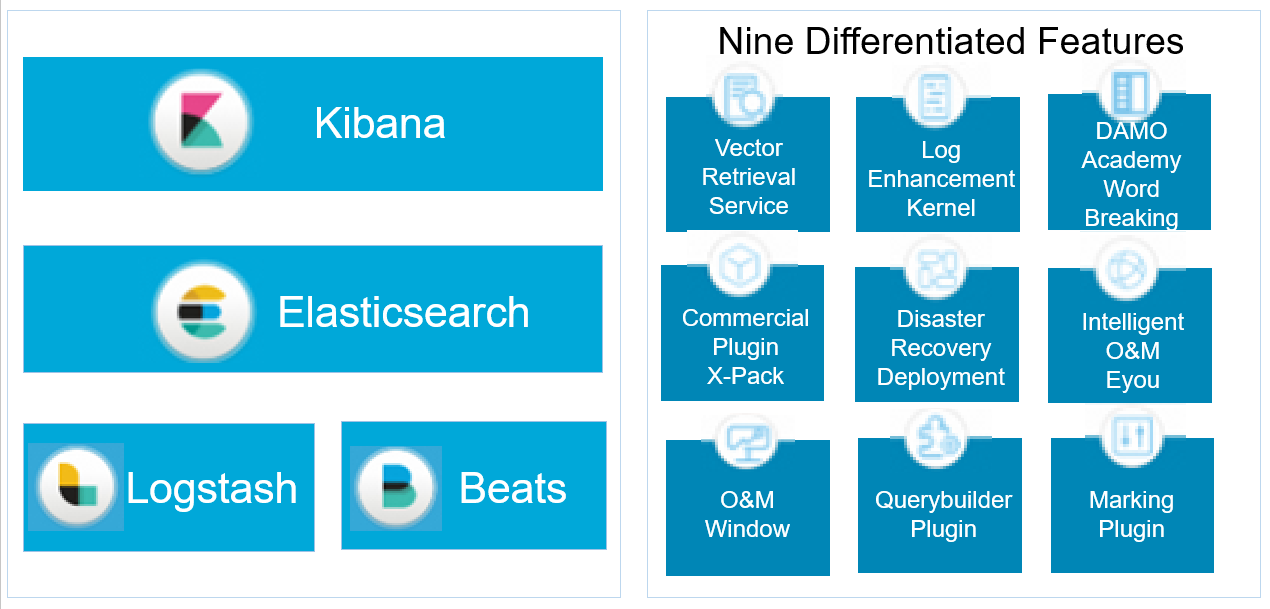
The Alibaba Cloud Elastic Stack is completely compatible with open-source Elasticsearch and has nine unique capabilities

2,593 posts | 794 followers
FollowData Geek - April 30, 2024
Data Geek - May 13, 2024
Alibaba Clouder - December 29, 2020
Data Geek - February 17, 2025
Alibaba Cloud Indonesia - August 1, 2023
Iain Ferguson - December 5, 2021

2,593 posts | 794 followers
Follow Web Hosting Solution
Explore Web Hosting solutions that can power your personal website or empower your online business.
Learn More Big Data Consulting for Data Technology Solution
Alibaba Cloud provides big data consulting services to help enterprises leverage advanced data technology.
Learn More Big Data Consulting Services for Retail Solution
Alibaba Cloud experts provide retailers with a lightweight and customized big data consulting service to help you assess your big data maturity and plan your big data journey.
Learn More Alibaba Cloud Elasticsearch
Alibaba Cloud Elasticsearch helps users easy to build AI-powered search applications seamlessly integrated with large language models, and featuring for the enterprise: robust access control, security monitoring, and automatic updates.
Learn MoreMore Posts by Alibaba Clouder