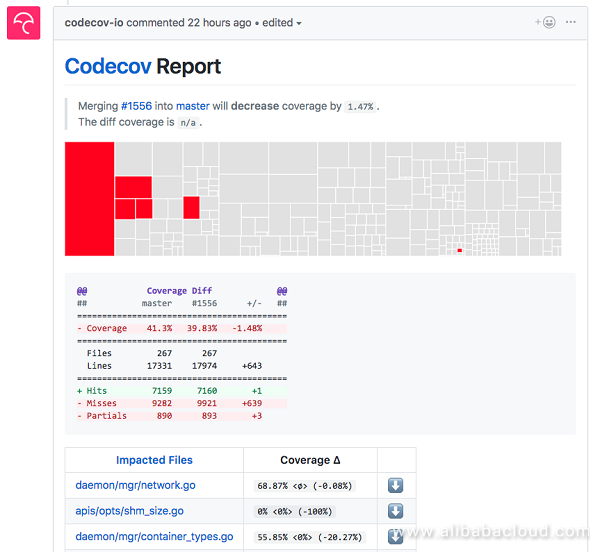
PouchContainer uses unit testing and integration testing to ensure code quality. When submitting PR, developers are required to provide corresponding code of unit testing and integration testing. This requirement ensures regression quality, reduces code review costs, and improves cooperation efficiency. PouchContainer uses go test to measure the coverage rates of unit testing and integration testing, and works with TravisCI and Codecov to run tests for every PR submission and display data about test coverage rates clearly. It is complex to measure the coverage rate of integration testing. This document describes how such measurement is done in PouchContainer.

Before introducing integration test coverage rate measurement, we need to understand the working of coverage rate measurement in Golang. In Golang, coverage rates are measured by overriding the package source code before compilation to add statistics and then compiling and executing the code. The following describes the specific execution process with reference to the preceding document.
Provide a tested Size() function with multiple switch branches. The code is as follows:
package size
func Size(a int) string {
  switch {
  case a < 0:
    return "negative"
  case a == 0:
    return "zero"
  case a < 10:
    return "small"
  }
  return "enormous"
}
The test code is as follows:
$ cat size_test.go
package size

import (
    "testing"
    "fmt"
)

type Test struct {
    in  int
    out string
}

var tests = []Test{
    {-1, "negative"},
    {5, "small"},
}

func TestSize(t *testing.T) {
    fmt.Println("a")
    for i, test := range tests {
        size := Size(test.in)
        if size != test.out {
            t.Errorf("#%d: Size(%d)=%s; want %s", i, test.in, size, test.out)
        }
    }
}
Run the go test -x -cover -coverprofile=./size.out command, perform a test, and measure the test coverage rate. The -x parameter prints the command execution process. Note that the printed steps are incomplete. If the printed steps are executed manually, the execution may fail because some steps of go test are not printed.
The -cover parameter enables the test coverage rate statistics function. The -coverprofile parameter indicates the file that stores the test coverage rate. The command output is as follows:
$ go test -x -cover -coverprofile=./size.out
WORK=/var/folders/d2/0gxc6wf16hb6t8ng0w00czpm0000gn/T/go-build982568783
mkdir -p $WORK/test/_test/
mkdir -p $WORK/test/_test/_obj_test/
cd $WORK/test/_test/_obj_test/
/usr/local/go/pkg/tool/darwin_amd64/cover -mode set -var GoCover_0 -o .size.go /Users/letty/work/code/go/src/test/size.go
cd /Users/letty/work/code/go/src/test
/usr/local/go/pkg/tool/darwin_amd64/compile -o $WORK/test/_test/test.a -trimpath $WORK -p test -complete -buildid 6033df309978241f19d83a0e6bad252ee3ba376e -D _/Users/letty/work/code/go/src/test -I $WORK -pack $WORK/test/_test/_obj_test/size.go ./size_test.go
cd $WORK/test/_test
/usr/local/go/pkg/tool/darwin_amd64/compile -o ./main.a -trimpath $WORK -p main -complete -D "" -I . -I $WORK -pack ./_testmain.go
cd .
/usr/local/go/pkg/tool/darwin_amd64/link -o $WORK/test/_test/test.test -L $WORK/test/_test -L $WORK -w -extld=clang -buildmode=exe $WORK/test/_test/main.a
$WORK/test/_test/test.test -test.coverprofile=./size.out -test.outputdir /Users/letty/work/code/go/src/test
a
PASS
coverage: 60.0% of statements
ok      test    0.006s
The last but one line of the command output shows that the test coverage rate is 60%. During the execution process of go test, the fifth line calls the /usr/local/go/pkg/tool/darwin_amd64/cover tool that overrides the tested source code and adds counters to the code to measure the test coverage rate. Lines 8 to 13 compile the file to be tested and the _testmain.go file (the latter file is generated by the go test tool; for implementation details, Click Here) to generate the test.test file. Line 13 executes the test.test file and inputs test parameters to run a test.
View the help information of the cover command and run the cover command again to view the overridden test code.
$ cat .size.go
package size

func Size(a int) string {
    GoCover_0.Count[0] = 1
    switch {
    case a < 0:
        GoCover_0.Count[2] = 1
        return "negative"
    case a == 0:
        GoCover_0.Count[3] = 1
        return "zero"
    case a < 10:
        GoCover_0.Count[4] = 1
        return "small"
    }
    GoCover_0.Count[1] = 1
    return "enormous"
}

var GoCover_0 = struct {
    Count     [5]uint32
    Pos       [3 * 5]uint32
    NumStmt   [5]uint16
} {
    Pos: [3 * 5]uint32{
        3, 4, 0x9001a, // [0]
        12, 12, 0x130002, // [1]
        5, 6, 0x14000d, // [2]
        7, 8, 0x10000e, // [3]
        9, 10, 0x11000e, // [4]
    },
    NumStmt: [5]uint16{
        1, // 0
        1, // 1
        1, // 2
        1, // 3
        1, // 4
    },
}
View the coverage rate statistics file when go test is complete. The information is as follows:
$ cat size.out
mode: set
test/size.go:3.26,4.9 1 1
test/size.go:12.2,12.19 1 0
test/size.go:5.13,6.20 1 1
test/size.go:7.14,8.16 1 0
test/size.go:9.14,10.17 1 1
The first line of the file indicates that the coverage rate statistics mode is set. The go test tool provides three statistics modes: set, count, and atomic. The set mode only checks whether statements are executed; the count mode counts the times of statement execution; and the atomic mode is similar to the count mode and applicable to multithread testing. The second line and subsequent lines are in the format of name.go:line.column,line.column numberOfStatements count, respectively indicating the file name, start position of code, lines occupied by statements, and times of statement execution. In the sample code, the tested statements occupy five lines, the statistics mode is set, and three counts are set to 1 (you can set covermode to count and view the change in the count output). The test coverage rate is 60%.
PouchContainer integrates the CodeCov tool to upload a statistics file on test coverage rates to the CodeCov website each time when TravisCI is executed for visual display and continuous tracking of test coverage rates. TravisCI and CodeCov are easy to integrate. A statistics file on test coverage rates can be uploaded after a file named coverage.txt is generated in the test path and the CodeCov script is called in the .travis.yml file. For related commands, see pouch. You can also view the CodeCov script for the implementation details. The following describes how to measure the coverage rates of unit testing and integration testing in PouchContainer.
In PouchContainer, you only need to run the go test cover command to measure the coverage rate of a unit test. To get the code used to measure the unit test coverage rate, go to pouch/hack/build and find the unit-test() function, which runs the unit test of each package and appends the measured test coverage rate to the coverage.txt file. Note that unrelated packages such as the vendor and types directories must be excluded during test coverage rate measurement; otherwise, the measurement may be inaccurate.
In PouchContainer integration testing, daemon APIs and command lines are tested by starting pouch daemon and running the pouch command or sending API requests. Normally, pouch daemon is compiled by go build. The test coverage rate cannot be measured because no counters are inserted into the source code.
For information about the PR used to measure the pouch daemon test coverage rate, Click Here. We complete the following operations in the PR:
go test file to the root directory.The following describes the implementation details. The following code adds the main_test.go test file and defines a test function TestMain in the file:
package main

import (
    "os"
    "os/signal"
    "strings"
    "syscall"
    "testing"
)

func TestMain(t *testing.T) {
    var (
        args []string
    )

    for _, arg := range os.Args {
        switch {
        case strings.HasPrefix(arg, "DEVEL"):
        case strings.HasPrefix(arg, "-test"):
        default:
            args = append(args, arg)
        }
    }

    waitCh := make(chan int, 1)

    os.Args = args
    go func() {
        main()
        close(waitCh)
    }()

    signalCh := make(chan os.Signal, 1)
    signal.Notify(signalCh, syscall.SIGINT, syscall.SIGQUIT, syscall.SIGTERM, syscall.SIGHUP)
    select {
    case <-signalCh:
        return
    case <-waitCh:
        return
    }
}
By adding the main_test.go file, we can use the existing go test tool to compile pouch daemon. When the following command is executed, go test compiles the package for the file whose name ends with _test in the current path, that is, the expected main package, and links to the main test program provided by go test (that is, the _testmain.go file) to generate an executable test file.
# go test -c -race -cover -covermode=atomic -o pouchd-test -coverpkg $pkgs$pkg indicates the name of the package that requires test coverage rate measurement. go test calls the cover tool to override the source code of the specified package and adds counters for test coverage rate measurement. The -o parameter indicates compiling without running and sets the binary test name to pouchd-test. The preceding command returns a binary test file that calls the main() function.
Start pouch-test to run the test code. The test code calls pouch daemon's entry function main() to start pouch daemon and provide services. The command is as follows:
# pouchd-test -test.coverprofile=$DIR/integrationcover.out DEVEL --debugThe parameter prefixed with -test is processed by go test, and the parameter following DEVEL is transferred to the main() function. The test cases are executed normally. After testing, kill the pouchd-test process. The go test tool prints the test coverage rate and generates a statistics file on the rate. The process of test coverage rate measurement ends.
The main_test.go file is essential for measuring the test coverage rate. The following analyzes the functions of this file.
The file defines the test function TestMain(), which is an entry function called when an executable test file is executed.
Lines 16 to 27 of the function performs parameter processing to filter the parameter prefixed with -test and the DEVEL parameter and assign the values of the remaining parameters to os.Args. By default, go test transfers the first parameter not prefixed with a dash - to the test function for processing. The main_test.go code filters parameters, assigns a new value to os.Args, and transfers parameters to the main() function so that daemon parameters can be used properly. Lines 28 to 31 call the main function to start the daemon service. Lines 33 and 40 receive the specified signal and exit directly. waitCh channel is defined to instruct the test function to exit when the main function exit to prevent the main function from calling itself, in which case the program will never exit.
For other methods to measure the integration test coverage rate, see Generating Coverage Profiles for Golang Integration Tests.
To measure the integration test coverage rate, you need to use the tools provided by Golang with flexibility, and adapt test files based on the characteristics of your project code. After measurement of integration test coverage rate is added, the coverage rate of PouchContainer increases from 18% (only for measurement of unit test coverage rate) to 40% to reflect the current test status more accurately.
PouchContainer with LXCFS for Highly Reliable Isolation of Containers

664 posts | 55 followers
FollowAlibaba System Software - August 14, 2018
Amber Wang - August 8, 2018
Alibaba System Software - August 8, 2018
Amber Wang - August 6, 2018
Alibaba Clouder - November 8, 2018
Alibaba System Software - November 29, 2018

664 posts | 55 followers
Follow ACK One
Provides a control plane to allow users to manage Kubernetes clusters that run based on different infrastructure resources
Learn More Container Registry
A secure image hosting platform providing containerized image lifecycle management
Learn More Architecture and Structure Design
Customized infrastructure to ensure high availability, scalability and high-performance
Learn More Container Service for Kubernetes
Alibaba Cloud Container Service for Kubernetes is a fully managed cloud container management service that supports native Kubernetes and integrates with other Alibaba Cloud products.
Learn MoreMore Posts by Alibaba Cloud Native Community