O LoongCollector coleta a saída padrão (stdout e stderr) e os arquivos de log de texto de contêineres Docker, agregando-os de vários nós em um único LogStore no Simple Log Service. A coleta centralizada elimina a necessidade de pesquisar logs de contêineres individuais nó por nó e permite análise estruturada, mascaramento de dados, filtragem, além de consultas e análises eficientes.
Requisitos
Antes de implantar o LoongCollector, verifique os seguintes requisitos e limites:
Requisitos de permissão: a conta Alibaba Cloud ou o usuário RAM usado na implantação deve ter a permissão
AliyunLogFullAccess.-
Requisitos do Docker e do LoongCollector:
Se a versão do seu Docker Engine for v29.0 ou posterior, ou se a versão mínima suportada da API do Docker for 1.42 ou posterior, utilize o LoongCollector 3.2.4 ou posterior. Caso contrário, o LoongCollector não conseguirá coletar a saída padrão do contêiner ou os logs de arquivo.
O LoongCollector 3.2.4 e posterior suporta as versões da API do Docker de 1.24 a 1.48.
O LoongCollector 3.2.3 e anteriores suporta as versões da API do Docker de 1.18 a 1.41.
-
Limitações na coleta de saída padrão:
Adicione
"log-driver": "json-file"ao arquivo de configuração do Docker daemon.json.No CentOS 7.4 ou posterior, exceto CentOS 8.0, defina
fs.may_detach_mounts=1.
-
Limitações na coleta de logs de texto: apenas os drivers de armazenamento overlay e overlay2 são suportados. Para outros drivers de armazenamento, monte o diretório de log manualmente.
Defina os itens abaixo antes de executar os comandos de implantação na Etapa 1, pois cada decisão está codificada nos comandos
docker pulledocker run: Imagem e região: a imagem que você baixará e o ID da região de origem.
Canal de upload de log: o tipo de transmissão de rede codificado pela variável
${sls_upload_channel}. Para comparar as opções de rede interna, Internet e aceleração de transferência, consulte a seção Apêndice: Tipos de transmissão de rede deste tópico.Identificador do grupo de máquinas: o identificador personalizado transmitido na variável
${user_defined_id}. O identificador deve ser exclusivo dentro da região e o grupo de máquinas deve usar o mesmo valor.
Fluxo de trabalho de configuração de coleta
A lista a seguir mapeia o fluxo de trabalho de coleta para as seções deste tópico:
Preparações: crie um projeto e um LogStore. Um projeto é uma unidade de gerenciamento de recursos que isola logs de diferentes aplicativos, e um LogStore armazena logs.
Etapa 1: Configurar um grupo de máquinas (instalar o LoongCollector): instale o LoongCollector nos servidores dos quais deseja coletar logs e adicione-os a um grupo de máquinas. Utilize o grupo de máquinas para gerenciar centralmente os nós de coleta, distribuir configurações e monitorar o status dos seus servidores.
-
Etapa 2: Criar e configurar uma regra de coleta de logs
Configuração global e de entrada: defina o nome da configuração de coleta, bem como a origem e o escopo da coleta de logs.
-
Processamento e estruturação de logs: configure regras de processamento com base no formato do log.
Logs multilinha: aplicável quando uma única entrada de log abrange várias linhas, como uma pilha de exceção Java ou um traceback Python. Use uma expressão regular de primeira linha para identificar a linha inicial de cada entrada.
Análise estruturada: configure um plugin de análise, como expressão regular, delimitador ou modo NGINX, para extrair pares chave-valor estruturados de strings brutas, facilitando consultas e análises.
Filtragem de logs (Data Filtering): configure uma lista de bloqueios de coleta e regras de filtragem de conteúdo para manter apenas o conteúdo útil do log e reduzir a transmissão e o armazenamento redundantes de dados.
Categorização de logs: configure tópicos e tags de log para distinguir flexivelmente logs de diferentes aplicativos, contêineres ou caminhos de origem.
Configuração de saída: mantenha os logs coletados no LogStore atual ou distribua-os para vários LogStores.
Etapa 3: Configurar consulta e análise (Query and Analysis Configurations): um índice de texto completo é ativado por padrão e suporta pesquisas por palavras-chave. Recomendamos ativar também um índice de campo para executar consultas e análises precisas em campos estruturados, melhorando a eficiência da pesquisa.
Etapa 4: Validação e solução de problemas: após concluir a configuração, verifique se os logs estão sendo coletados. Se encontrar problemas como ausência de dados coletados, falhas de heartbeat ou erros de análise, consulte as Perguntas frequentes.
Preparações
Antes de coletar logs, planeje e crie o projeto e o LogStore que gerenciarão e armazenarão seus logs. Se já possuir esses recursos, pule esta seção e vá para Etapa 1: Configurar um grupo de máquinas (instalar o LoongCollector).
Para criar um projeto
Faça login no console do Simple Log Service.
-
Clique em Create Project e configure os seguintes parâmetros:
Region: selecione uma região com base na localização das suas fontes de log. Não é possível alterar essa configuração após a criação.
Project Name: o nome deve ser globalmente exclusivo no Alibaba Cloud. Não é possível alterá-lo após a criação.
Mantenha as outras configurações com os valores padrão e clique em Create. Para mais informações sobre os outros parâmetros, consulte Criar um projeto.
Para criar um LogStore
Clique no nome do projeto para acessar o projeto de destino.
No painel de navegação à esquerda, escolha
 Logstores e clique em +.
-
Na página Create LogStore, preencha as seguintes configurações principais:
Logstore Name: insira um nome exclusivo dentro do projeto. Não é possível alterar o nome após a criação.
Logstore Type: selecione Standard ou Query com base na comparação de especificações.
-
Billing Mode:
Pay-by-feature (Cannot Be Changed): a cobrança é feita separadamente para cada recurso, como armazenamento, indexação e operações de leitura/gravação. Este modo é adequado para cenários de pequena escala ou onde o uso dos recursos ainda é incerto.
Pay-by-ingested-data: a cobrança ocorre apenas pelos dados brutos ingeridos. Este modo oferece 30 dias de armazenamento gratuito e recursos gratuitos, como transformação e envio de dados. É ideal para cenários de negócios com período de retenção próximo a 30 dias ou com pipelines complexos de processamento de dados.
Data Retention Period: especifique o número de dias para reter os logs. Valores válidos: 1 a 3.650. O valor 3.650 indica retenção permanente. Valor padrão: 30.
Mantenha as outras configurações com os valores padrão e clique em OK. Para mais informações sobre as outras configurações, consulte Gerenciar um LogStore.
Etapa 1: Configurar um grupo de máquinas (instalar o LoongCollector)
Implante o LoongCollector como um contêiner na máquina host Docker e adicione-o a um grupo de máquinas. Utilize o grupo de máquinas para gerenciar centralmente vários nós de coleta, distribuir configurações e monitorar o status.
1. Baixar a imagem
Em uma máquina host com Docker instalado, execute o seguinte comando para baixar a imagem do LoongCollector. Substitua ${region_id} pelo ID da região da região que hospeda a máquina host ou de uma região próxima, como cn-hangzhou, para melhorar a velocidade e a estabilidade do download.
# LoongCollector image address
docker pull aliyun-observability-release-registry.${region_id}.cr.aliyuncs.com/loongcollector/loongcollector:v3.0.12.0-25723a1-aliyun
# Logtail image address
docker pull registry.${region_id}.aliyuncs.com/log-service/logtail:v2.1.11.0-aliyun
2. Iniciar o contêiner do LoongCollector
Execute o seguinte comando para iniciar o contêiner. Certifique-se de montar os diretórios necessários e definir as variáveis de ambiente obrigatórias:
docker run -d \
    -v /:/logtail_host:ro \
    -v /var/run/docker.sock:/var/run/docker.sock \
    --env ALIYUN_LOGTAIL_CONFIG=/etc/ilogtail/conf/${sls_upload_channel}/ilogtail_config.json \
    --env ALIYUN_LOGTAIL_USER_ID=${aliyun_account_id} \
    --env ALIYUN_LOGTAIL_USER_DEFINED_ID=${user_defined_id} \
aliyun-observability-release-registry.${region_id}.cr.aliyuncs.com/loongcollector/loongcollector:v3.0.12.0-25723a1-aliyunPolítica de reinicialização do contêiner: ao iniciar o contêiner do LoongCollector, recomendamos especificar --restart=unless-stopped ou --restart=always para que o Docker reinicie automaticamente o contêiner após uma saída inesperada ou reinicialização do daemon do Docker. Caso contrário, se o contêiner for encerrado forçosamente por uma operação externa ou sair anormalmente, ele não será recuperado automaticamente. O contêiner perde sua capacidade de autorrecuperação e a coleta de logs é interrompida silenciosamente.
Parâmetros:
${aliyun_account_id}: o ID da sua conta Alibaba Cloud.${user_defined_id}: o identificador personalizado do grupo de máquinas, que vincula o contêiner ao grupo de máquinas, comouser-defined-docker-1. O identificador deve ser exclusivo dentro da região.${sls_upload_channel}: o canal de upload de log. O valor consiste na região que hospeda o projeto e no tipo de transmissão de rede, conforme descrito na tabela a seguir.
|
Tipo de transmissão |
Formato do valor |
Exemplo |
Scenario |
|
Rede interna |
|
|
A instância ECS e o projeto estão na mesma região. |
|
Internet |
|
|
A instância ECS e o projeto estão em regiões diferentes, ou o servidor pertence a outro provedor de cloud ou a um data center autogerenciado. |
|
Aceleração de transferência |
|
|
Comunicação entre regiões da China continental e outros países ou regiões. |
Para conhecer as características de rede de cada tipo de transmissão, consulte a seção Apêndice: Tipos de transmissão de rede deste tópico.
Condições necessárias para inicialização:
Configure corretamente as três variáveis de ambiente principais:
ALIYUN_LOGTAIL_CONFIG,ALIYUN_LOGTAIL_USER_IDeALIYUN_LOGTAIL_USER_DEFINED_ID.Monte
/var/run/docker.sockpara escutar eventos do ciclo de vida do contêiner.Monte
/em/logtail_hostpara acessar o sistema de arquivos da máquina host.
3. Verificar o status do contêiner
Execute o seguinte comando:
docker ps | grep loongcollectorA seguinte saída será retornada:
6ad510001753 aliyun-observability-release-registry.cn-beijing.cr.aliyuncs.com/loongcollector/loongcollector:v3.0.12.0-25723a1-aliyun "/usr/local/ilogtail…" About a minute ago Up About a minute recursing_shirley4. Configurar o grupo de máquinas
No painel de navegação à esquerda, escolha . Clique em  > Create Machine Group, configure os seguintes parâmetros e clique em OK:
Name: insira um nome personalizado para o grupo de máquinas, como
docker-host-group.Machine Group Identifier: selecione Custom Identifier.
Custom Identifier: insira o
${user_defined_id}definido ao iniciar o contêiner. Os valores devem ser idênticos. Caso contrário, a associação falhará.
5. Verificar o heartbeat do grupo de máquinas
Clique no nome do novo grupo de máquinas para acessar sua página de detalhes e verifique o Machine Group Status:
OK: o LoongCollector está conectado ao Simple Log Service.
FAIL: consulte o Resumo de problemas de heartbeat para solucionar o problema.
Etapa 2: Criar e configurar uma regra de coleta de logs
Defina quais logs o LoongCollector coletará, como ele analisará a estrutura do log e como filtrará o conteúdo e, em seguida, vincule a configuração a um grupo de máquinas registrado.
Na página
 LogStores, clique no ícone
  ao lado do nome do LogStore de destino para expandi-lo.
-
Clique no ícone
 ao lado de Import Data. Na caixa de diálogo Quick Data Import, selecione um modelo com base na sua fonte de log e clique em Integrate Now:
-
Saída padrão do Docker: selecione Docker Stdout and Stderr - New Version.
A coleta de saída padrão de contêineres suporta um modelo novo e um antigo. Recomendamos o modelo novo. Para了解 as diferenças entre as duas versões, consulte o Apêndice: Comparação das versões nova e antiga de saída padrão de contêineres. Para usar o modelo antigo, consulte Coletar saída padrão de contêineres Docker (versão antiga).
Os dois modelos também diferem no comportamento padrão de coleta: com o modelo novo, a saída padrão de um contêiner pode ser coletada por apenas uma configuração de coleta por padrão, enquanto o modelo antigo suporta coleta por múltiplas configurações sem necessidade de configuração extra. Para instruções sobre como remover essa restrição, consulte a seção de Perguntas Frequentes deste tópico.
Logs de arquivo do Docker: selecione Docker File - Container. 3. Configure as Machine Group Configurations e clique em Next:
Scenario: selecione Docker Containers.
Mova o grupo de máquinas criado na Etapa 1 da lista Source Machine Group para a lista Applied Machine Group à direita. 4. Na página Logtail Configuration, preencha as configurações descritas nas seções a seguir e clique em Next.
-
1. Configuração global e de entrada
Antes de começar, certifique-se de ter selecionado um modelo de importação de dados e vinculado um grupo de máquinas. Esta etapa define o nome da configuração de coleta, a fonte de log e o escopo da coleta.
Coletar saída padrão do Docker
Global Configurations
-
Configuration Name: insira um nome personalizado para a configuração de coleta. O nome deve ser exclusivo dentro do projeto e não pode ser alterado após a criação. Convenções de nomenclatura:
O nome pode conter apenas letras minúsculas, dígitos, hifens (-) e sublinhados (_).
O nome deve começar e terminar com uma letra minúscula ou um dígito.
Configuração de entrada
Ative a chave Stdout and Stderr ou a chave Standard Error. Ambas estão ativadas por padrão. Para manter os logs coletados em ordem, não colete a saída padrão e o erro padrão simultaneamente.
Coletar logs de texto de contêineres Docker
Global Configurations:
-
Configuration Name: insira um nome personalizado para a configuração de coleta. O nome deve ser exclusivo dentro do projeto e não pode ser alterado após a criação. Convenções de nomenclatura:
O nome pode conter apenas letras minúsculas, dígitos, hifens (-) e sublinhados (_).
O nome deve começar e terminar com uma letra minúscula ou um dígito.
Input Configurations:
-
File Path Type:
Path in Container: colete arquivos de log dentro do contêiner.
Host Path: colete logs de serviço local na máquina host.
-
File Path: o caminho absoluto para coleta de logs.
Linux: o caminho começa com uma barra (/), como
/data/mylogs/**/*.log, que indica todos os arquivos com extensão .log no diretório/data/mylogs.Windows: o caminho começa com uma letra de unidade, como
C:\Program Files\Intel\**\*.Log.
Maximum Directory Monitoring Depth: a profundidade máxima de diretório correspondida pelo curinga
**no File Path. Valor padrão: 0, que indica apenas o diretório atual. Valores válidos: 0 a 1000. Recomendamos definir este parâmetro como 0 e configurar o caminho até o diretório que contém os arquivos.
2. Processamento e estruturação de logs
Configure regras de processamento de logs para converter logs brutos não estruturados em dados estruturados e melhorar a eficiência de consultas e análises. Recomendamos adicionar primeiro uma amostra de log:
Na página Logtail Configuration, na seção Processor Configurations, clique em Add Sample Log e insira o conteúdo do log que deseja coletar. O Simple Log Service identifica o formato do log a partir da amostra e ajuda a gerar expressões regulares e regras de análise, simplificando a configuração.
Cenário 1: Processar logs multilinha, como logs de pilha Java
Logs como pilhas de exceção Java e JSON geralmente abrangem várias linhas. No modo de coleta padrão, eles são divididos em várias entradas incompletas e o contexto é perdido. Para evitar isso, ative o modo multilinha e configure uma expressão regular de primeira linha para mesclar linhas consecutivas do mesmo log em uma única entrada completa.
Exemplo:
|
Log bruto |
Modo de coleta padrão: cada linha é um log separado, a pilha é dividida e o contexto é perdido |
Modo multilinha: uma expressão regular de primeira linha identifica o log completo e preserva a estrutura semântica integral |
|
```log |
||
|
[2025-11-13T10:52:20,557] [ERROR] java.sql.SQLException: No suitable driver found for jdbc:mysql://db.host:3306/prod_db |
||
|
at com.datastore.util.DataProcessor.save(DataProcessor.java:434) |
||
|
at io.awesomeapp.util.PaymentGateway.fetchData(PaymentGateway.java:463) |
||
|
at org.awesomeapp.util.UserService.processRequest(UserService.java:252) |
||
|
at io.datastore.service.DatabaseConnector.fetchData(DatabaseConnector.java:172) |
||
|
at org.datastore.service.UserService.fetchData(UserService.java:517) |
||
|
``` |
|
|


Procedimento: na página Logtail Configuration, na seção Processor Configurations, ative o Multi-line Mode:
-
Type: selecione Custom ou Multi-line JSON.
-
Custom: o formato dos logs brutos não é fixo. Configure uma Regex to Match First Line para identificar a linha inicial de cada log.
-
Regex to Match First Line: gere a expressão automaticamente ou insira-a manualmente. A expressão regular deve corresponder a uma linha completa. No exemplo anterior, a expressão é
\[\d+-\d+-\w+:\d+:\d+,\d+]\s\[\w+]\s.*.Geração automática: clique em Automatically Generate Regular Expression, selecione o conteúdo do log que deseja extrair na caixa de texto Log Sample e clique em Generate Regular Expression.
Entrada manual: clique em Manually Enter Regular Expression. Após inserir a expressão, clique em Validate.
-
Multi-line JSON: se todos os logs brutos estiverem no formato JSON padrão, o Simple Log Service lidará automaticamente com as quebras de linha dentro de um único log JSON.
-
-
Processing Method If Splitting Fails:
Discard: se um segmento de texto não corresponder à regra de primeira linha, o segmento será descartado.
Retain Single Line: o texto não correspondido é dividido e retido no modo original de linha única.
Cenário 2: Estruturar logs
Quando os logs brutos são textos não estruturados ou semiestruturados, como logs de acesso NGINX ou logs de saída de aplicativos, consultá-los e analisá-los diretamente é ineficiente. O Simple Log Service fornece vários plugins de análise de dados que convertem automaticamente logs brutos em diferentes formatos em dados estruturados, oferecendo uma base sólida para análises, monitoramento e alertas subsequentes.
Exemplo:
|
Log bruto |
Log após análise estruturada |
|
|
```plaintext |
||
|
192.168.. - - [15/Apr/2025:16:40:00 +0800] "GET /nginx-logo.png HTTP/1.1" 0.000 514 200 368 "-" "Mozilla/5.0 (Windows NT 10.0; Win64; x64) AppleWebKit/537.36 (KHTML, like Gecko) Chrome/131.0.. Safari/537.36" |
||
|
|
`plaintext |
|
|
body_bytes_sent: 368 |
||
|
http_referer: - |
||
|
http_user_agent : Mozilla/5.0 (Windows NT 10.0; Win64; x64) AppleWebKit/537.36 (KHTML, like Gecko) Chrome/131.0.x.x Safari/537.36 |
||
|
remote_addr:192.168.. |
||
|
remote_user: - |
||
|
request_length: 514 |
||
|
request_method: GET |
||
|
request_time: 0.000 |
||
|
request_uri: /nginx-logo.png |
||
|
status: 200 |
||
|
time_local: 15/Apr/2025:16:40:00 |
||
|
``` |
Procedimento: na página Logtail Configuration, na seção Processor Configurations:
-
Adicionar um plugin de análise: clique em Add Processor e configure um plugin como análise de expressão regular, análise de delimitador ou análise JSON com base no formato real. Para os parâmetros de cada plugin, consulte a seção Apêndice: Plugins de análise nativos deste tópico. O exemplo a seguir coleta logs NGINX, portanto selecione .
-
NGINX Log Configuration: copie a definição completa do
log_formatdo arquivo de configuração do servidor NGINX (nginx.conf) e cole-a nesta caixa de texto. Exemplo:log_format main '$remote_addr - $remote_user [$time_local] "$request" ''$request_time $request_length ''$status $body_bytes_sent "$http_referer" ''"$http_user_agent"';Deve ser exatamente igual ao formato que gera os logs no servidor. Caso contrário, a análise do log falhará.
-
-
Parâmetros gerais de configuração: os seguintes parâmetros aparecem em vários plugins de análise de dados e possuem a mesma função e uso.
Campo de origem: o nome do campo de origem a ser analisado. Valor padrão:
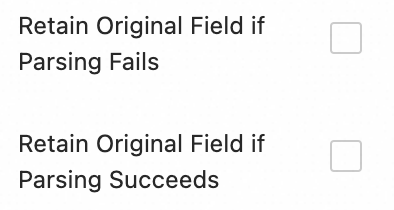
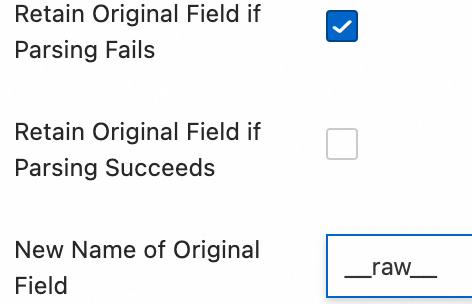
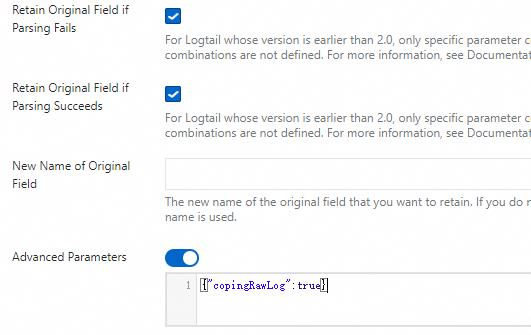
content, que representa todo o conteúdo do log coletado.Manter campo de origem em caso de falha na análise: recomendamos ativar esta opção. Se um plugin não conseguir analisar um log, por exemplo, devido a incompatibilidade de formato, esta opção mantém o conteúdo bruto completo do log no campo de origem especificado, em vez de descartá-lo.
Manter campo de origem em caso de sucesso na análise: se selecionar esta opção, o conteúdo bruto do log será retido mesmo quando o log for analisado com sucesso.
3. Filtragem de logs
A coleta de grandes volumes de logs com baixo valor ou irrelevantes, como logs DEBUG ou INFO, desperdiça recursos de armazenamento, aumenta custos, reduz a eficiência das consultas e gera riscos de vazamento de dados. Utilize políticas de filtragem refinadas para garantir uma coleta de logs eficiente e segura.
A filtragem é configurada em dois locais no console: a filtragem de conteúdo atua como um plugin de processamento na seção Processor Configurations, enquanto a lista de bloqueios de coleta e a filtragem de contêineres funcionam como alternadores na seção Input Configurations.
Reduza custos com filtragem de conteúdo
Filtre pelo campo de conteúdo do log; por exemplo, colete apenas logs cujo nível seja WARNING ou ERROR.
Exemplo:
|
Log bruto |
Coletar apenas logs WARNING ou ERROR |
|
|
```shell |
||
|
{"level":"WARNING","timestamp":"2025-09-23T19:11:40+0800","cluster":"yilu-cluster-0728","message":"Disk space is running low","freeSpace":"15%"} |
||
|
{"level":"ERROR","timestamp":"2025-09-23T19:11:42+0800","cluster":"yilu-cluster-0728","message":"Failed to connect to database","errorCode":5003} |
||
|
{"level":"INFO","timestamp":"2025-09-23T19:11:47+0800","cluster":"yilu-cluster-0728","message":"User logged in successfully","userId":"user-123"} |
||
|
|
`shell |
|
|
{"level":"WARNING","timestamp":"2025-09-23T19:11:40+0800","cluster":"yilu-cluster-0728","message":"Disk space is running low","freeSpace":"15%"} |
||
|
{"level":"ERROR","timestamp":"2025-09-23T19:11:42+0800","cluster":"yilu-cluster-0728","message":"Failed to connect to database","errorCode":5003} |
||
|
``` |
Procedimento: Na página Logtail Configuration, na seção Processor Configurations, clique em Add Processor e selecione :
Field Name: O campo de log a ser filtrado.
Field Value: A expressão regular usada para filtragem. Apenas correspondência de texto completo é suportada. Não há suporte para correspondência parcial de palavras-chave.
Controle o escopo de coleta com uma lista de bloqueios
Utilize uma lista de bloqueios para excluir diretórios ou arquivos específicos e impedir o upload de logs irrelevantes ou sensíveis.
Procedimento: Na página Logtail Configuration, na seção , ative a opção Collection Blacklist e clique em Add.
Nomes de diretórios e arquivos aceitam correspondência exata e correspondência com curingas. Os únicos curingas suportados são o asterisco (*) e o ponto de interrogação (?).
-
File Path Blacklist: Os caminhos de arquivo a serem ignorados. Exemplos:
/home/admin/private*.log: Ignora durante a coleta todos os arquivos no diretório/home/admin/que começam com private e terminam com .log./home/admin/private*/*_inner.log: Ignora durante a coleta arquivos que terminam com _inner.log em diretórios que começam com private dentro do diretório/home/admin/.
-
File Blacklist: Os nomes de arquivo a serem ignorados durante a coleta. Exemplo:
app_inner.log: Ignora durante a coleta todos os arquivos chamadosapp_inner.log.
-
Directory Blacklist: O caminho do diretório não pode terminar com barra (/). Exemplos:
/home/admin/dir1/: A lista de bloqueios de diretórios não entra em vigor./home/admin/dir*: Ignora durante a coleta arquivos em todos os subdiretórios que começam com dir dentro do diretório/home/admin/./home/admin/*/dir: Ignora durante a coleta todos os arquivos em subdiretórios de segundo nível chamados dir dentro do diretório/home/admin/. Por exemplo, arquivos no diretório/home/admin/a/dirsão ignorados, e arquivos no diretório/home/admin/a/b/dirsão coletados.
Filtragem de contêineres
Defina condições de coleta com base nos metadados do contêiner, como variáveis de ambiente, rótulos de Pod, namespaces e nomes de contêineres, para controlar com precisão quais logs de contêiner serão coletados.
Procedimento: Na página Logtail Configuration, na seção Input Configurations, ative a opção Container Filtering e clique em Add.
Múltiplas condições são combinadas com um AND lógico. Toda correspondência de expressão regular baseia-se no mecanismo Go RE2, que é mais limitado que mecanismos como PCRE. Escreva suas expressões regulares de acordo com o Apêndice: Limitações de expressões regulares (filtragem de contêineres).
As seguintes condições aplicam-se a contêineres Docker:
Lista de bloqueios/permissões de variáveis de ambiente: Especifica as condições de variáveis de ambiente dos contêineres dos quais os logs devem ser coletados.
-
Lista de bloqueios/permissões de rótulos de contêiner: Coleta logs de contêineres cujos rótulos atendem às condições. Use este parâmetro em cenários Docker. Não recomendamos seu uso em cenários Kubernetes.
As seguintes condições aplicam-se a contêineres gerenciados pelo Kubernetes:
Lista de bloqueios/permissões de rótulos de Pod do Kubernetes: Especifica as condições de rótulos dos Pods que hospedam os contêineres dos quais os logs devem ser coletados.
Correspondência de expressão regular de nome de Pod do Kubernetes: Especifica os contêineres dos quais coletar logs pelo nome do Pod.
Correspondência de expressão regular de namespace do Kubernetes: Especifica os contêineres dos quais coletar logs pelo nome do namespace.
Correspondência de expressão regular de nome de contêiner do Kubernetes: Especifica os contêineres dos quais coletar logs pelo nome do contêiner.
4. Categorização de logs
Quando várias aplicações ou instâncias compartilham o mesmo formato de log, torna-se difícil distinguir as fontes, o que deixa as consultas sem contexto e reduz a eficiência da análise. Para resolver isso, configure tópicos e tags de log para associação automática de contexto e categorização lógica.
Configure um tópico
Quando várias aplicações ou instâncias produzem logs no mesmo formato, mas em caminhos diferentes, como /apps/app-A/run.log e /apps/app-B/run.log, os logs coletados tornam-se difíceis de rastrear até sua origem. Nesse caso, gere um tópico com base no grupo de máquinas, em um nome personalizado ou na extração do caminho do arquivo para distinguir flexivelmente logs de diferentes aplicações ou caminhos de origem.
Procedimento:: Selecione como o tópico é gerado. Três tipos são suportados:
Tópico de grupo de máquinas: Quando uma configuração de coleta é aplicada a vários grupos de máquinas, o LoongCollector envia automaticamente o nome do grupo de máquinas ao qual o servidor pertence como o campo
__topic__. Este tipo é adequado para cenários em que os logs são divididos por cluster de hosts.Custom: O formato é
customized://<custom_topic_name>, comocustomized://app-login. Este tipo é adequado para cenários de tópicos estáticos com um identificador de aplicação fixo.-
Extração de caminho de arquivo: Extrai informações essenciais do caminho completo do arquivo de log para marcar dinamicamente a origem do log. Ideal para cenários onde múltiplos usuários ou aplicações compartilham o mesmo nome de arquivo de log em caminhos diferentes.
Quando vários usuários ou serviços gravam logs em diretórios de nível superior diferentes, mas os caminhos e nomes de arquivo de nível inferior são idênticos, apenas o nome do arquivo não consegue distinguir a origem. Por exemplo:
/data/logs
├── userA
│   └── serviceA
│       └── service.log
├── userB
│   └── serviceA
│       └── service.log
└── userC
    └── serviceA
        └── service.log
Nesse caso, configure File Path Extraction e use uma expressão regular para extrair informações essenciais do caminho completo. O resultado correspondente é enviado ao LogStore como o tópico.
Regras de extração: grupos de captura na expressão regular
Ao configurar a expressão regular, o Simple Log Service determina o formato do campo de saída com base no número e na nomenclatura dos grupos de captura, conforme descrito na tabela a seguir. Em uma expressão regular para caminho de arquivo, você deve escapar a barra (/).
|
Tipo de grupo de captura |
Scenario |
Campo gerado |
Exemplo de expressão regular |
Exemplo de caminho correspondente |
Exemplo de campo gerado |
|
Grupo de captura único (apenas um |
Apenas uma dimensão é necessária para distinguir a origem, como nome de usuário ou ambiente. |
Gera o campo |
|
|
|
|
Múltiplos grupos de captura sem nome (múltiplos |
Várias dimensões são necessárias, mas rótulos semânticos não. |
Gera o campo de tag |
|
|
|
|
Múltiplos grupos de captura nomeados (usando |
Várias dimensões são necessárias e os nomes dos campos devem ser autoexplicativos para facilitar consultas e análises. |
Gera o campo de tag |
|
|
|
Tags de log
Ative o enriquecimento de tags de log para extrair informações essenciais de variáveis de ambiente do contêiner ou rótulos de Pod do Kubernetes e anexá-las como tags para agrupamento refinado de logs.
Procedimento: Na página Logtail Configuration, na seção Input Configurations, ative a opção Log Tag Enrichment e clique em Add.
-
Environment Variables: Configure um nome de variável de ambiente e um nome de tag. O valor da variável de ambiente é armazenado sob o nome da tag.
Nome da variável de ambiente: O nome da variável de ambiente a ser extraída.
Nome da tag: O nome da tag da variável de ambiente.
-
Pod Labels: Configure um nome de rótulo de Pod e um nome de tag. O valor do rótulo de Pod é armazenado sob o nome da tag.
Nome do rótulo de Pod: O nome do rótulo de Pod do Kubernetes a ser extraído.
Nome da tag: O nome da tag.
5. Configuração de saída
Por padrão, todos os logs são enviados ao LogStore atual com compressão lz4. Para distribuir logs da mesma origem para diferentes LogStores, execute as etapas a seguir.
Distribuição dinâmica para múltiplos destinos
O envio para múltiplos destinos requer LoongCollector 3.0.0 ou posterior. O Logtail não suporta este recurso.
É possível configurar no máximo cinco destinos de saída.
-
Após configurar múltiplos destinos de saída, a configuração de coleta deixa de aparecer na lista de configurações de coleta do LogStore atual. Para visualizar, modificar ou excluir uma configuração de distribuição multi-destino, consulte Como gerenciar configurações de distribuição multi-destino?.
Procedimento: Na página Logtail Configuration, na seção Output Configurations:
Clique em
 para expandir a configuração de saída.
-
Clique em Add Output Targets e preencha as seguintes configurações:
Logstores: Selecione o LogStore de destino.
Compression Method: lz4 e zstd são suportados.
-
Route Settings: Roteia e distribui logs com base em seus campos de tag. Logs que atendem à configuração de roteamento são enviados ao LogStore de destino. Se a configuração de roteamento estiver vazia, todos os logs coletados serão enviados ao LogStore de destino.
-
Tag Name: O nome do campo de tag usado para roteamento. Insira o nome do campo diretamente, como
__path__, sem o prefixo__tag__:. Os campos de tag dividem-se nas duas categorias a seguir:Relacionados ao agente: Referem-se ao próprio agente de coleta e independem de plugins, como
__hostname__e__user_defined_id__.-
Relacionados a plugins de entrada: Fornecidos por um plugin de entrada, que enriquece os logs com informações relacionadas, como
__path__para coleta de arquivos e_pod_name_e_container_name_para coleta no Kubernetes.Para mais informações sobre tags, consulte Gerenciar tags de coleta.
Tag Value: Logs cujo valor do campo de tag corresponde a este valor são enviados ao LogStore de destino.
Discard this tag?: Se você ativar esta opção, os logs enviados não conterão este campo de tag.
-
Etapa 3: Configurar consulta e análise
Após concluir o processamento de logs e a configuração de plugins, clique em Next para acessar a página Query and Analysis Configurations:
Um índice de texto completo é ativado por padrão e suporta buscas por palavras-chave no conteúdo bruto do log.
-
Para executar consultas precisas por campo, aguarde até que os Preview Data carreguem na página e clique em Automatic Index Generation. O Simple Log Service gera um índice de campo com base na primeira entrada dos dados de visualização.
Após concluir a configuração, clique em Next para finalizar toda a configuração de coleta.
Etapa 4: Validação e solução de problemas
Depois de concluir a configuração de coleta e aplicá-la a um grupo de máquinas, o Simple Log Service distribui automaticamente a configuração e inicia a coleta de logs incrementais.
Visualizar logs enviados
Confirme se o arquivo de log tem novo conteúdo: O LoongCollector coleta apenas logs incrementais. Execute
tail -f /path/to/your/log/filee acione uma operação na aplicação para garantir que novos logs estejam sendo gravados.Consultar logs: Acesse a página de consulta e análise do LogStore de destino e clique em Search & Analyze. O intervalo de tempo padrão são os últimos 15 minutos. Verifique se novos logs estão chegando. Por padrão, cada log de texto de contêiner Docker coletado contém os seguintes campos:
|
Campo |
Descrição |
|
|
O endereço IP do contêiner LoongCollector (Logtail). |
|
|
O endereço IP do contêiner da aplicação. |
|
|
O nome da máquina host Docker que executa o LoongCollector (Logtail). |
|
|
O caminho de coleta de logs. |
|
|
O momento em que o log chegou ao lado do servidor. |
|
|
O identificador personalizado do grupo de máquinas. |
Para os nomes de campos de metadados usados pela saída padrão de contêineres, consulte a seção Apêndice: Comparação das versões nova e antiga da saída padrão de contêineres deste tópico.
Solucionar problemas comuns
O heartbeat do grupo de máquinas está FAIL
Verificar o identificador de usuário
Se o seu servidor não for uma instância ECS, ou se a instância ECS e o projeto pertencerem a contas Alibaba Cloud diferentes, use os métodos a seguir para verificar se o identificador de usuário correto existe no diretório especificado:
Linux: Execute o comando
cd /etc/ilogtail/users/ && touch <uid>para criar o arquivo de identificador de usuário.-
Windows: Acesse o diretório
C:\LogtailData\users\e crie um arquivo vazio chamado<uid>.Se existir um arquivo com o nome do ID da conta Alibaba Cloud proprietária do projeto atual no caminho especificado, o identificador de usuário está configurado corretamente.
Verificar o identificador do grupo de máquinas
Se você usar um grupo de máquinas baseado em identificador personalizado, verifique se o arquivo user_defined_id existe no diretório especificado. Caso exista, confirme se seu conteúdo é igual ao identificador personalizado configurado para o grupo de máquinas.
|
Sistema |
Diretório especificado |
Solução |
|
Linux |
|
```shell |
Configure o identificador personalizado. Se o diretório não existir, crie-o manualmente.
echo "user-defined-1" > /etc/ilogtail/user_defined_id | | Windows | C:\LogtailData\user_defined_id | No diretório C:\LogtailData , crie um arquivo user_defined_id` e grave o identificador personalizado nele. Se o diretório não existir, crie-o manualmente. |
Se tanto o identificador de usuário quanto o identificador do grupo de máquinas estiverem configurados corretamente, consulte Solucionar problemas de grupo de máquinas do LoongCollector (Logtail) para obter mais orientações.
Nenhum dado de log foi coletado
Verificar logs incrementais: Após configurar a coleta do LoongCollector (Logtail), nenhum arquivo de log será coletado se não houver novos logs gravados nele.
Verificar o status de heartbeat do grupo de máquinas: Acesse a página Resource Group > Machine Groups, clique no nome do grupo de máquinas de destino e verifique o status de Heartbeat na seção Machine Group Configurations > Machine Group Status.
Se o heartbeat estiver OK, o grupo de máquinas está conectado ao projeto do Simple Log Service.
Se o heartbeat estiver FAIL, consulte O heartbeat do grupo de máquinas está FAIL para solucionar o problema.
Confirmar se a configuração de coleta do LoongCollector (Logtail) está aplicada ao grupo de máquinas: Mesmo que a configuração de coleta do LoongCollector (Logtail) tenha sido criada, os logs não serão coletados até que você aplique a configuração a um grupo de máquinas.
Acesse a página Resource Group > Machine Groups e clique no nome do grupo de máquinas de destino para ir à página Machine Group Configurations.
Na página, verifique a opção Manage Configuration. A lista All Logtail Configurations aparece à esquerda e a lista Applied Logtail Configs aparece à direita. Se a configuração de coleta do LoongCollector (Logtail) de destino tiver sido movida para a área aplicada à direita, a configuração estará aplicada ao grupo de máquinas de destino.
Caso a configuração de coleta do LoongCollector (Logtail) de destino não tenha sido movida para a área aplicada à direita, clique em Modify, selecione o nome da configuração do LoongCollector (Logtail) de destino na lista All Logtail Configurations à esquerda, clique em
 para movê-la para a área aplicada à direita e clique em OK.
Erros de coleta de logs ou erros de formato
Abordagem de solução de problemas: Esta situação indica que a conexão de rede e a configuração básica estão funcionando, e que o problema reside em uma incompatibilidade entre o conteúdo do log e as regras de análise. Verifique a mensagem de erro específica para localizar o problema:
Na página Logtail Configuration, clique no nome da configuração do LoongCollector (Logtail) que relata erros de coleta. Na aba Log Collection Error, clique em Select Time Range para definir o período da consulta.
Na seção Collection Exception Monitoring > Complete Error Information, verifique o tipo de alerta do log de erro e encontre a solução correspondente em Tipos comuns de erros na coleta de dados.
Comandos comuns
Visualizar o status de execução do LoongCollector (Logtail)
Execute o seguinte comando:
docker exec ${logtail_container_id} /etc/init.d/ilogtaild statusVisualizar a versão, endereço IP, hora de início e outras informações do LoongCollector (Logtail)
Execute o seguinte comando:
docker exec ${logtail_container_id} cat /usr/local/ilogtail/app_info.jsonVisualizar os logs operacionais do LoongCollector (Logtail)
Os logs operacionais do LoongCollector (Logtail) são armazenados no diretório /usr/local/ilogtail/ dentro do contêiner. O nome do arquivo é ilogtail.LOG, e os arquivos rotacionados são compactados e armazenados como ilogtail.LOG.x.gz. Exemplo:
# View the operational logs of LoongCollector

docker exec a287de895e40 tail -n 5 /usr/local/ilogtail/loongcollector.LOG

# View the operational logs of Logtail

docker exec a287de895e40 tail -n 5 /usr/local/ilogtail/ilogtail.LOG
A seguinte saída é retornada:
[2025-08-25 09:17:44.610496]    [info]  [22]    /build/loongcollector/file_server/polling/PollingModify.cpp:75          polling modify resume:succeeded
[2025-08-25 09:17:44.610497]    [info]  [22]    /build/loongcollector/file_server/polling/PollingDirFile.cpp:100                polling discovery resume:starts
[2025-08-25 09:17:44.610498]    [info]  [22]    /build/loongcollector/file_server/polling/PollingDirFile.cpp:103                polling discovery resume:succeeded
[2025-08-25 09:17:44.610499]    [info]  [22]    /build/loongcollector/file_server/FileServer.cpp:117            file server resume:succeeded
[2025-08-25 09:17:44.610500]    [info]  [22]    /build/loongcollector/file_server/EventDispatcher.cpp:1019              checkpoint dump:succeeded
Reiniciar o LoongCollector (Logtail)
Execute os seguintes comandos:
# Stop LoongCollector

docker exec a287de895e40 /etc/init.d/ilogtaild stop

# Start LoongCollector

docker exec a287de895e40 /etc/init.d/ilogtaild start
Perguntas frequentes
Mensagens de erro comuns
|
Sintoma |
Causa |
Solução |
|
|
A região do projeto não corresponde à região do contêiner LoongCollector (Logtail). |
Verifique a configuração de região em |
|
|
O caminho do arquivo está configurado incorretamente. |
Confirme se o caminho do log no contêiner da aplicação corresponde à configuração de coleta. |
Log de erro: The parameter is invalid : uuid=none
Descrição do problema: O arquivo de log do LoongCollector (Logtail) (/usr/local/ilogtail/ilogtail.LOG) contém o log de erro The parameter is invalid : uuid=none.
Solução: Na máquina host, crie um arquivo product_uuid, insira qualquer UUID válido nele, como 169E98C9-ABC0-4A92-B1D2-AA6239C0D261, e monte o arquivo no diretório /sys/class/dmi/id/product_uuid no contêiner LoongCollector (Logtail).
Como coletar o mesmo arquivo de log ou saída padrão de contêiner com múltiplas configurações de coleta?
Por padrão, para evitar dados duplicados, o Simple Log Service permite que cada origem de log seja coletada por apenas uma configuração de coleta:
Um arquivo de log de texto pode ser correspondido por apenas uma configuração de coleta Logtail.
Saída padrão de contêiner (stdout):
Se você usar o novo modelo de saída padrão, a saída poderá ser coletada por apenas uma configuração de coleta de saída padrão por padrão.
-
Se você usar o modelo antigo de saída padrão, a coleta por múltiplas configurações é suportada por padrão e não requer configuração extra.
Para permitir que a mesma origem de log seja coletada por múltiplas configurações de coleta, execute as etapas a seguir:
Faça login no console do Simple Log Service e acesse o projeto de destino.
No painel de navegação à esquerda, escolha
LogStores e localize o LogStore de destino.Clique no ícone
ao lado do nome para expandir o LogStore.Clique em Logtail Configuration, localize a configuração Logtail de destino na lista de configurações e clique em Manage Logtail Configuration na coluna Actions.
Na página de configuração do Logtail, clique em Edit e role para baixo até a seção Input Configurations: - Para coletar logs de arquivos de texto: Ative Allow File to Be Collected for Multiple Times. - Para coletar saída padrão de contêiner: Ative Allow Collection by Different Logtail Configurations.
Como gerenciar configurações de distribuição multi-destino?
Como uma configuração de distribuição multi-destino está associada a vários LogStores, você deve manter esse tipo de configuração na página de gerenciamento no nível do projeto:
Faça login no console do Simple Log Service e clique no nome do projeto de destino.
-
Na página do projeto de destino, no painel de navegação à esquerda, clique em
 Resource Group > Configurations.
Esta página gerencia centralmente todas as configurações de coleta no projeto, incluindo configurações remanescentes após a exclusão acidental de um LogStore.
Apêndice: Plugins de análise nativos
Na página Logtail Configuration, dentro da seção Processor Configurations, adicione plugins de processamento para estruturar logs brutos. Para incluir um plugin de processamento em uma configuração de coleta existente, siga os passos abaixo:
No painel de navegação à esquerda, escolha
 LogStores e localize o LogStore desejado.
Clique no ícone
 ao lado do nome para expandir o LogStore.
Clique em Logtail Configuration, encontre a configuração do Logtail desejada na lista e clique em Manage Logtail Configuration na coluna Actions.
-
Na página de configuração do Logtail, clique em Edit.
Esta seção aborda apenas os plugins de processamento comuns, que atendem aos cenários típicos de processamento de logs. Para conhecer mais recursos, consulte Plugins de processamento estendidos.
Regras para combinação de plugins (aplicável ao LoongCollector / Logtail 2.0 e versões posteriores):
Use plugins de processamento nativos e estendidos de forma independente ou combine-os conforme necessário.
Priorize os plugins de processamento nativos, pois oferecem melhor desempenho e maior estabilidade.
Caso os recursos nativos não atendam às suas necessidades de negócio, adicione plugins de processamento estendidos após os plugins nativos já configurados para realizar um processamento complementar.
Restrição de ordem:
Todos os plugins formam uma cadeia de processamento e são executados na ordem em que foram configurados. Atenção: Todos os plugins de processamento nativos devem preceder qualquer plugin de processamento estendido. Após adicionar um plugin de processamento estendido, não é possível inserir novos plugins de processamento nativos.
Análise por expressão regular
Extrai campos de log por meio de uma expressão regular e converte o log em pares chave-valor, permitindo que cada campo seja consultado e analisado individualmente.
Exemplo:
|
Log bruto |
Resultado do plugin de análise por expressão regular |
|
|
```plaintext |
||
|
127.0.0.1 - - [16/Aug/2024:14:37:52 +0800] "GET /wp-admin/admin-ajax.php?action=rest-nonce HTTP/1.1" 200 41 "http://www.example.com/wp-admin/post-new.php?post_type=page" "Mozilla/5.0 (Windows NT 10.0; Win64; x64) AppleWebKit/537.36 (KHTML, like Gecko) Chrome/127.0.0.0 Safari/537.36 Edg/127.0.0.0" |
||
|
|
`plaintext |
|
|
body_bytes_sent: 41 |
||
|
http_referer: http://www.example.com/wp-admin/post-new.php?post_type=page |
||
|
http_user_agent: Mozilla/5.0 (Windows NT 10.0; Win64; x64) AppleWebKit/537.36 (KHTML, like Gecko) Chrome/127.0.0.0 Safari/537.36 Edg/127.0.0.0 |
||
|
remote_addr: 127.0.0.1 |
||
|
remote_user: - |
||
|
request_method: GET |
||
|
request_protocol: HTTP/1.1 |
||
|
request_uri: /wp-admin/admin-ajax.php?action=rest-nonce |
||
|
status: 200 |
||
|
time_local: 16/Aug/2024:14:37:52 +0800 |
||
|
``` |
Procedimento: Na página Logtail Configuration, na seção Processor Configurations, clique em Add Processor e selecione Native Processor > Data Parsing (Regex Mode):
Regular Expression: Expressão utilizada para corresponder aos logs. É possível gerá-la automaticamente ou inseri-la manualmente:
-
Geração automática:
Clique em Automatically Generate Regular Expression.
Na seção Log Sample, destaque o conteúdo do log que deseja extrair.
-
Clique em Generate Regular Expression.
Verifique se o conteúdo do log colado na seção Log Sample está no formato correto, como um log de acesso Apache Combined, e clique em Generate Regular Expression nessa seção para gerar a expressão de análise automaticamente. - Entrada manual: Insira manualmente uma expressão regular com base no formato do log.
Após concluir a configuração, clique em Validate para testar se a expressão regular analisa corretamente o conteúdo do log. - Extracted Field: Defina um nome de campo (Key) para cada trecho de conteúdo de log extraído (Value). - Para detalhes sobre os demais parâmetros, consulte os parâmetros gerais de configuração descritos em Cenário 2: Estruturar logs.
Análise por delimitador
Estrutura o conteúdo do log usando um delimitador e o converte em múltiplos pares chave-valor. Há suporte para delimitadores de caractere único e de múltiplos caracteres.
Exemplo:
|
Log bruto |
Campos divididos pelo caractere , especificado |
|
|
```plaintext |
||
|
05/May/2025:13:30:28,10.10..,"POST /PutData?Category=YunOsAccountOpLog&AccessKeyId=&Date=Fri%2C%2028%20Jun%202013%2006%3A53%3A30%20GMT&Topic=raw&Signature=**** HTTP/1.1",200,18204,aliyun-sdk-java |
||
|
|
`plaintext |
|
|
ip:10.10.. |
||
|
request:POST /PutData?Category=YunOsAccountOpLog&AccessKeyId=&Date=Fri%2C%2028%20Jun%202013%2006%3A53%3A30%20GMT&Topic=raw&Signature=**** HTTP/1.1 |
||
|
size:18204 |
||
|
status:200 |
||
|
time:05/May/2025:13:30:28 |
||
|
user_agent:aliyun-sdk-java |
||
|
``` |
Procedimento: Na página Logtail Configuration, na seção Processor Configurations, clique em Add Processor e selecione Native Processor > Data Parsing (Delimiter Mode):
Delimiter: Especifique o caractere usado para dividir o conteúdo do log. Exemplo: Para um arquivo CSV, selecione Custom e insira uma vírgula (,).
Quote: Caso o valor de um campo contenha o delimitador, especifique um caractere de aspas para envolver o campo e evitar divisões incorretas.
Extracted Field: Defina um nome de campo (Key) para cada coluna, respeitando a ordem de divisão. As seguintes regras se aplicam:
O nome do campo pode conter apenas letras, dígitos e sublinhados (_).
Deve começar com uma letra ou um sublinhado (_).
Comprimento máximo: 128 bytes.
Para informações sobre os demais parâmetros, consulte os parâmetros gerais de configuração descritos em Cenário 2: Estruturar logs.
Análise de JSON padrão
Estrutura um log JSON do tipo Object e o converte em pares chave-valor.
Exemplo:
|
Log bruto |
Extração automática de pares chave-valor JSON padrão |
|
|
```json |
||
|
{"url": "POST /PutData?Category=YunOsAccountOpLog&AccessKeyId=U0Ujpek****&Date=Fri%2C%2028%20Jun%202013%2006%3A53%3A30%20GMT&Topic=raw&Signature=pD12XYLmGxKQ%2Bmkd6x7hAgQ7b1c%3D HTTP/1.1", "ip": "10.200.98.220", "user-agent": "aliyun-sdk-java", "request": {"status": "200", "latency": "18204"}, "time": "05/Jan/2025:13:30:28"} |
||
|
|
`plaintext |
|
|
ip: 10.200.98.220 |
||
|
request: {"status": "200", "latency" : "18204" } |
||
|
time: 05/Jan/2025:13:30:28 |
||
|
url: POST /PutData?Category=YunOsAccountOpLog&AccessKeyId=U0Ujpek&Date=Fri%2C%2028%20Jun%202013%2006%3A53%3A30%20GMT&Topic=raw&Signature=pD12XYLmGxKQ%2Bmkd6x7hAgQ7b1c%3D HTTP/1.1 |
||
|
user-agent:aliyun-sdk-java |
||
|
``` |
Procedimento: Na página Logtail Configuration, na seção Processor Configurations, clique em Add Processor e selecione Native Processor > Data Parsing (JSON Mode):
Original Field: Valor padrão: content. Este campo armazena o conteúdo bruto do log a ser analisado.
Para informações sobre os demais parâmetros, consulte os parâmetros gerais de configuração descritos em Cenário 2: Estruturar logs.
Análise de JSON aninhado
Converte um log JSON aninhado em pares chave-valor mediante a especificação de uma profundidade de expansão.
Exemplo:
|
Log bruto |
Profundidade de expansão: 0, com a profundidade de expansão como prefixo |
Profundidade de expansão: 1, com a profundidade de expansão como prefixo |
|
|
```json |
|||
|
{"s_key":{"k1":{"k2":{"k3":{"k4":{"k51":"51","k52":"52"},"k41":"41"}}}}} |
|||
|
|
`plaintext |
||
|
0_s_key_k1_k2_k3_k41:41 |
|||
|
0_s_key_k1_k2_k3_k4_k51:51 |
|||
|
0_s_key_k1_k2_k3_k4_k52:52 |
|||
|
|
`plaintext |
||
|
1_s_key:{"k1":{"k2":{"k3":{"k4":{"k51":"51","k52":"52"},"k41":"41"}}}} |
|||
|
``` |
Procedimento: Na página Logtail Configuration, na seção Processor Configurations, clique em Add Processor e selecione :
Original Field: Nome do campo original a ser expandido, como
content.JSON Expansion Depth: Nível de expansão do objeto JSON. O valor 0 indica expansão total (valor padrão), o valor 1 indica o nível atual, e assim por diante.
Character to Concatenate Expanded Keys: Caractere utilizado para concatenar os nomes dos campos durante a expansão do JSON. Valor padrão: sublinhado (_).
Name Prefix of Expanded Keys: Prefixo dos nomes dos campos após a expansão do JSON.
-
Expand Array: Ative esta opção para expandir um array em pares chave-valor com índices. Exemplo:
{"k":["a","b"]}é expandido para{"k[0]":"a","k[1]":"b"}.Para renomear um campo expandido, por exemplo, alterar prefix_s_key_k1 para new_field_name, adicione posteriormente um plugin Rename Fields para concluir o mapeamento.
Para informações sobre os demais parâmetros, consulte os parâmetros gerais de configuração descritos em Cenário 2: Estruturar logs.
Análise de array JSON
Utilize a json_extractfunção para extrair objetos JSON de um array JSON.
Exemplo:
|
Log bruto |
Estrutura de array JSON extraída |
|
|
```json |
||
|
[{"key1":"value1"},{"key2":"value2"}] |
||
|
|
`plaintext |
|
|
json1:{"key1":"value1"} |
||
|
json2:{"key2":"value2"} |
||
|
``` |
Procedimento: Na página Logtail Configuration, na seção Processor Configurations, alterne o Processing Method para SPL, configure a SPL statement e use a função json_extract para extrair objetos JSON do array JSON.
Exemplo: Extraia os elementos do array JSON do campo de log content e armazene os resultados nos novos campos json1 e json2.
* | extend json1 = json_extract(content, '$[0]'), json2 = json_extract(content, '$[1]')Análise de log Apache
Estrutura o conteúdo do log com base nas definições do arquivo de configuração de log do Apache e o converte em múltiplos pares chave-valor.
Exemplo:
|
Log bruto |
Análise com o Apache Common Log Format combined |
|
|
```plaintext |
||
|
1 192.168.1.10 - - [08/May/2024:15:30:28 +0800] "GET /index.html HTTP/1.1" 200 1234 "https://www.example.com/referrer" "Mozilla/5.0 (Windows NT 10.0; Win64; x64) AppleWebKit/537.36 (KHTML, like Gecko) Chrome/123.0.X.X Safari/537.36" |
||
|
|
`plaintext |
|
|
http_referer:https://www.example.com/referrer |
||
|
http_user_agent:Mozilla/5.0 (Windows NT 10.0; Win64; x64) AppleWebKit/537.36 (KHTML, like Gecko) Chrome/123.0.X.X Safari/537.36 |
||
|
remote_addr:192.168.1.10 |
||
|
remote_ident:- |
||
|
remote_user:- |
||
|
request_method:GET |
||
|
request_protocol:HTTP/1.1 |
||
|
request_uri:/index.html |
||
|
response_size_bytes:1234 |
||
|
status:200 |
||
|
time_local:[08/May/2024:15:30:28 +0800] |
||
|
``` |
Procedimento: Na página Logtail Configuration, na seção Processor Configurations, clique em Add Processor e selecione :
Log Format: combined
APACHE LogFormat Configuration: O Simple Log Service preenche essa configuração automaticamente com base no Log Format. Verifique se o conteúdo preenchido automaticamente é idêntico ao LogFormat definido no arquivo de configuração do Apache em seu servidor, geralmente localizado em /etc/apache2/apache2.conf.
Para informações sobre os demais parâmetros, consulte os parâmetros gerais de configuração descritos em Cenário 2: Estruturar logs.
Mascaramento de dados
Mascara dados sensíveis nos logs.
Exemplo:
|
Log bruto |
Resultado do mascaramento |
|
|
```plaintext |
||
|
[{'account':'1812213231432969','password':'04a23f38'}, {'account':'1812213685634','password':'123a'}] |
||
|
|
`plaintext |
|
|
[{'account':'1812213231432969','password':''}, {'account':'1812213685634','password':''}] |
||
|
``` |
Procedimento: Na página Logtail Configuration, na seção Processor Configurations, clique em Add Processor e selecione :
Original Field: Campo original que armazena o conteúdo do log antes da análise.
-
Data Masking Method:
const: Substitui o conteúdo sensível pela string especificada.
md5: Substitui o conteúdo sensível pelo seu valor MD5.
Replacement String: Se você definir o Data Masking Method como const, insira a string usada para substituir o conteúdo sensível.
Content Expression that Precedes Replaced Content: Localiza o conteúdo sensível. Configure-o com a sintaxe RE2.
Content Expression to Match Replaced Content: Expressão do conteúdo sensível. Configure-a com a sintaxe RE2.
Análise de tempo
Analisa o campo de tempo no log e define o resultado da análise como o campo __time__ do log.
Exemplo:
|
Log bruto |
Análise de tempo |
|
```shell |
|
|
{"level":"INFO","timestamp":"2025-09-23T19:11:47+0800","cluster":"yilu-cluster-0728","message":"User logged in successfully","userId":"user-123"} |
|
|
``` |
Analisa o valor de tempo do campo |
Procedimento: Na página Logtail Configuration, na seção Processor Configurations, clique em Add Processor e selecione Native Processor > Time Parsing:
Original Field: Campo original que armazena o conteúdo do log antes da análise.
Time Format: Defina o formato de tempo correspondente com base no conteúdo de tempo presente no log.
Time Zone: Selecione o fuso horário do campo de tempo no log. Por padrão, utiliza-se o fuso horário da máquina, que corresponde ao fuso horário do ambiente onde o processo LoongCollector (Logtail) está hospedado.
Apêndice: Limitações de expressões regulares (filtragem de contêineres)
As expressões regulares usadas para filtragem de contêineres baseiam-se no mecanismo Go RE2, que apresenta algumas limitações de sintaxe em comparação a outros mecanismos, como o PCRE. Observe os pontos abaixo ao escrever expressões regulares:
-
Diferenças na sintaxe de grupos nomeados
O Go utiliza a sintaxe
(?P<name>...)para definir um grupo nomeado e não oferece suporte à sintaxe(?<name>...)do PCRE.
Exemplo correto:
(?P<year>\d{4})-
Exemplo incorreto:
(?<year>\d{4})2. Recursos de expressão regular não suportadosOs seguintes recursos de expressão regular, embora comuns e complexos, não estão disponíveis no RE2. Não os utilize:
Lookarounds:
(?=...),(?!...),(?<=...),(?<!...)Condicionais:
(?(condition)true|false)Recursão:
(?R),(?0)Referências de sub-rotina:
(?&name),(?P>name)-
Grupos atômicos:
(?>...)3. RecomendaçõesAo depurar expressões regulares com ferramentas como Regex101, selecione o modo Golang (RE2) para validá-las e garantir compatibilidade. Se você utilizar qualquer sintaxe não suportada, o plugin não conseguirá analisar ou corresponder à sua expressão corretamente.
Apêndice: Comparação entre as versões nova e antiga da saída padrão de contêineres
Para melhorar a eficiência de armazenamento e a consistência da coleta, o formato de metadados de log para a saída padrão de contêineres foi atualizado. O novo formato consolida os metadados sob o campo __tag__, o que otimiza o armazenamento e padroniza o formato.
Principais vantagens da nova saída padrão
Desempenho significativamente aprimorado
Reescrita em C++, a nova versão oferece uma melhoria de desempenho de 180% a 300% em relação à implementação anterior em Go.
Suporta processamento de dados com plugins nativos e processamento paralelo multithread, aproveitando totalmente os recursos do sistema.
Permite combinações flexíveis de plugins nativos e plugins Go para atender às necessidades de cenários complexos.
Maior confiabilidade
Oferece suporte a uma fila de rotação para logs de saída padrão e unifica o mecanismo de coleta de logs com o mecanismo de coleta de arquivos, proporcionando alta confiabilidade quando os logs de saída padrão sofrem rotação rápida.
Menor consumo de recursos
O uso de CPU é reduzido em 20% a 25%.
O uso de memória é reduzido em 20% a 25%.
Consistência operacional aprimorada
Configuração de parâmetros unificada: Os parâmetros de configuração do novo plugin de coleta de saída padrão são consistentes com os do plugin de coleta de arquivos.
Gerenciamento de metadados unificado: A nomenclatura dos campos de metadados do contêiner e o local de armazenamento das tags são unificados com o cenário de coleta de arquivos, permitindo que o lado do consumidor mantenha apenas um conjunto de lógica de processamento.
Comparação de recursos entre as versões nova e antiga
|
Recurso |
Versão antiga |
Versão nova |
|
Método de armazenamento |
Os metadados são incorporados ao conteúdo do log como campos comuns. |
Os metadados são consolidados sob a tag |
|
Eficiência de armazenamento |
Cada entrada de log carrega uma cópia completa dos metadados, consumindo mais espaço de armazenamento. |
Múltiplas entradas de log no mesmo contexto podem reutilizar os metadados, economizando custos de armazenamento. |
|
Consistência de formato |
O formato é inconsistente com o formato de coleta de arquivos de contêiner. |
A nomenclatura dos campos e a estrutura de armazenamento estão totalmente alinhadas com a coleta de arquivos de contêiner, proporcionando uma experiência unificada. |
|
Método de acesso à consulta |
É possível consultar metadados diretamente pelo nome do campo, como |
É necessário acessar o par chave-valor correspondente através de |
Mapeamento de campos de metadados do contêiner
|
Nome do campo antigo |
Nome do campo novo |
|
|
|
|
|
|
|
|
|
|
|
|
|
|
|
|
|
|
Na nova versão, todos os campos de metadados são armazenados na seção de tags do log no formato __tag__:<key>, em vez de serem incorporados ao conteúdo do log.
Impacto da nova versão nos usuários
Adaptação do lado do consumidor: Como o local de armazenamento muda do conteúdo para a tag, ajuste sua lógica de consumo de logs adequadamente. Por exemplo, acesse os campos através de
__tag__ao executar uma consulta.Compatibilidade com SQL: As consultas SQL já são automaticamente compatíveis com ambas as versões, portanto, não é necessário modificar suas instruções de consulta para processar logs de nenhuma das versões.
Apêndice: Tipos de transmissão de rede
Parâmetros globais
Parâmetros globais
|
Parâmetro |
Descrição |
|
Nome da configuração |
Nome da configuração do Logtail. Deve ser exclusivo dentro do seu Project. Não é possível alterar o nome após a criação da configuração do Logtail. |
|
Tipo de tópico de log |
Define como o tópico do log é gerado. As opções incluem Machine Group Topic, File Path Extraction e Custom. |
|
Parâmetros avançados |
Parâmetros avançados opcionais para a configuração global. Criar uma configuração de pipeline do Logtail. |
Parâmetros de entrada
Parâmetros do processador
|
Parâmetro |
Descrição |
|
Amostra de log |
Uma amostra do log que você deseja coletar. Use uma amostra de log do seu caso de uso real. A amostra ajuda a configurar os parâmetros de processamento com mais facilidade. Você pode adicionar várias amostras. O comprimento total não pode exceder 1.500 caracteres. |
|
Modo multilinha |
|
|
Modo de processamento |
Processors, que inclui o Native Processor e o Extended Processor. Para obter mais informações sobre processadores, consulte Usar processadores nativos e estendidos. Importante
Para limitações de uso do processador, consulte os avisos no console.
|
Regiões
Faça login no console do Simple Log Service. Na lista de projetos, clique no projeto de destino.
Clique no ícone
 ao lado do nome do projeto para acessar a página de visão geral do projeto.
-
Na seção Basic Information, visualize o nome da região do projeto atual. A tabela a seguir mapeia os nomes das regiões para seus respectivos Region IDs.
Uma região é a localização geográfica do data center físico de um serviço de cloud . Um Region ID é o seu identificador exclusivo.
Nome da região
Region ID
China (Qingdao)
cn-qingdao
China (Beijing)
cn-beijing
China (Zhangjiakou)
cn-zhangjiakou
China (Hohhot)
cn-huhehaote
China (Ulanqab)
cn-wulanchabu
China (Hangzhou)
cn-hangzhou
China (Shanghai)
cn-shanghai
China (Nanjing - Local Region - Decommissioning)
cn-nanjing
China (Fuzhou - Local Region - Decommissioning)
cn-fuzhou
China (Shenzhen)
cn-shenzhen
China (Heyuan)
cn-heyuan
China (Guangzhou)
cn-guangzhou
Philippines (Manila)
ap-southeast-6
South Korea (Seoul)
ap-northeast-2
Malaysia (Kuala Lumpur)
ap-southeast-3
Japan (Tokyo)
ap-northeast-1
Thailand (Bangkok)
ap-southeast-7
China (Chengdu)
cn-chengdu
Singapore
ap-southeast-1
Indonesia (Jakarta)
ap-southeast-5
China (Hong Kong)
cn-hongkong
Germany (Frankfurt)
eu-central-1
US (Virginia)
us-east-1
US (Silicon Valley)
us-west-1
UK (London)
eu-west-1
UAE (Dubai)
me-east-1
SAU (Riyadh)
me-central-1
|
Tipo de rede |
Tipo de nome de domínio |
Descrição |
Scenario |
|
Rede interna Alibaba Cloud |
Nome de domínio privado |
A rede interna da Alibaba Cloud é uma rede compartilhada gigabit. Transferir dados de log pela rede interna da Alibaba Cloud é mais rápido e estável do que transferi-los pela Internet. A rede interna inclui VPCs e a rede clássica. |
A instância ECS e o projeto do Simple Log Service estão na mesma região, ou o servidor está conectado a uma VPC através do Express Connect. Recomendamos criar o projeto do Simple Log Service na região que hospeda a instância ECS e coletar logs da instância ECS pela rede interna da Alibaba Cloud, o que não consome largura de banda da Internet. |
|
Internet |
Nome de domínio público |
A transferência de dados de log pela Internet é limitada pela largura de banda da rede. Instabilidade na rede, latência e perda de pacotes também podem afetar a velocidade e a estabilidade da coleta de dados. |
É possível transferir dados pela Internet em dois casos: a instância ECS e o projeto do Simple Log Service estão em regiões diferentes, ou o servidor pertence a outro provedor de cloud ou a um data center autogerenciado. |
|
Aceleração de transferência |
Nome de domínio de aceleração de transferência |
Este método acelera a coleta de logs com nós de borda do Alibaba Cloud CDN. Oferece vantagens significativas sobre a coleta baseada na Internet em termos de latência e estabilidade da rede, mas o tráfego é cobrado separadamente. |
Se o seu servidor de aplicativos e o projeto do Simple Log Service estiverem em uma região da China continental e em uma região fora da China continental, respectivamente, a transferência de dados pela Internet pode causar alta latência de rede e transmissão instável. Nesse caso, você pode usar a aceleração de transferência. Para obter mais informações, consulte Aceleração de transferência. |
Próximas etapas
Visualização de dados: Acompanhe as tendências das principais métricas em painéis de visualização.
Alertas automáticos para anomalias de dados: Configure uma política de alerta para detectar anomalias do sistema em tempo real.