標準的な Kubernetes の負荷分散は、GPU のキャッシュ状態やキューの深さを考慮せず、単純なラウンドロビンやランダム選択によって大規模言語モデル (LLM) の推論リクエストを分散します。これにより、レプリカ間で KV キャッシュの使用率に偏りが生じ、冗長な計算が増加し、レスポンスレイテンシーが悪化します。Gateway with Inference Extension は、リアルタイムの推論サーバーメトリックに基づいて各リクエストを最適なレプリカにルーティングすることで、この問題を解決します。
このトピックでは、Container Service for Kubernetes (ACK) マネージドクラスターに Gateway with Inference Extension をデプロイし、InferencePool と InferenceModel を使用して推論を意識したルーティングを設定し、負荷テストと Grafana ダッシュボードを使用して改善を検証する方法を説明します。
仕組み

ゲートウェイは、異なるルーティング動作を持つ 2 つのポートを公開します:
ポート 8080 — 標準の HTTPRoute。リクエストは、標準の負荷分散を使用してバックエンドの vLLM サービスに直接送信されます。
ポート 8081 — 推論を意識した HTTPRoute。リクエストは推論サービス拡張機能 (LLM ルート) を通過します。この拡張機能は、リクエストキューの長さと GPU キャッシュの使用率に基づいて最適なレプリカを選択し、バックエンドに転送します。
InferencePool は、どの Pod が推論バックエンドを構成するかを宣言します。InferenceModel は、受信したモデル名をそのプール内のルーティングポリシーにマッピングします。リクエストがポート 8081 に到着すると、拡張機能は各 Pod からライブメトリックを読み取り、そのリクエストを効率的に処理するための最も容量のあるレプリカを選択します。
基本概念
| リソース | 説明 |
|---|---|
| InferencePool | LLM 推論 Pod のセットを単一のアドレス指定可能なバックエンドにグループ化する Kubernetes CRD。HTTPRoute の backendRef として、プレーンな Service の代わりに使用されます。 |
| InferenceModel | 受信したモデル名を InferencePool 内のトラフィック分散ポリシーにマッピングする Kubernetes CRD。 |
| Gateway with Inference Extension | エンドポイントピッカー (EPP) を Envoy Gateway データプレーンに埋め込む ACK コンポーネント。EPP は Pod ごとの vLLM メトリックを収集し、推論を意識した負荷分散を適用します。 |
| KV キャッシュ | vLLM が過去のコンテキストの再計算を避けるために GPU メモリに保存するリクエストごとのキーバリュー状態。同じプレフィックスを持つリクエストを同じ Pod にルーティングすることで、KV キャッシュの再利用を最大化し、レイテンシーを削減します。 |
前提条件
開始する前に、以下を確認してください:
(オプション) ACK Pro クラスターで Alibaba Cloud Container Compute Service (ACS) の GPU コンピューティング能力を使用するために、ACK Virtual Node コンポーネントがインストールされていること
ステップ 1: サンプル推論サービスのデプロイ
次の内容で
vllm-service.yamlという名前のファイルを作成します。YAML の表示GPU カードについては、ACK クラスターには A10 カードを、ACS の GPU コンピューティング能力には GN8IS (第 8 世代 GPU B) カードを使用してください。LLM イメージはサイズが大きいため、事前に Container Registry に転送し、内部ネットワーク経由でプルすることを推奨します。パブリックネットワーク経由でのプル速度は、クラスターの EIP 帯域幅に依存し、遅くなる可能性があります。
推論サービスをデプロイします。
kubectl apply -f vllm-service.yaml
ステップ 2: Gateway with Inference Extension コンポーネントのインストール
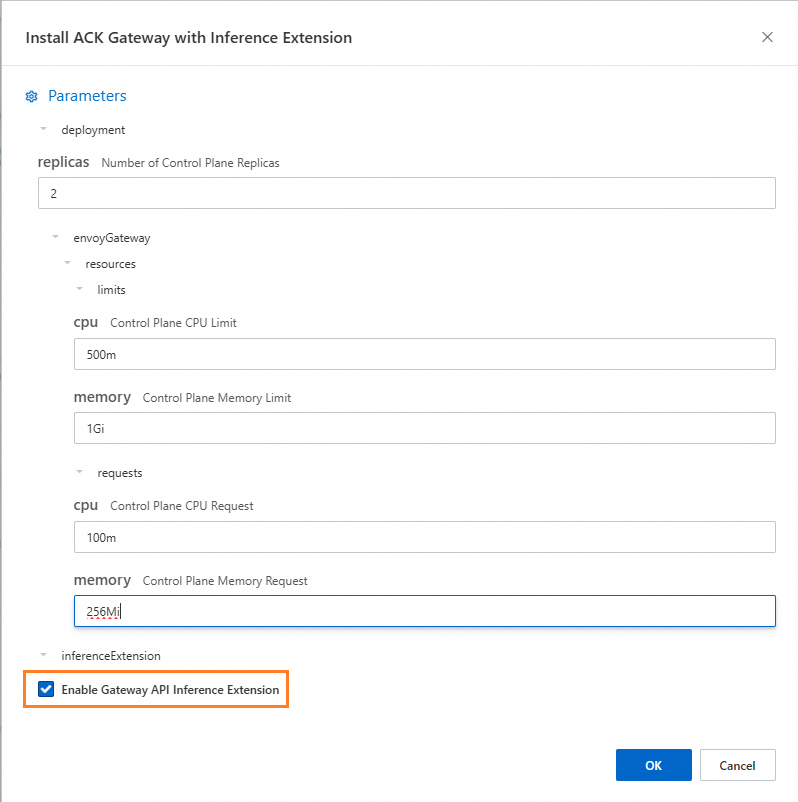
ACK Gateway with Inference Extension コンポーネントをインストールし、[Gateway API 推論拡張機能を有効にする] を選択します。
ステップ 3: 推論ルーティングのデプロイ
このステップでは、推論バックエンドとそのルーティングポリシーを定義する InferencePool および InferenceModel リソースを作成します。
inference-pool.yamlという名前のファイルを作成します。apiVersion: inference.networking.x-k8s.io/v1alpha2 kind: InferencePool metadata: name: vllm-qwen-pool spec: targetPortNumber: 8000 selector: app: qwen extensionRef: name: inference-gateway-ext-proc --- apiVersion: inference.networking.x-k8s.io/v1alpha2 kind: InferenceModel metadata: name: inferencemodel-qwen spec: modelName: /model/qwen criticality: Critical poolRef: group: inference.networking.x-k8s.io kind: InferencePool name: vllm-qwen-pool targetModels: - name: /model/qwen weight: 100ルーティングリソースを適用します。
kubectl apply -f inference-gateway-llm.yaml
ステップ 4: ゲートウェイのデプロイと検証
このステップでは、標準の HTTP ルーティング用のポート 8080 と、推論を意識したルーティング用のポート 8081 の 2 つのリスナーを持つゲートウェイを作成します。
inference-gateway.yamlという名前のファイルを作成します。apiVersion: gateway.networking.k8s.io/v1 kind: GatewayClass metadata: name: qwen-inference-gateway-class spec: controllerName: gateway.envoyproxy.io/gatewayclass-controller --- apiVersion: gateway.networking.k8s.io/v1 kind: Gateway metadata: name: qwen-inference-gateway spec: gatewayClassName: qwen-inference-gateway-class listeners: - name: http protocol: HTTP port: 8080 - name: llm-gw protocol: HTTP port: 8081 --- apiVersion: gateway.networking.k8s.io/v1 kind: HTTPRoute metadata: name: qwen-backend spec: parentRefs: - name: qwen-inference-gateway sectionName: llm-gw rules: - backendRefs: - group: inference.networking.x-k8s.io kind: InferencePool name: vllm-qwen-pool matches: - path: type: PathPrefix value: / --- apiVersion: gateway.networking.k8s.io/v1 kind: HTTPRoute metadata: name: qwen-backend-no-inference spec: parentRefs: - group: gateway.networking.k8s.io kind: Gateway name: qwen-inference-gateway sectionName: http rules: - backendRefs: - group: "" kind: Service name: qwen port: 8000 weight: 1 matches: - path: type: PathPrefix value: / --- apiVersion: gateway.envoyproxy.io/v1alpha1 kind: BackendTrafficPolicy metadata: name: backend-timeout spec: timeout: http: requestTimeout: 1h targetRef: group: gateway.networking.k8s.io kind: Gateway name: qwen-inference-gatewayゲートウェイをデプロイします。
kubectl apply -f inference-gateway.yamlこれにより、クラスター内に
envoy-gateway-system名前空間とenvoy-default-inference-gateway-645xxxxxという名前の Service が作成されます。ゲートウェイのパブリック IP アドレスを取得します。
export GATEWAY_HOST=$(kubectl get gateway/qwen-inference-gateway -o jsonpath='{.status.addresses[0].value}')ポート 8080 での標準 HTTP ルーティングを検証します。
curl -X POST ${GATEWAY_HOST}:8080/v1/chat/completions \
  -H 'Content-Type: application/json' \
  -d '{
    "model": "/model/qwen",
    "max_completion_tokens": 100,
    "temperature": 0,
    "messages": [
      {
        "role": "user",
        "content": "批評家になったつもりで書いてください:サンフランシスコ"
      }
    ]
  }'
期待される出力:
{"id":"chatcmpl-aa6438e2-d65b-4211-afb8-ae8e76e7a692","object":"chat.completion","created":1747191180,"model":"/model/qwen","choices":[{"index":0,"message":{"role":"assistant","reasoning_content":null,"content":"San Francisco, a city that has long been a beacon of innovation, culture, and diversity, continues to captivate the world with its unique charm and character. As a critic, I find myself both enamored and occasionally perplexed by the city's multifaceted personality.\n\nSan Francisco's architecture is a testament to its rich history and progressive spirit. The iconic cable cars, Victorian houses, and the Golden Gate Bridge are not just tourist attractions but symbols of the city's enduring appeal. However, the","tool_calls":[]},"logprobs":null,"finish_reason":"length","stop_reason":null}],"usage":{"prompt_tokens":39,"total_tokens":139,"completion_tokens":100,"prompt_tokens_details":null},"prompt_logprobs":null}ポート 8081 での推論を意識したルーティングを検証します。
curl -X POST ${GATEWAY_HOST}:8081/v1/chat/completions \
  -H 'Content-Type: application/json' \
  -d '{
    "model": "/model/qwen",
    "max_completion_tokens": 100,
    "temperature": 0,
    "messages": [
      {
        "role": "user",
        "content": "批評家になったつもりで書いてください:ロサンゼルス"
      }
    ]
  }'
期待される出力:
{"id":"chatcmpl-cc4fcd0a-6a66-4684-8dc9-284d4eb77bb7","object":"chat.completion","created":1747191969,"model":"/model/qwen","choices":[{"index":0,"message":{"role":"assistant","reasoning_content":null,"content":"Los Angeles, the sprawling metropolis often referred to as \"L.A.,\" is a city that defies easy description. It is a place where dreams are made and broken, where the sun never sets, and where the line between reality and fantasy is as blurred as the smog that often hangs over its valleys. As a critic, I find myself both captivated and perplexed by this city that is as much a state of mind as it is a physical place.\n\nOn one hand, Los","tool_calls":[]},"logprobs":null,"finish_reason":"length","stop_reason":null}],"usage":{"prompt_tokens":39,"total_tokens":139,"completion_tokens":100,"prompt_tokens_details":null},"prompt_logprobs":null}
(オプション) ステップ 5: 可観測性メトリックとダッシュボードの設定
このステップには Managed Service for Prometheus が必要であり、追加料金が発生する場合があります。
Prometheus メトリック収集の有効化
ステップ 1 の vllm-service.yaml には、Prometheus インスタンスのデフォルトのサービス検出を有効にするための次のアノテーションがすでに含まれています:
annotations:
  prometheus.io/path: /metrics      # vLLM がメトリックを公開するパス
  prometheus.io/port: "8000"        # vLLM サーバーのリッスンポート
  prometheus.io/scrape: "true"      # この Pod のスクレイプを有効にする
スクレイプが有効になると、次の vLLM メトリックが利用可能になります:
| メトリック | 内容 |
|---|---|
vllm:gpu_cache_usage_perc | Pod ごとに使用中の GPU KV キャッシュの割合。値が低いほど、新しいリクエストに対する余裕があることを意味します。 |
vllm:request_queue_time_seconds_sum | vLLM スケジューラがリクエストを処理する前に待機している時間。値が高い場合は、Pod が過負荷であることを示します。 |
vllm:num_requests_running / vllm:num_requests_waiting / vllm:num_requests_swapped | 実行中、待機中、スワップ済みの各状態におけるリアルタイムのリクエスト負荷。 |
vllm:avg_generation_throughput_toks_per_s / vllm:avg_prompt_throughput_toks_per_s | デコードおよびプレフィル段階でのトークン生成レート。 |
vllm:time_to_first_token_seconds_bucket | リクエストの送信から最初のトークンが返されるまでのレイテンシー。これは主要なユーザーエクスペリエンスメトリックです。 |
これらのメトリックにアラートルールを設定して、LLM サービスのパフォーマンスの異常を自動的に検出します。
Grafana ダッシュボードのインポート
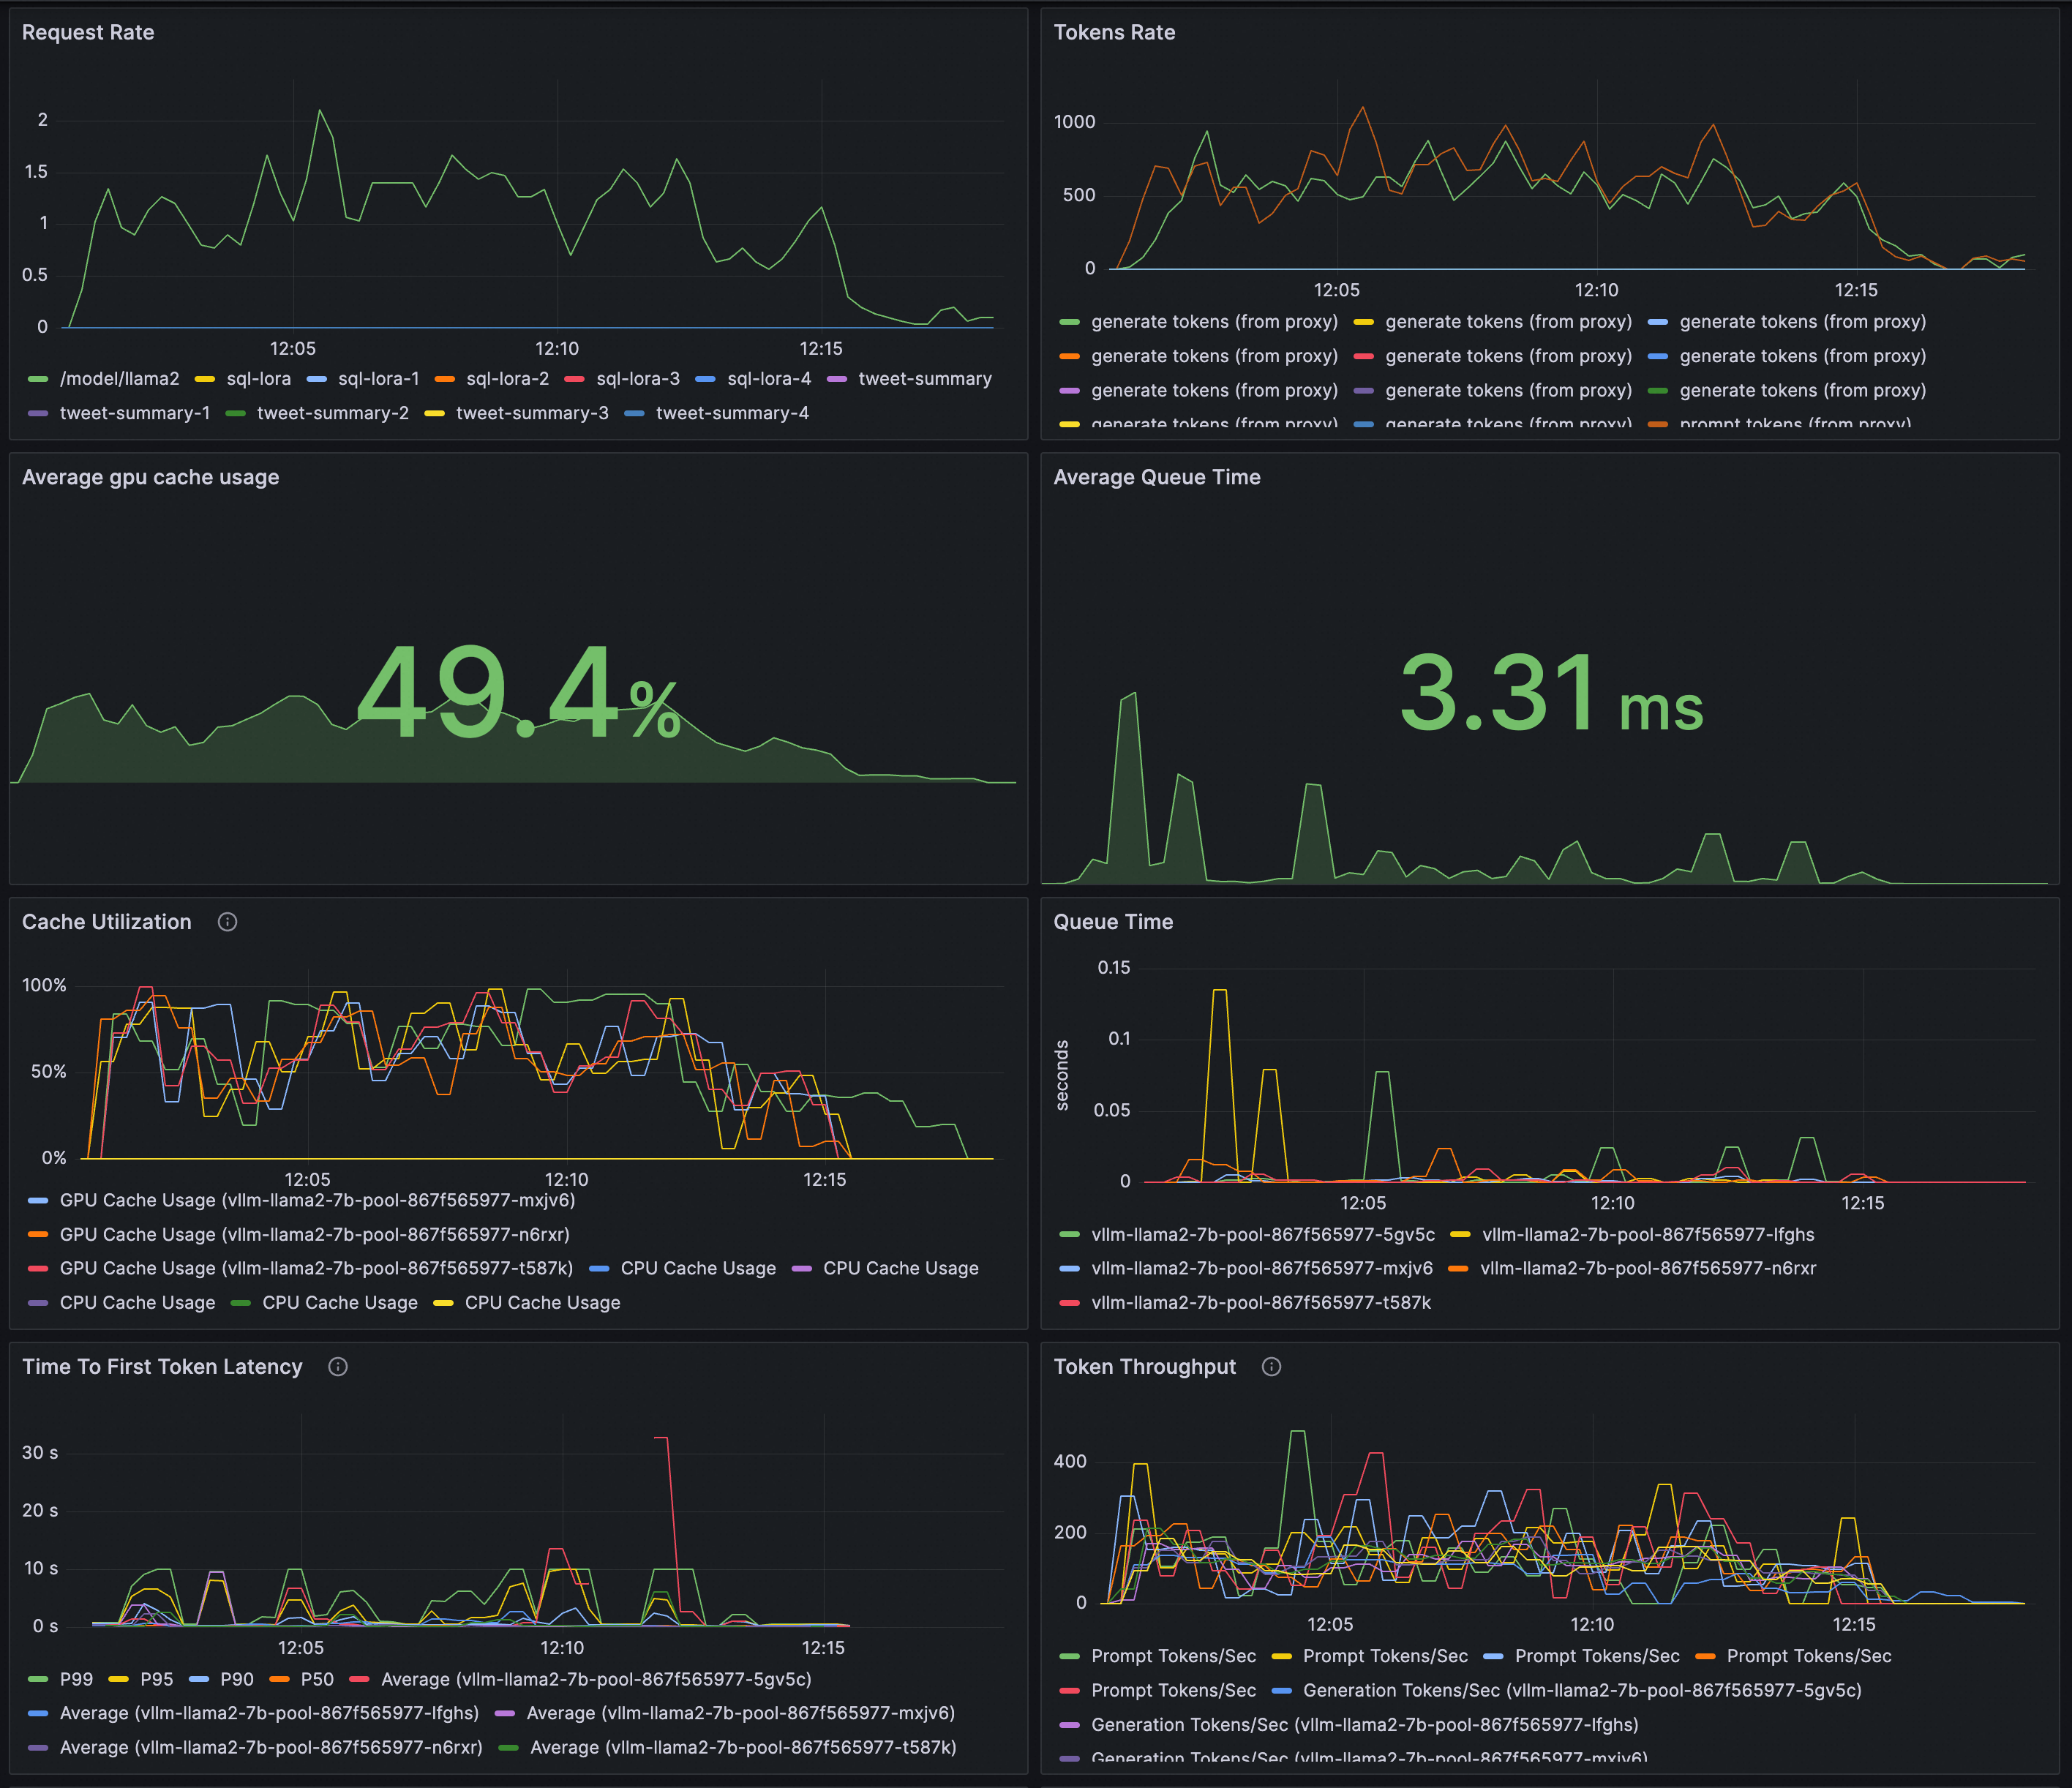
次の JSON を Grafana にインポートして、vLLM デプロイメントのリクエストレート、トークンスループット、最初のトークンまでの時間 (TTFT)、KV キャッシュ使用率、スケジューラ状態、キュー時間を可視化します。
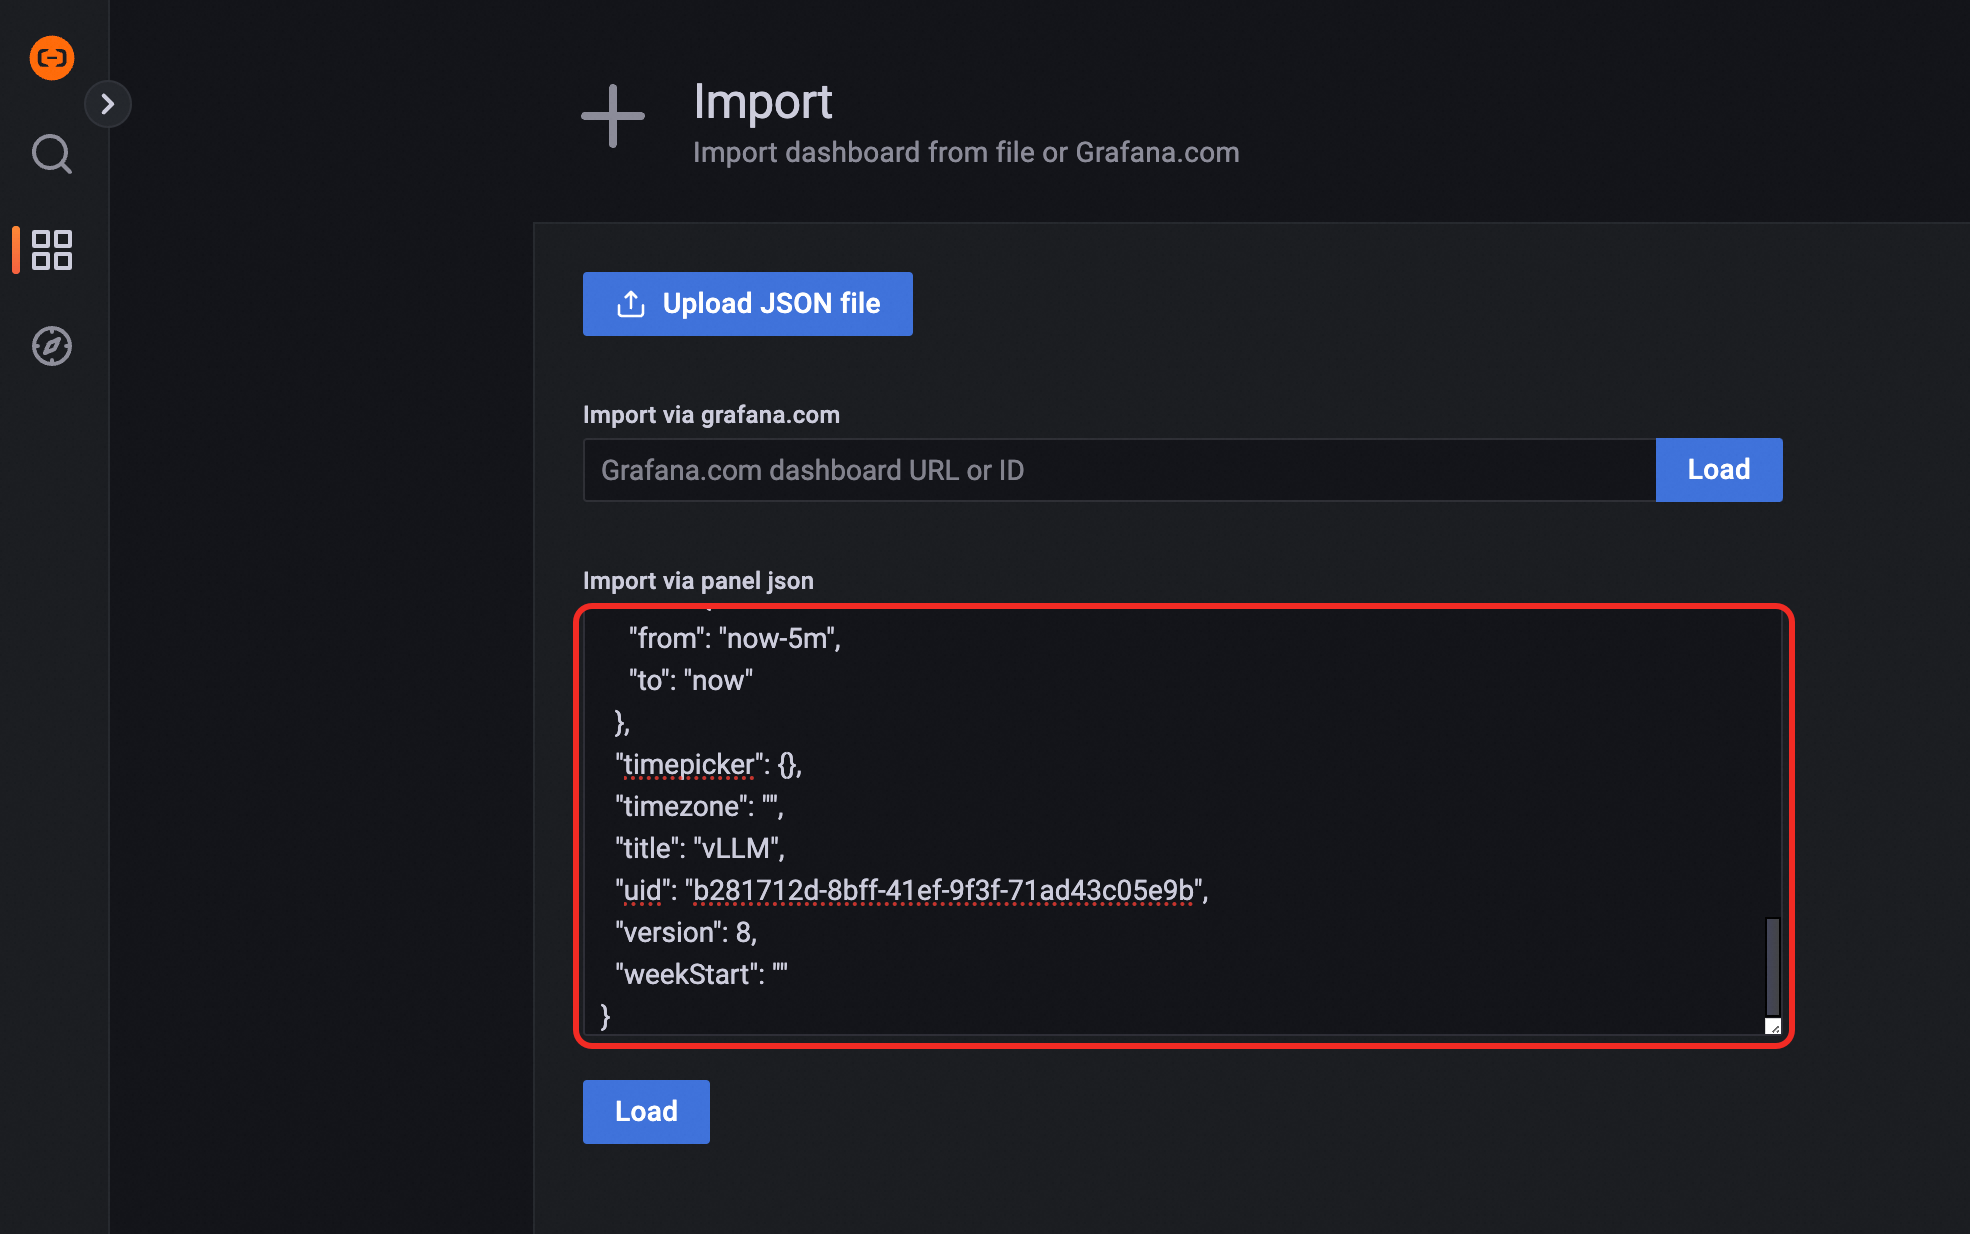
プレビュー:
負荷テストを実行してルーティング戦略を比較
vLLM ベンチマークを使用して両方のルーティングパスにストレステストを実施し、Grafana ダッシュボードで結果を比較します。
ベンチマークワークロードをデプロイします。
kubectl apply -f- <<EOF
apiVersion: apps/v1
kind: Deployment
metadata:
  labels:
    app: vllm-benchmark
  name: vllm-benchmark
  namespace: default
spec:
  progressDeadlineSeconds: 600
  replicas: 1
  revisionHistoryLimit: 10
  selector:
    matchLabels:
      app: vllm-benchmark
  strategy:
    rollingUpdate:
      maxSurge: 25%
      maxUnavailable: 25%
    type: RollingUpdate
  template:
    metadata:
      creationTimestamp: null
      labels:
        app: vllm-benchmark
    spec:
      containers:
      - command:
        - sh
        - -c
        - sleep inf
        image: registry-cn-hangzhou.ack.aliyuncs.com/dev/llm-benchmark:random-and-qa
        imagePullPolicy: IfNotPresent
        name: vllm-benchmark
        resources: {}
        terminationMessagePath: /dev/termination-log
        terminationMessagePolicy: File
      dnsPolicy: ClusterFirst
      restartPolicy: Always
      schedulerName: default-scheduler
      securityContext: {}
      terminationGracePeriodSeconds: 30
EOF
ゲートウェイの内部クラスター IP を取得します。
export GW_IP=$(kubectl get svc -n envoy-gateway-system -l gateway.envoyproxy.io/owning-gateway-namespace=default,gateway.envoyproxy.io/owning-gateway-name=qwen-inference-gateway -o jsonpath='{.items[0].spec.clusterIP}')ストレステストを実行します。
通常の HTTP ルート
kubectl exec -it deploy/vllm-benchmark -- env GW_IP=${GW_IP} python3 /root/vllm/benchmarks/benchmark_serving.py \
--backend vllm \
--model /models/DeepSeek-R1-Distill-Qwen-7B \
--served-model-name /model/qwen \
--trust-remote-code \
--dataset-name random \
--random-prefix-len 10 \
--random-input-len 1550 \
--random-output-len 1800 \
--random-range-ratio 0.2 \
--num-prompts 3000 \
--max-concurrency 200 \
--host $GW_IP \
--port 8080 \
--endpoint /v1/completions \
--save-result \
2>&1 | tee benchmark_serving.txt
推論サービスルート
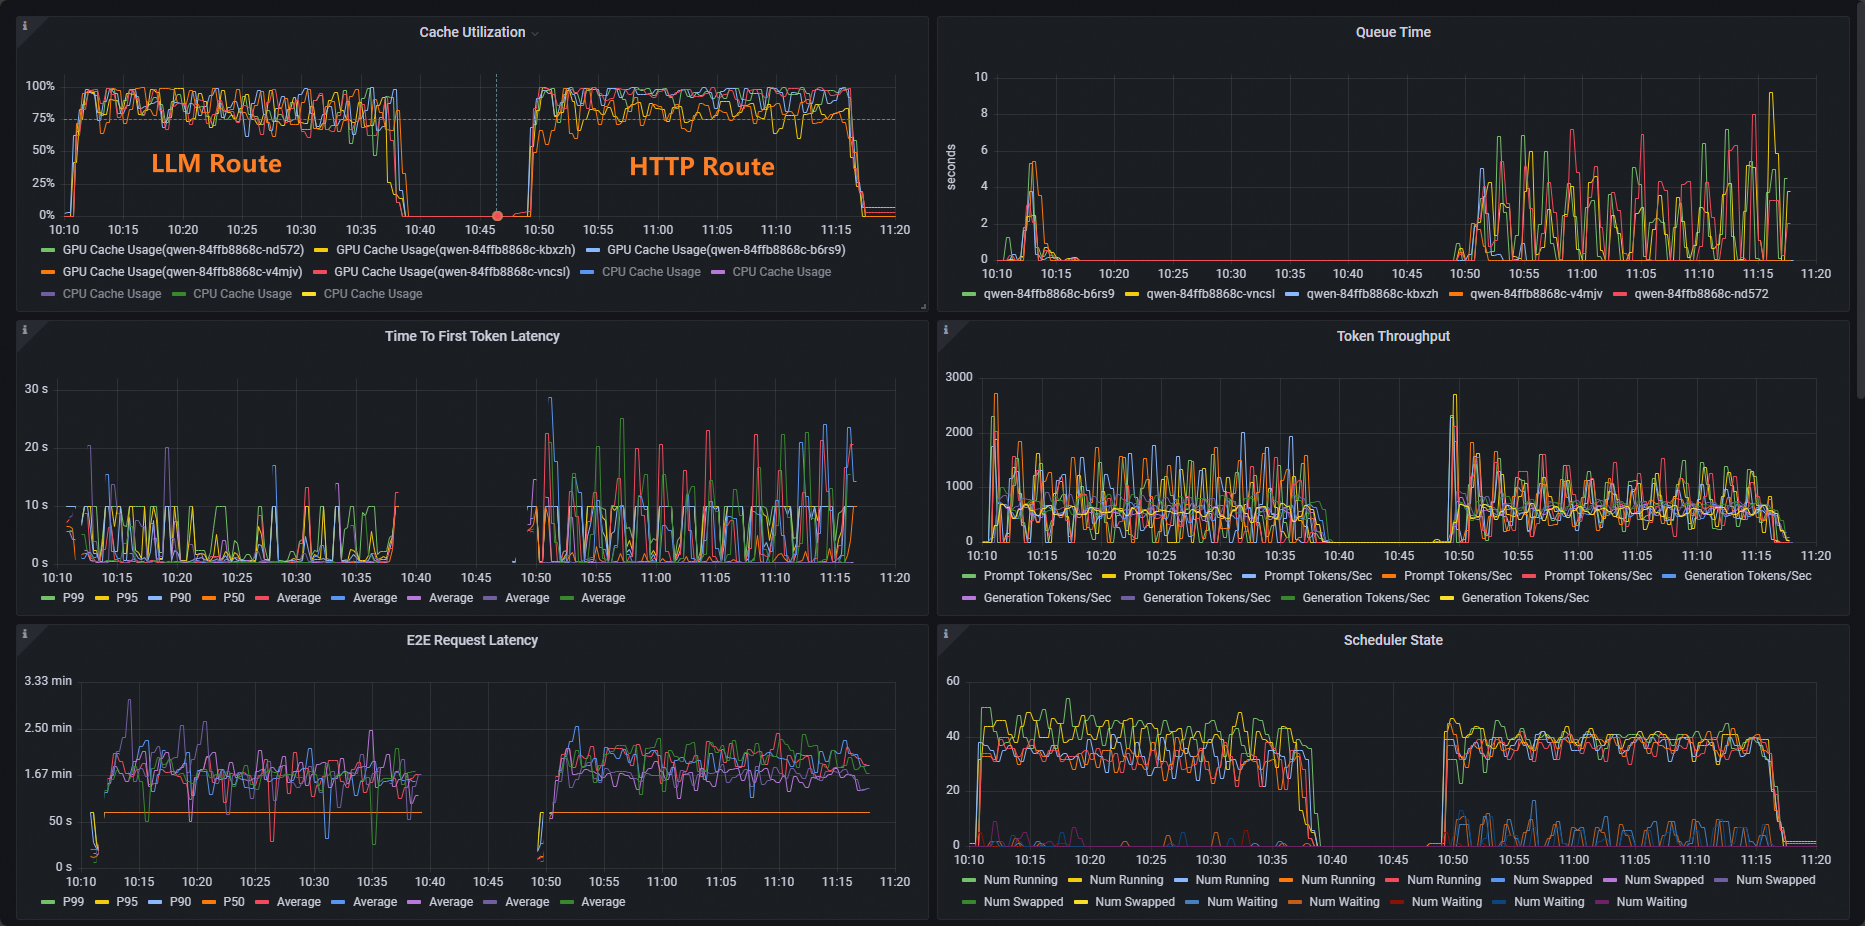
kubectl exec -it deploy/vllm-benchmark -- env GW_IP=${GW_IP} python3 /root/vllm/benchmarks/benchmark_serving.py \
--backend vllm \
--model /models/DeepSeek-R1-Distill-Qwen-7B \
--served-model-name /model/qwen \
--trust-remote-code \
--dataset-name random \
--random-prefix-len 10 \
--random-input-len 1550 \
--random-output-len 1800 \
--random-range-ratio 0.2 \
--num-prompts 3000 \
--max-concurrency 200 \
--host $GW_IP \
--port 8081 \
--endpoint /v1/completions \
--save-result \
2>&1 | tee benchmark_serving.txt
Grafana ダッシュボードで Cache Utilization パネルを開き、2 つの実行結果を比較します。標準の HTTP ルーティングでは、GPU キャッシュの使用率に偏りがあり、一部の Pod は飽和状態になる一方で、他の Pod はアイドル状態になります。推論を意識したルーティングでは、使用率はすべての Pod に均等に分散され、冗長な KV キャッシュの計算が削減され、負荷時のレイテンシーが低下します。
次のステップ
Gateway with Inference Extension は、複数の負荷分散ポリシーをサポートしています。InferencePool に inference.networking.x-k8s.io/routing-strategy アノテーションを設定して、そのプールに適用するポリシーを選択します。
次の例では、デフォルトポリシーを使用しています:
apiVersion: inference.networking.x-k8s.io/v1alpha2
kind: InferencePool
metadata:
  name: vllm-app-pool
  annotations:
    inference.networking.x-k8s.io/routing-strategy: "DEFAULT"
spec:
  targetPortNumber: 8000
  selector:
    app: vllm-app
  extensionRef:
name: inference-gateway-ext-proc| ポリシー | 最適な用途 |
|---|---|
DEFAULT | 一般的なワークロード。リクエストキューの長さと GPU キャッシュの使用率に基づいてルーティングし、すべての Pod 間で負荷を分散します。 |
PREFIX_CACHE | 同じプレフィックスを共有するリクエストが多いワークロード。一致するリクエストを同じ Pod にルーティングして、KV キャッシュの再利用を最大化します。典型的なユースケース:長文ドキュメントの Q&A (ユーザーガイド、年次報告書など) やマルチターン対話。推論サーバーで自動プレフィックスキャッシュ機能を有効にする必要があります。 |