After you add your web services to Web Application Firewall (WAF), you can view the added assets, protection configurations, and security data of the previous 30 days on the Overview page. This allows you to monitor the security status of your web services.
Prerequisites
A WAF 3.0 instance is purchased. For more information, see Purchase a subscription WAF 3.0 instance and Purchase a pay-as-you-go WAF 3.0 instance.
Web services are added to WAF 3.0 as protected objects. For more information, see Configure protected objects and protected object groups.
View the overall data on the Overview page
When you log on to the WAF console, you are directed to an interface based on the region in which your WAF instance is deployed. If your WAF instance is deployed in the Chinese mainland, you are directed to the interface in the China (Hangzhou) region. If your WAF instance is deployed outside the Chinese mainland, you are directed to the interface in the Singapore region.
In the Web Application Firewall 3.0 console, the Overview page displays information in eight sections: Rule Updates and Product Updates, Assets Overview and Protection Configuration, Protection Overview, Protection Data Analysis, Edition Information, API Risk Analysis, Bot Traffic Analysis, and Security Events.
You can view the API Risk Analysis section only if you use a subscription WAF instance.
Rule Updates and Product Updates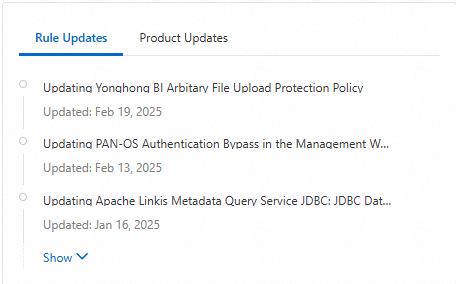
Rule Updates: You can view the protection rules that are recently updated in WAF. You can also click a protection rule to go to the Details panel and view information such as Start Time, Rule Published At, Protection Rule Type, and Rule Description in the panel.
Product Updates: You can view newly released Features/specifications in WAF and features that are newly available in specific Regions/zones. You can also click an update item to view its details.
Assets Overview and Protection Configuration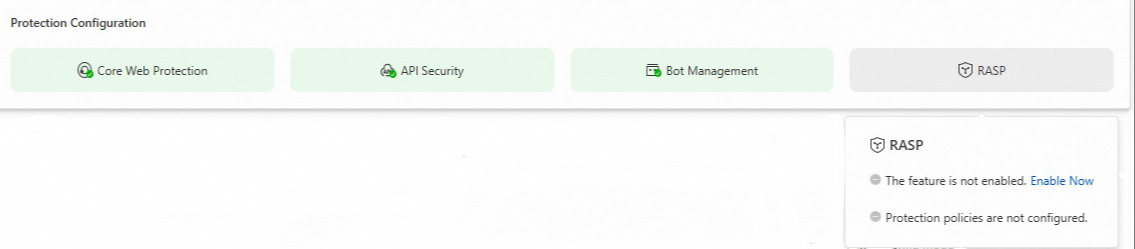
Assets Overview: You can view a summary of assets protected by WAF. Protected Cloud Products specifies the number of Application Load Balancer (ALB), Classic Load Balancer (CLB), and Elastic Compute Service (ECS) instances that are protected by WAF.
Protection Configuration: You can view the configurations of Web Core Protection, API Security, BOT Management, and RASP. If you click a protection module, you are redirected to the configuration page of the module. If you move your pointer over a protection module, you can check whether the protection module is enabled and whether protection rules are configured.
Protection overview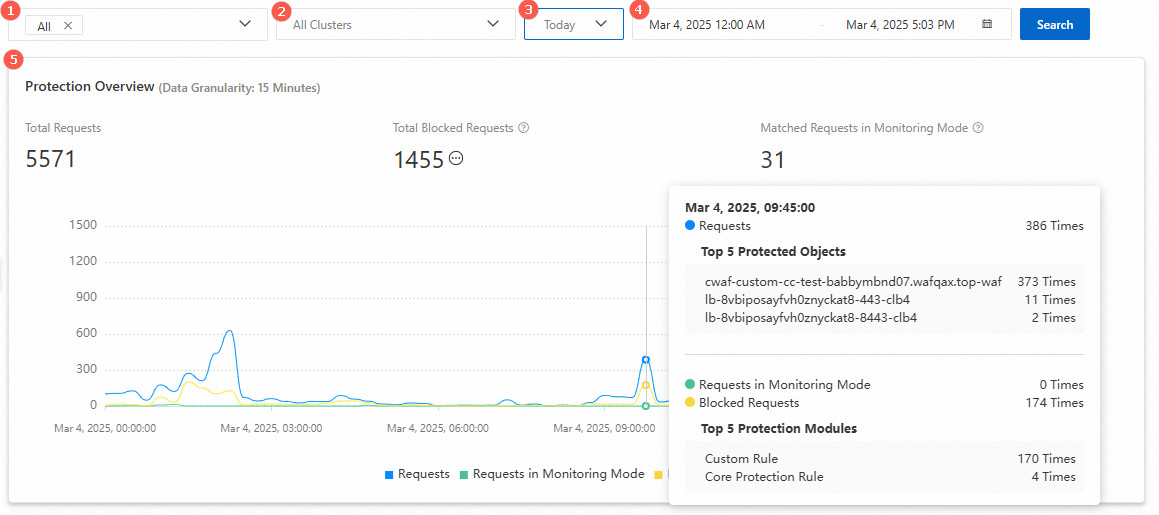
Item | Description |
Protected object (marked 1 in the preceding figure) | By default, All is selected. In this case, you can view the data of all protected objects. You can also query the data of a single or multiple protected objects. |
Protection cluster (marked 2 in the preceding figure) | By default, All Clusters is selected. In this case, you can view the data of all protection clusters. You can also query the data of a single protection cluster. Note You can use this drop-down list to view the traffic and protection status of each cluster only if you added your web services to WAF in hybrid cloud mode. |
Time range (marked 3 in the> | By default, Today is selected. You can also query data in the following time ranges: Last 15 Minutes, Last 30 Minutes, Last 1 Hour, Last 24 Hours, Today, Yesterday, 7 Days, and 30 Days. |
Custom time range (marked 4 in the preceding figure) | You can specify a custom time range to query data more precisely for security report analysis. |
Protection overview (marked 5 in the preceding figure) | You can view the following data within the specified time range: Total Requests, Total Blocked Requests, and Matched Requests in Monitoring Mode. The data is collected based on the protection rules that you configured. The line chart shows the trends of security data for your protected object. You can move your pointer over a specific point in time to view detailed statistics for the time point.
|
Protection data analysis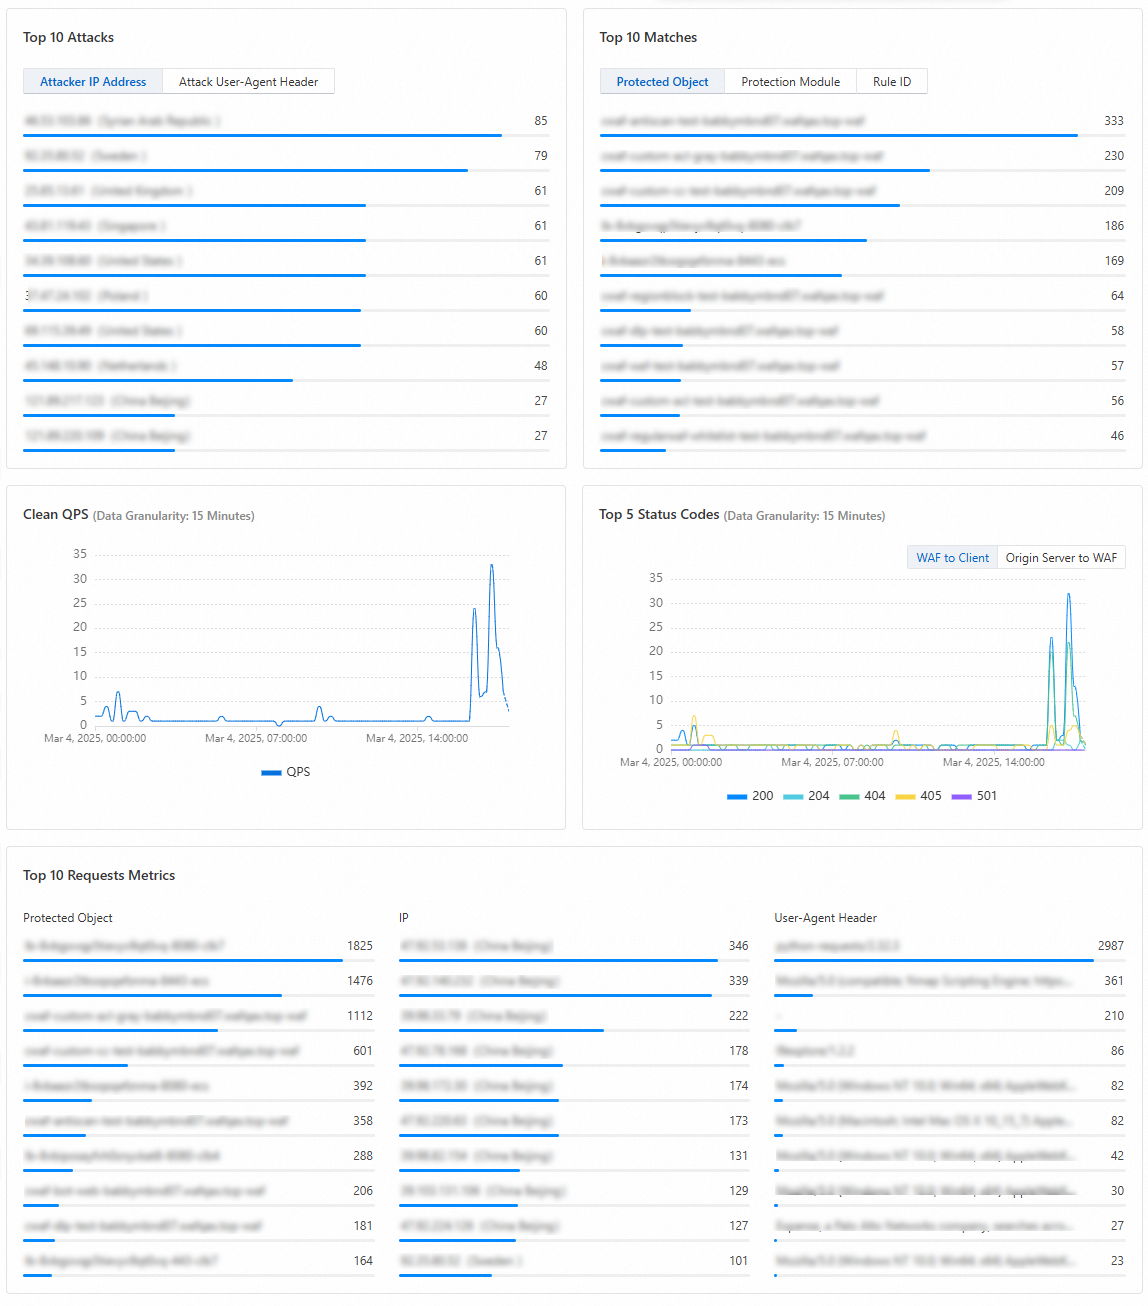
Data type | Description | Supported operation |
Top 10 Attacks | Displays the statistics of the sources that initiate attacks on the protected object in the specified time range.
| Click Attacker IP Address or Attack User-Agent Header to view the corresponding data. Move your pointer over a target item and click View Report to go to the Security Reports page for detailed analysis of your business data. |
Top 10 Matches | Displays the statistics of all protection rules that are matched in the specified time range.
| Click Protected Object, Protection Module, or Rule ID to view the corresponding data. Move your pointer over a data item and click View Report to go to the Security Reports page and view detailed data for analysis. |
Clean QPS | Displays the trend of QPS for requests that are received by the protected object in the specified time range in a line chart. | Move your pointer over a specific point in time on the line chart to view detailed data for the time point. |
Top 5 Status Codes | Displays the top 5 status codes that are most frequently Returned From WAF To Clients and From Origin Servers To WAF in a line chart. | |
Top 10 Requests Metrics | Displays the top 10 statistical items for Protected Object, IP, and User-Agent Header. | None. |
Edition information
Subscription
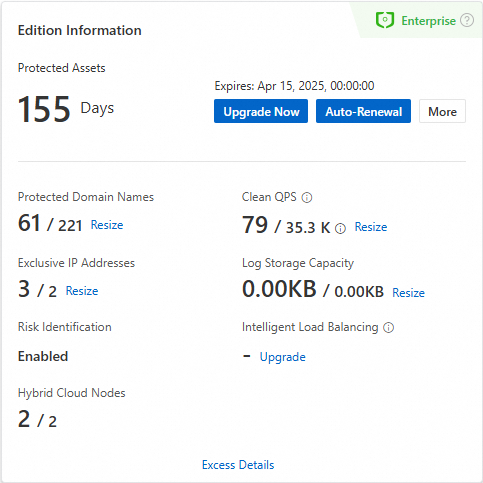
In the Edition Information section, you can view the cumulative duration for which WAF has protected your assets and the expiration time of your subscription WAF instance. If the instance is added to the sandbox, you are notified. You can perform the following operations:
Upgrade Now or Downgrade: You can upgrade the edition of your instance or downgrade the specifications of the value-added services that you purchased.
Auto-Renewal or Renewal: You can enable auto-renewal for your instance or perform a manual renewal.
Unsubscribe: You can unsubscribe only from a subscription WAF instance. After the unsubscribe operation is complete, your instance is released.
NoteIf you enabled multi-cloud/hybrid-cloud protection, bot management for web application protection, bot management for app protection, API security, or major event protection for your subscription WAF instance, you cannot perform the self-service unsubscription operation.
Resize or Upgrade: You can scale out your instance or upgrade existing specifications based on your business changes.
Excess Details: You can view the details of QPS excess events.
Pay-as-you-go
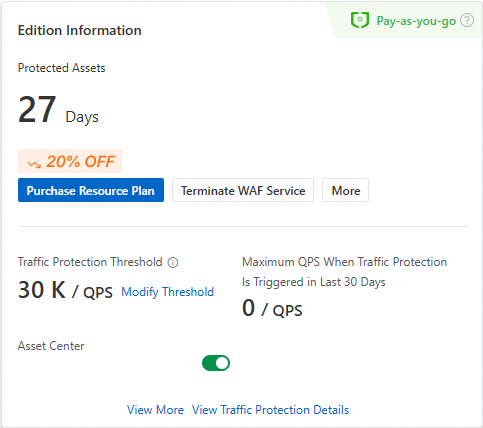
In the Edition Information section, you can view the cumulative duration for which WAF has protected your assets. You can perform the following operations:
Purchase Resource Plan: You can purchase security capacity unit (SeCU) resource plans to offset the traffic processing and feature fees of your pay-as-you-go WAF instance and reduce costs.
Terminate WAF Service: You can directly terminate the WAF service.
Modify Threshold or Modify Traffic Protection Threshold: You can adjust the threshold value for traffic billing protection based on your business changes to prevent your instance from being added to the sandbox.
View More: You can view the usage details of your resource plans in the Expenses and Costs console.
View Traffic Protection Details: You can view QPS usage details.
API risk analysis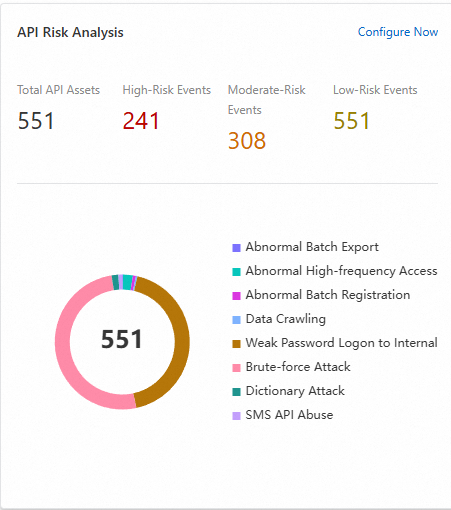
You can view Total API Assets, High-Risk Events, Moderate-Risk Events, and Low-Risk Events. You can also click Configure Now to configure the API security module.
Bot traffic analysis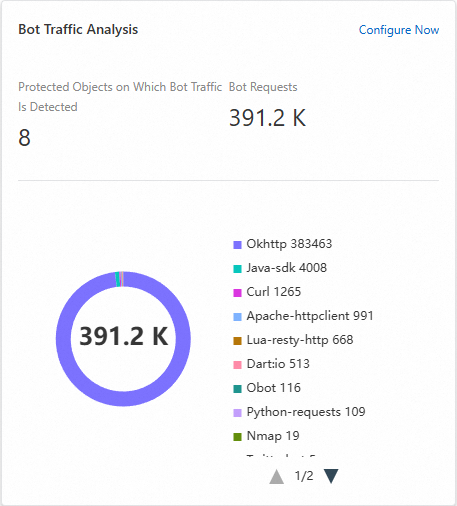
You can view Protected Objects On Which Bot Traffic Is Detected and Bot Requests. You can also click Configure Now to enable and configure the bot management module.
Security events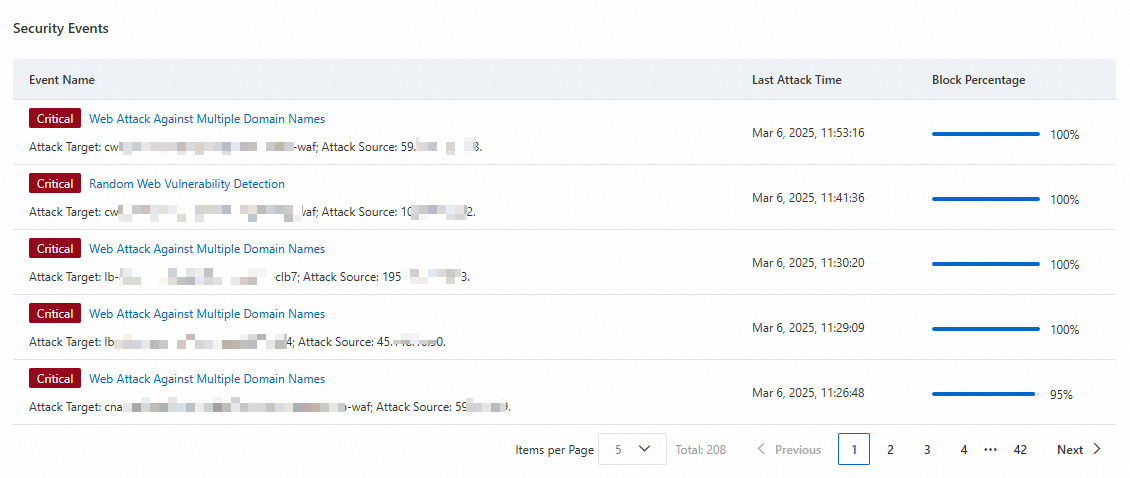
You can view records and details of attack events that occur on protected objects, including the block percentages of the attack events. This helps you intuitively understand the threat situation of your business and obtain handling suggestions.
You can click an event name to go to the Event Details panel. In the panel, you can view threat details and obtain threat handling suggestions in the Threat Intelligence and Suggestions sections. You can also view event details in the Top 5 Attacks section of the panel for simple analysis:
Source IP Address: displays the top 5 client IP addresses from which the most attacks are initiated.
Attack Target: displays the top 5 attacked URLs.
Attack Type: displays the top 5 attack types that are most frequently used, such as SQL injection and cross-site scripting (XSS).
Attack Date: displays the top 5 dates at which the most attacks are initiated.
Attack Tool: displays the top 5 attack tools that are most frequently used, such as cURL and postman-runtime.
In the Event Details panel, you can click View Log to the right of the event name to go to the Simple Log Service page. Then, you can query the related logs to further analyze the attack event.