Configure custom monitoring dashboards and alerts for your Web Application Firewall (WAF)-protected objects using Simple Log Service. This allows you to track overall traffic and security status in real time. This topic describes how to set up custom monitoring and alerting for WAF through Simple Log Service.
Prerequisites
-
You have completed Web service provisioning on the Onboarding page.
Simple Log Service is activated. For more information, see Enable or disable log service.
After you activate Simple Log Service, Simple Log Service (SLS) automatically creates a project and a Logstore for your WAF instance and collects logs from the protected objects you specify into the Logstore. You can then configure custom WAF monitoring and alerting in the Simple Log Service console.
Procedure
In the WAF console, enable log collection for a protected object.
-
Log on to the Web Application Firewall 3.0 console. From the top menu bar, select the resource group and region (Chinese Mainland or Outside Chinese Mainland) for the WAF instance.
-
In the navigation pane on the left, choose .
At the top of the Log Service page, select the protected object whose logs you want to view and toggle Status to enable log collection.
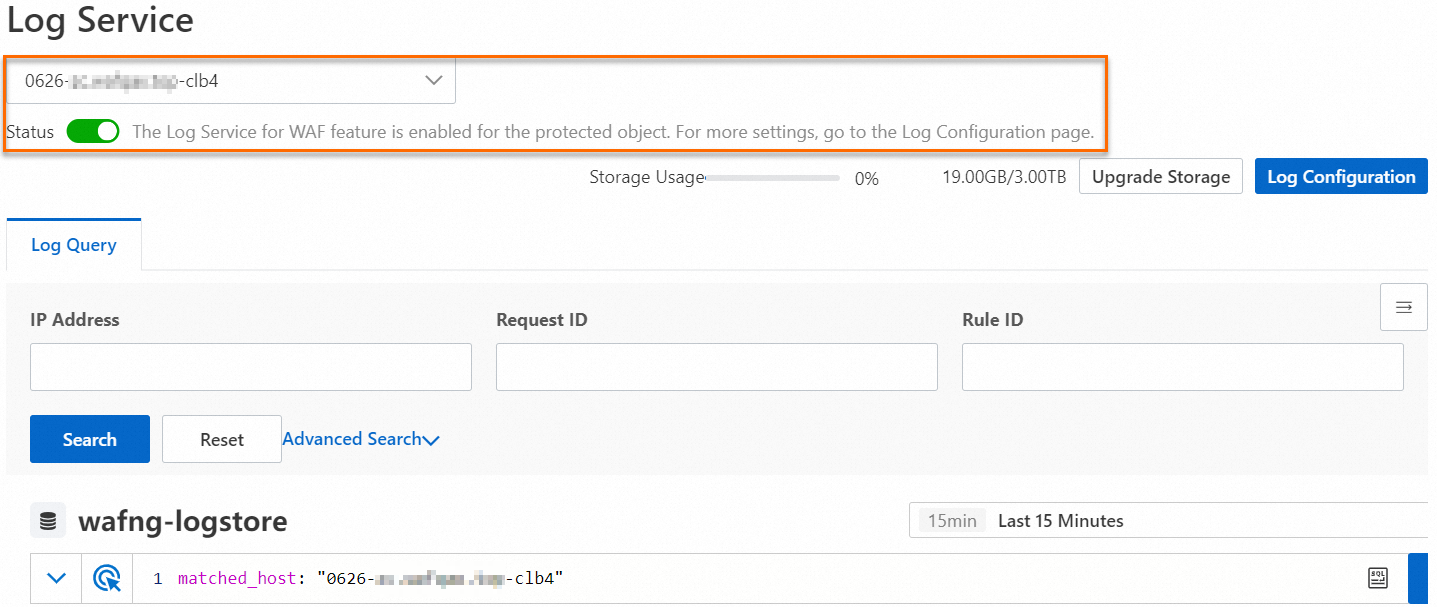
The feature takes effect within a few minutes after you enable it.
-
In the Simple Log Service console, configure alerts.
Create a log analysis dashboard.
Log on to the Simple Log Service console.
In the Projects section, locate the WAF log project you want to manage and click the project name.
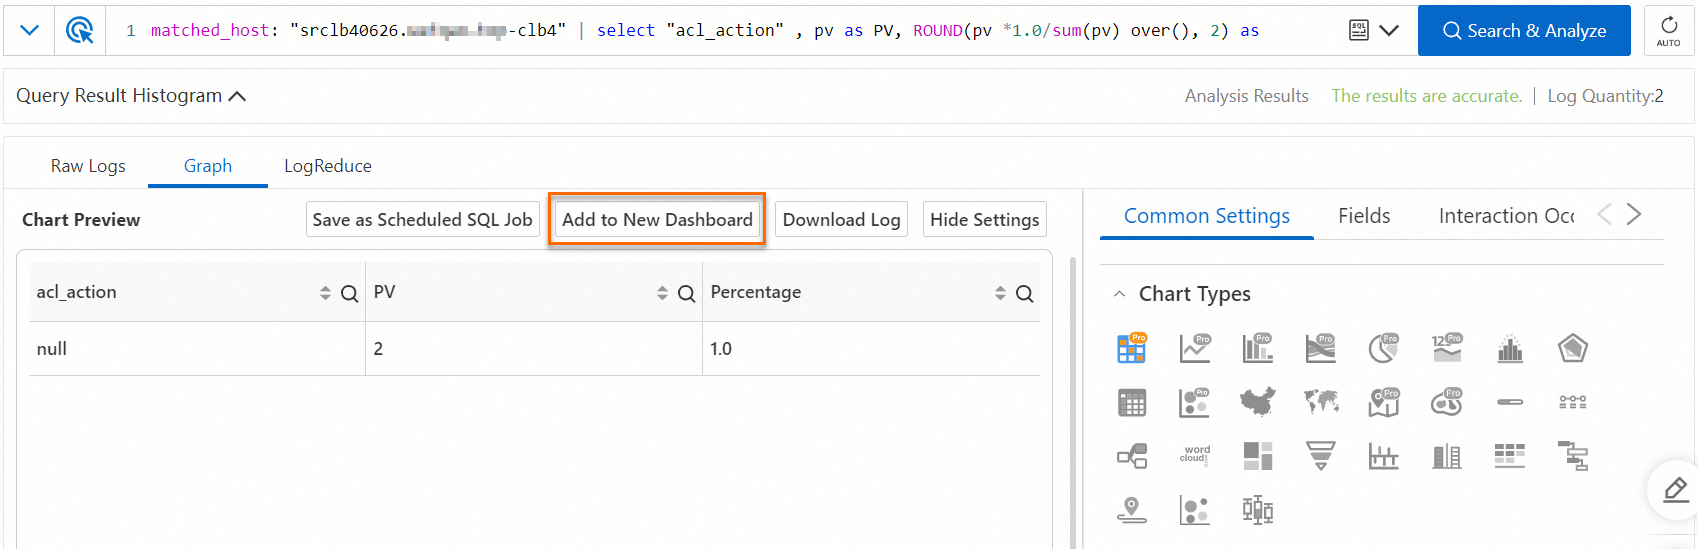
Enter a query statement and click Search & Analyze. For more information, see Step 4.
NoteFor SQL query statements used to monitor and analyze metrics, see Query statements.
After the query completes, go to the Graph tab and click Add to New Dashboard.
In the Add to New Dashboard dialog box, configure the following parameters and click Confirm.
Parameter
Description
Operation
Select Create Dashboard.
Layout Mode
Select a layout mode for the dashboard.
Dashboard Name
Enter a name for the dashboard.
After the dashboard is created, you are redirected to it. By default, the dashboard includes the chart generated from the query statement in Step iii. You can edit the existing chart or add more charts as needed.
Configure dashboard charts.
In the left-side navigation pane of the Simple Log Service console, choose and click the target dashboard.
On the dashboard page, click Edit in the upper-right corner.
In edit mode, you can modify or delete existing charts, or add new charts by copying existing ones.
NoteYou can copy an existing chart and then customize its configuration. This approach lets you add multiple charts to a dashboard for diverse data visualization and alert configurations.
Copy a chart to create a new one
Locate the chart you want to copy, hover over the
 icon in the upper-right corner of the chart, and click Copy.
A copy of the chart appears next to the original.
Drag the copied chart to the desired position on the dashboard.
Modify an existing chart
Locate the chart you want to modify, hover over the
 icon in the upper-right corner of the chart, and click Edit.
On the Edit page, modify the chart configuration such as the chart name, SQL query statement, relative time range, and chart type, and then click OK.
Delete an existing chart
Locate the chart you want to delete, hover over the
icon in the upper-right corner of the chart, and click Delete.
Configure alerts.
On the dashboard page, choose .
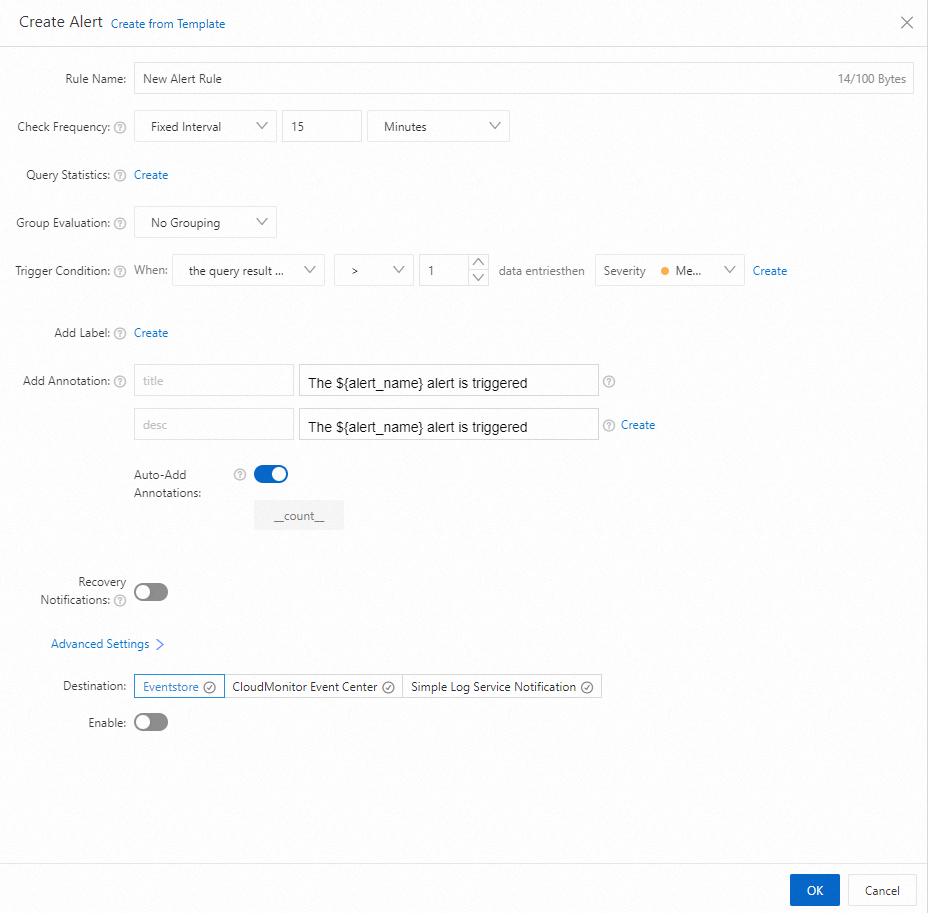
In the Create Alert panel, configure the following parameters and click OK.
The following table describes the required parameters and provides configuration examples.
Parameter
Description
Example
Rule Name
Enter a name for the alert monitoring rule.
WebsiteLogs_AlertRule
Check Frequency
Set the frequency at which Simple Log Service checks query and analysis results. Valid values:
Fixed Interval: Check query and analysis results at a fixed interval.
Cron: Check query and analysis results at an interval specified by a cron expression.
A cron expression supports precision up to the minute and uses a 24-hour clock. For example, 0 0/1 * * * checks results every hour starting at 00:00.
Fixed Interval, 15 minutes
Advanced Settings
Click the input field. In the Advanced Settings dialog box, configure query and analysis statements. For limits on query and analysis, see Query and analysis.
Notification Objects: Select a monitoring dashboard.
Advanced Settings: On the Advanced Settings tab, you can select Logstore, Metricstore, or Resource Data as the data type to monitor.
Logstores: Stores logs. For query and analysis configurations, see Query and analysis quick start.
Metricstore: Stores time-series data. For query and analysis configurations, see Query and analyze metric data.
Resource Data: Associates external data with a specific alert monitoring rule. For more information, see Create resource data.
If you configure multiple query statistics, you can specify Check Frequency to correlate results from multiple queries. For more information, see Configure a query statement.
0: Select the request success ratio chart on the SLB Operation Logs dashboard.
1: Select the response time trend chart on the SLB Operation Logs dashboard.
Set Set Operations to CROSS JOIN.
Group Evaluation
Simple Log Service can group query and analysis results. Valid values:
Custom Label: Simple Log Service groups results based on the fields you specify. Each group is evaluated separately against the trigger condition. An alert is generated for each group that meets the trigger condition within a check period.
You can configure multiple fields.
No Grouping: Only one alert is generated per check period when the trigger condition is met.
No Grouping
Trigger Condition
Set the trigger condition and severity.
Trigger condition
Data is returned: Trigger an alert when query and analysis results contain any data.
The query result contains: Trigger an alert when query and analysis results contain N data entries.
Data matches the expression: Trigger an alert when data in query and analysis results matches a specified expression.
The query result contains and matches: Trigger an alert when N data entries in query and analysis results match a specified expression.
Severity
Used for alert noise reduction and notification control. When you create an alert policy or an action policy, you can add severity-based conditions. For more information, see Set alert severity.
Simple configuration: Select an alert severity directly. All alerts generated by this rule will have the same severity.
Conditional configuration: Click Add to set different severities for different conditions.
For the syntax of conditional expressions in alert rules, see Syntax of trigger conditions in alert rules.
Data matches the expression
$0.success_ratio <90&&$1.Average response time\(s\) >60
Severity: Medium
NoteIf a field name contains parentheses (), you must escape them with a backslash (\).
Add Annotation
Simple Log Service allows you to add non-identifying key-value attributes to generated alerts. These are used for alert noise reduction and notification control. When you create an alert policy or an action policy, you can add annotation-based conditions. For more information, see Add labels and annotations.
You can also enable Add Annotation to automatically add fields such as __count__ to alerts. For more information, see Automatic annotations.
Title: Monitor website request success ratio and average response time
Description: Request success ratio: ${success_ratio}, Average response time: ${Average response time(s)}
Auto-Add Annotations: Enabled
Threshold of Continuous Triggers
Set the consecutive trigger threshold. An alert is generated when the accumulated number of trigger condition matches reaches this value. Occurrences that do not meet the trigger condition are not counted.
1
Destination
The destination to which alerts are sent. Select Simple Log Service Notification.
Simple Log Service Notification
Alert Policy
Alert policies are used to merge, silence, and suppress generated alerts.
If you select Simple Mode or Standard Mode, you do not need to configure an alert policy. Simple Log Service uses the built-in dynamic alert policy
sls.builtin.dynamicby default.If you select Advanced Mode, you can select a built-in or custom alert policy. For more information about creating an alert policy, see Create an alert policy.
Simple Mode
Action Policy
Action policies control alert notification channels and frequency.
When Alert Policy is set to Simple Mode, you only need to configure an action group.
After you configure the action group, Simple Log Service automatically creates an action policy named
Rule name-Action policy. All alerts triggered by this alert monitoring rule send notifications through this action policy. For configuration details, see Notification channels.ImportantYou can modify the action policy on the Action Policy management page. For more information, see Action policies. If you add conditions when modifying the action policy, the Alert Policy setting automatically changes to Standard Mode.
When Alert Policy is set to Standard Mode or Advanced Mode, you can select a built-in or custom action policy to send alert notifications. For more information about creating an action policy, see Action policies.
If Alert Policy is set to Advanced Mode, you can also enable or disable Custom Action Policy. For more information, see Dynamic action policy mechanism.
Channel: SMS
Recipient: LogServiceOperations
Alert Template: SLS built-in content template
Period: Any Time
Check Frequency
During the repeat wait period, duplicate alerts trigger the selected action policy only once, sending only one notification.
5 Minutes
In the left-side navigation pane, click the
 icon to view created alert rules and configure Notification Objects, Notification Management, and more. For more information, see Step 1: configure notification recipients and Create an alert policy.
After you create an alert monitoring rule, Simple Log Service monitors query and analysis results based on the rule. When the results meet the trigger condition, an alert is generated. You can view alert records in the Alert Rule Center dashboard. For more information, see Step 4: view alert history.
References
For information about WAF log charts and sample alert configurations—including alerts for abnormal 4xx ratios (excluding blocked requests), abnormal 5xx ratios, abnormal QPS, and protection rule block activity in the last 5 minutes—see Alert configuration examples for WAF logs.